Atualizado
EMA Cloud
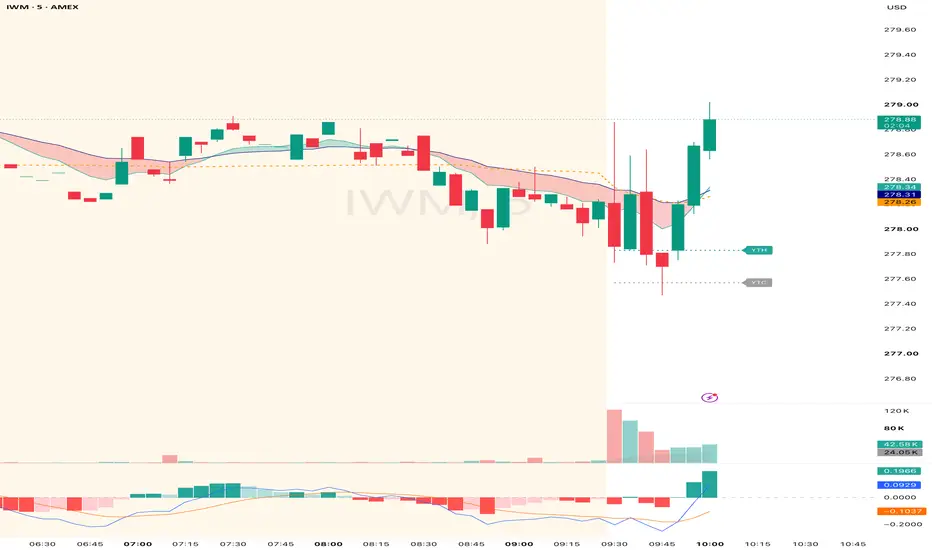
EMA Cloud
Description
EMA Cloud is a clean, highly customizable indicator that visualizes the relationship between 8-period and 21-period moving averages as a dynamic cloud overlay. Perfect for identifying trends, momentum shifts, and potential entry/exit zones at a glance.
🔑 Key Features
Dual EMA Support – Choose between EMA or SMA for both moving averages
Visual Cloud Overlay – Shaded cloud between EMA 8 and EMA 21 with customizable colors:
🟢 Bullish Cloud (green) when EMA 8 > EMA 21
🔴 Bearish Cloud (red) when EMA 8 < EMA 21
Adjustable Parameters – Customize EMA lengths, line widths, and cloud transparency
Toggle Display Options – Show/hide the cloud or EMA lines independently
Comprehensive Alert System – Get notified on:
EMA 8 crossing above/below EMA 21
Price crossing above/below EMA 8
Price crossing above/below EMA 21
📈 How to Use
Trend Identification – Green cloud indicates bullish momentum; red cloud signals bearish momentum
Entry Signals – Look for cloud color changes (crossovers) as potential entry points
Support/Resistance – The EMA lines within the cloud can act as dynamic support/resistance levels
Confirmation Tool – Combine with price action or other indicators for confluence
⚙️ Settings
Setting Description
EMA Type EMA or SMA
EMA 8 & 21 Length Customizable period lengths
Cloud Transparency Adjust opacity (0-100%)
Line Width Thickness of EMA lines
Colors Fully customizable bullish/bearish colors
Alerts 6 configurable alert conditions
💡 Best Practices
Works on all timeframes and all assets (stocks, forex, crypto, futures)
Lower timeframes: Use for scalping and intraday trades
Higher timeframes: Ideal for swing trading and trend following
Combine with volume analysis for stronger signals
Description
EMA Cloud is a clean, highly customizable indicator that visualizes the relationship between 8-period and 21-period moving averages as a dynamic cloud overlay. Perfect for identifying trends, momentum shifts, and potential entry/exit zones at a glance.
🔑 Key Features
Dual EMA Support – Choose between EMA or SMA for both moving averages
Visual Cloud Overlay – Shaded cloud between EMA 8 and EMA 21 with customizable colors:
🟢 Bullish Cloud (green) when EMA 8 > EMA 21
🔴 Bearish Cloud (red) when EMA 8 < EMA 21
Adjustable Parameters – Customize EMA lengths, line widths, and cloud transparency
Toggle Display Options – Show/hide the cloud or EMA lines independently
Comprehensive Alert System – Get notified on:
EMA 8 crossing above/below EMA 21
Price crossing above/below EMA 8
Price crossing above/below EMA 21
📈 How to Use
Trend Identification – Green cloud indicates bullish momentum; red cloud signals bearish momentum
Entry Signals – Look for cloud color changes (crossovers) as potential entry points
Support/Resistance – The EMA lines within the cloud can act as dynamic support/resistance levels
Confirmation Tool – Combine with price action or other indicators for confluence
⚙️ Settings
Setting Description
EMA Type EMA or SMA
EMA 8 & 21 Length Customizable period lengths
Cloud Transparency Adjust opacity (0-100%)
Line Width Thickness of EMA lines
Colors Fully customizable bullish/bearish colors
Alerts 6 configurable alert conditions
💡 Best Practices
Works on all timeframes and all assets (stocks, forex, crypto, futures)
Lower timeframes: Use for scalping and intraday trades
Higher timeframes: Ideal for swing trading and trend following
Combine with volume analysis for stronger signals
Notas de Lançamento
- Added Key Levels controls in Trading View/EMA Cloud.pine:
- Show Yesterday High/Low/Close (single toggle)
- Show Premarket High/Low (default off)
- Show Monday High/Low (default off)
- Key Level Line Style (Dotted / Regular)
- Added level calculations for:
- Yesterday high/low/close (YTH, YTL, YTC)
- Premarket high/low (PMH, PML, session 0400-0930)
- Most recent Monday high/low (MH, ML)
- Added right-side key level lines using drawing objects:
- Render near right edge (last bars), not full-chart historical plots
- Per-level color coding
- Dynamic line style via input (Dotted or Regular)
- Added right-side labels for all key levels:
- YTH, YTL, YTC, PMH, PML, MH, ML
- Increased label size from tiny to small
- Added alert support for all key levels:
- Cross above and cross below conditions for each level
- Alerts are gated by Enable Alerts and each level group’s toggle
- Refactored alert cross logic to fix Pine warning CW10002:
- ta.crossover/ta.crossunder now computed in unconditional raw variables each bar
- Toggle/na filters applied afterward for consistency
- Preserved existing behavior for:
- MA cloud, MA lines, and original MA/price-cross alert conditions.
Notas de Lançamento
- Hides YTC by default
- Changes YTH/YTL colors and makes them solid by default
Notas de Lançamento
- Update default colors
Notas de Lançamento
- Updates default colors and fixes alert issues
Notas de Lançamento
- Fixes an issue YTH, YTL calculations
Notas de Lançamento
New- Chart MA Display: one dropdown (Off / Cloud / Lines / Cloud + Lines) replaces the separate "Show MA Cloud" and "Show MA Lines" toggles.
- Key Level Display: choose "Full lines" or "Near price + edge". In Near price + edge mode, a level more than 2x daily ATR from price (adjustable) shrinks to a short marker at the right edge, which keeps the chart uncluttered.
Improvements
- Yesterday's High, Low and Close (YTH/YTL/YTC) now come from the completed regular-session daily bar. They show correctly however much intraday history is loaded and whether extended hours are on or off, and they don't repaint.
- MA inputs are labeled Fast/Slow instead of 8/21. Alert messages now use your actual lengths, for example "8/21 bullish crossover happened".
- MA lines, the cloud and YTH/YTL/YTC show on intraday charts only.
Default changes
- MA lines are now on by default (Cloud + Lines).
- Cloud transparency defaults to 70 (was 80) and is capped at 90, so the cloud can't disappear completely.
- Yesterday Close (YTC) is now on by default.
Heads-up
- The crossover alerts are renamed "MA Cloud Bullish Crossover" and "MA Cloud Bearish Crossover", and the price-cross alerts now say Fast MA or Slow MA. Alerts you already have keep running on the old version, so recreate them to get the new names and messages.
- Some inputs and plots were renamed or replaced, so a few saved settings (display toggles, MA line colors and styles) may go back to their defaults after this update.

Aviso legal
As informações e publicações não se destinam a ser, e não constituem, conselhos ou recomendações financeiras, de investimento, comerciais ou de outro tipo fornecidos ou endossados pela TradingView. Leia mais nos Termos de Uso.
Aviso legal
As informações e publicações não se destinam a ser, e não constituem, conselhos ou recomendações financeiras, de investimento, comerciais ou de outro tipo fornecidos ou endossados pela TradingView. Leia mais nos Termos de Uso.