Atualizado
0DTE Fly Suite
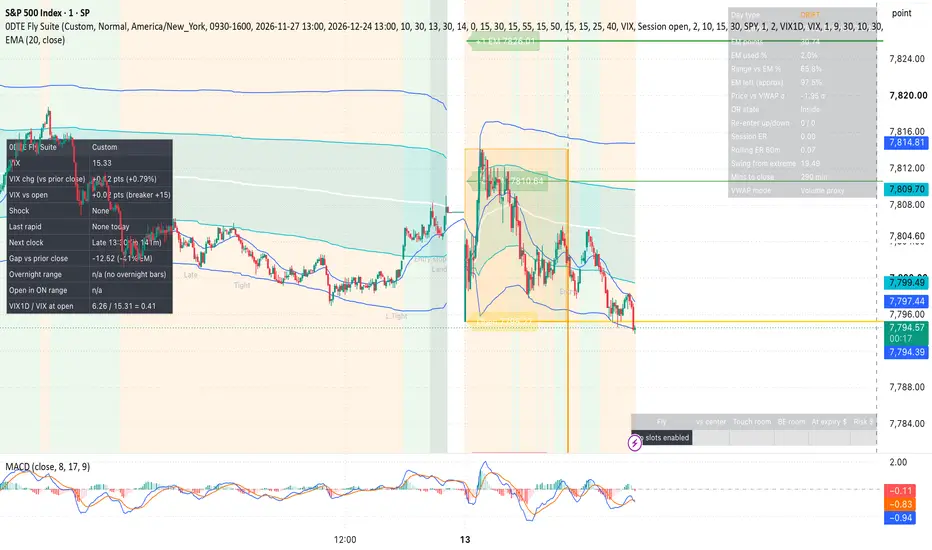
WHY THIS EXISTS
Multi-entry 0DTE iron butterfly strategies on SPX need three things on screen at once: what kind of day it is (pinning, drifting, trending or whipsawing), where the strategy is on its clock and whether something abrupt just happened, and how each open fly is doing against price. I used to run three separate indicators for that: "0DTE Fly Monitor", "0DTE Clock & Shocks" and "My Theta Fly's". This script merges all three into one overlay with one shared session, one set of daily resets and one input panel, and adds the pieces I kept wishing the separate scripts had. Every part has its own on/off switch under "Suite sections", so you can run only what you need.
WHAT IT SHOWS
Expected move. Taken from VIX1D shortly after the open (09:31 ET by default, with VIX as a fallback) and converted to a one-day point range: open × VIX1D/100 × √(1/252). Lines at the open, ±0.5 EM and ±1 EM. The value is latched so it does not move during the day.
Session VWAP with ±1 and ±2 standard-deviation bands. SPX has no volume, so SPY volume is used as the weighting (selectable), with an HLC3 fallback.
Opening range (09:30–10:30 ET by default) with a state of Inside, Broke Up or Broke Down. A break only counts when a bar closes a set distance outside the range.
Day type, in the table and as a faint background color:
PIN/RANGE (green): low directional efficiency and price within ±1 SD of VWAP.
DRIFT (orange): everything in between.
TREND (red): high efficiency and price held beyond ±1 SD on one side for 30 minutes.
WIDE CHOP (purple): low efficiency, but the session range has already reached 100% of the expected move.
WHIPSAW (fuchsia): any non-trend day whose range has passed 150% of the expected move. These are the days that look calm on a snapshot and cost flies the most.
Bot clock. Dashed vertical lines with labels for the phases of the day: Entry, Late, Tight, Late tight, Land, plus an optional entry-stop line (with light shading after it) and an optional close-all line. Choose "Custom" to set your own times, or pick a bot preset to load a fixed schedule. The presets match the automated fly bots I run (the Theta Fly Trap variants and Iron Squadron). The Iron Squadron times are not confirmed, so check them against your own bot before relying on them. An alert can fire at each clock time.
Shocks. A marker on the bar and a table update when:
Rapid move: SPX moves 25 points in 1 minute or 40 points in 2 minutes (measured on 1-minute data).
VIX warning: VIX up 2 points or 10% from the open (or the prior close).
VIX breaker: VIX up 15 points from the open, the level at which some fly bots close everything for the day.
A "VIX above 30" note also shows before 13:30 when a preset that delays entries on high VIX is selected.
Pre-market rows: gap versus the prior close as a share of EM, overnight range as a share of EM, where the open sits inside the overnight range, and VIX1D ÷ VIX at the open. The overnight rows need a symbol with overnight bars such as SPCFD; CBOE:SPX has none.
Event day. TradingView cannot read an economic calendar, so you set FOMC, CPI, NFP, OpEx or Other by hand and it shows in the table. Early-close days (prefilled with 2026-11-27 and 2026-12-24 at 13:00) end the session, the clock lines and the minutes-to-close count early.
MY FLIES
Up to 10 slots. For each fly enter the center strike, credit received, wing width and a label, and optionally the entry and exit time (New York, e.g. 10:35) and the P/L in dollars. While a fly is open, its center and breakeven lines are drawn. Once it has an exit time, it is drawn as a box from entry to exit, colored and tagged with the P/L. The table shows, per fly: distance from the center, room to the touch level, room to the nearer breakeven, the value per contract if SPX settled here, and the maximum risk per contract. Touch levels are drawn at a set percentage of the credit (95% by default). With a Theta Fly Trap preset, touch zones are hidden and the breakeven alert fires as soon as price crosses, because that bot exits intrabar.
OPTIONAL, OFF BY DEFAULT
Levels: prior-day high, low and close (the gap-fill level), plus overnight high and low.
Key strikes: paste your own levels, one per line or comma separated, e.g. "7800 call wall".
Bias block: smoothed NYSE TICK, ADD and VOLD, plus the VIX1D change since the open. Each scores +1, 0 or -1, and a total of ±2 or more reads Up or Down. Context only. If your account has no USI data these rows show n/a.
HOW TO READ THE TABLE
EM used %: distance from the open as a share of the expected move.
Range vs EM %: session high minus low as a share of the expected move. A low "EM used" with a high "Range vs EM" means price has travelled a long way and come back.
EM left (approx): VIX1D now, scaled by the square root of the minutes left, as a rough guide to how much movement is still priced in.
Price vs VWAP σ: distance from VWAP in standard deviations.
Session ER and Rolling ER: Kaufman efficiency ratio (net move ÷ total path) since the open and over the last 60 minutes. Near 0 is chop, near 1 is a straight line.
Swing from extreme: points from the current price back to the farther session extreme.
HOW I USE IT
I run it on SPX 1-minute with my bot's preset selected. Before a first entry and before any late-day stacking I check the day type and Range vs EM. The shock and breakeven alerts are the ones I keep armed. Alerts included: clock times, rapid move (up, down, either), VIX warning, VIX breaker, day type changing to TREND, WIDE CHOP or WHIPSAW, opening-range break, close outside ±2 SD, EM used crossing 100%, and fly touch and breakeven crosses. The clock and shock messages use "Any alert() function call"; the rest are listed individually under Add alert.
SETTINGS TO CHECK FIRST
Bot preset (top of the inputs). Keep the timezone on America/New_York even if your chart clock is set elsewhere. Re-enter your flies in the slots each day. With every section on, the context table gets long; each table's position and text size are under "Tables".
LIMITS
This is a context display with alerts. It is not a signal generator and it places no orders. All thresholds (efficiency 0.25 and 0.45, 100% and 150% of EM, the 30-minute hold, the shock sizes) are inputs and untested starting values, not optimized ones. TradingView has no options data, so nothing here uses gamma exposure or live option prices: the expected move is an approximation from VIX1D, and fly values assume settlement at the current price. Data for VIX, VIX1D, SPY and the USI symbols may be delayed depending on your subscription. Built for CBOE:SPX and SPCFD during the 09:30–16:00 New York session. State updates on confirmed bars and uses no lookahead. Not financial advice.
Multi-entry 0DTE iron butterfly strategies on SPX need three things on screen at once: what kind of day it is (pinning, drifting, trending or whipsawing), where the strategy is on its clock and whether something abrupt just happened, and how each open fly is doing against price. I used to run three separate indicators for that: "0DTE Fly Monitor", "0DTE Clock & Shocks" and "My Theta Fly's". This script merges all three into one overlay with one shared session, one set of daily resets and one input panel, and adds the pieces I kept wishing the separate scripts had. Every part has its own on/off switch under "Suite sections", so you can run only what you need.
WHAT IT SHOWS
Expected move. Taken from VIX1D shortly after the open (09:31 ET by default, with VIX as a fallback) and converted to a one-day point range: open × VIX1D/100 × √(1/252). Lines at the open, ±0.5 EM and ±1 EM. The value is latched so it does not move during the day.
Session VWAP with ±1 and ±2 standard-deviation bands. SPX has no volume, so SPY volume is used as the weighting (selectable), with an HLC3 fallback.
Opening range (09:30–10:30 ET by default) with a state of Inside, Broke Up or Broke Down. A break only counts when a bar closes a set distance outside the range.
Day type, in the table and as a faint background color:
PIN/RANGE (green): low directional efficiency and price within ±1 SD of VWAP.
DRIFT (orange): everything in between.
TREND (red): high efficiency and price held beyond ±1 SD on one side for 30 minutes.
WIDE CHOP (purple): low efficiency, but the session range has already reached 100% of the expected move.
WHIPSAW (fuchsia): any non-trend day whose range has passed 150% of the expected move. These are the days that look calm on a snapshot and cost flies the most.
Bot clock. Dashed vertical lines with labels for the phases of the day: Entry, Late, Tight, Late tight, Land, plus an optional entry-stop line (with light shading after it) and an optional close-all line. Choose "Custom" to set your own times, or pick a bot preset to load a fixed schedule. The presets match the automated fly bots I run (the Theta Fly Trap variants and Iron Squadron). The Iron Squadron times are not confirmed, so check them against your own bot before relying on them. An alert can fire at each clock time.
Shocks. A marker on the bar and a table update when:
Rapid move: SPX moves 25 points in 1 minute or 40 points in 2 minutes (measured on 1-minute data).
VIX warning: VIX up 2 points or 10% from the open (or the prior close).
VIX breaker: VIX up 15 points from the open, the level at which some fly bots close everything for the day.
A "VIX above 30" note also shows before 13:30 when a preset that delays entries on high VIX is selected.
Pre-market rows: gap versus the prior close as a share of EM, overnight range as a share of EM, where the open sits inside the overnight range, and VIX1D ÷ VIX at the open. The overnight rows need a symbol with overnight bars such as SPCFD; CBOE:SPX has none.
Event day. TradingView cannot read an economic calendar, so you set FOMC, CPI, NFP, OpEx or Other by hand and it shows in the table. Early-close days (prefilled with 2026-11-27 and 2026-12-24 at 13:00) end the session, the clock lines and the minutes-to-close count early.
MY FLIES
Up to 10 slots. For each fly enter the center strike, credit received, wing width and a label, and optionally the entry and exit time (New York, e.g. 10:35) and the P/L in dollars. While a fly is open, its center and breakeven lines are drawn. Once it has an exit time, it is drawn as a box from entry to exit, colored and tagged with the P/L. The table shows, per fly: distance from the center, room to the touch level, room to the nearer breakeven, the value per contract if SPX settled here, and the maximum risk per contract. Touch levels are drawn at a set percentage of the credit (95% by default). With a Theta Fly Trap preset, touch zones are hidden and the breakeven alert fires as soon as price crosses, because that bot exits intrabar.
OPTIONAL, OFF BY DEFAULT
Levels: prior-day high, low and close (the gap-fill level), plus overnight high and low.
Key strikes: paste your own levels, one per line or comma separated, e.g. "7800 call wall".
Bias block: smoothed NYSE TICK, ADD and VOLD, plus the VIX1D change since the open. Each scores +1, 0 or -1, and a total of ±2 or more reads Up or Down. Context only. If your account has no USI data these rows show n/a.
HOW TO READ THE TABLE
EM used %: distance from the open as a share of the expected move.
Range vs EM %: session high minus low as a share of the expected move. A low "EM used" with a high "Range vs EM" means price has travelled a long way and come back.
EM left (approx): VIX1D now, scaled by the square root of the minutes left, as a rough guide to how much movement is still priced in.
Price vs VWAP σ: distance from VWAP in standard deviations.
Session ER and Rolling ER: Kaufman efficiency ratio (net move ÷ total path) since the open and over the last 60 minutes. Near 0 is chop, near 1 is a straight line.
Swing from extreme: points from the current price back to the farther session extreme.
HOW I USE IT
I run it on SPX 1-minute with my bot's preset selected. Before a first entry and before any late-day stacking I check the day type and Range vs EM. The shock and breakeven alerts are the ones I keep armed. Alerts included: clock times, rapid move (up, down, either), VIX warning, VIX breaker, day type changing to TREND, WIDE CHOP or WHIPSAW, opening-range break, close outside ±2 SD, EM used crossing 100%, and fly touch and breakeven crosses. The clock and shock messages use "Any alert() function call"; the rest are listed individually under Add alert.
SETTINGS TO CHECK FIRST
Bot preset (top of the inputs). Keep the timezone on America/New_York even if your chart clock is set elsewhere. Re-enter your flies in the slots each day. With every section on, the context table gets long; each table's position and text size are under "Tables".
LIMITS
This is a context display with alerts. It is not a signal generator and it places no orders. All thresholds (efficiency 0.25 and 0.45, 100% and 150% of EM, the 30-minute hold, the shock sizes) are inputs and untested starting values, not optimized ones. TradingView has no options data, so nothing here uses gamma exposure or live option prices: the expected move is an approximation from VIX1D, and fly values assume settlement at the current price. Data for VIX, VIX1D, SPY and the USI symbols may be delayed depending on your subscription. Built for CBOE:SPX and SPCFD during the 09:30–16:00 New York session. State updates on confirmed bars and uses no lookahead. Not financial advice.
Notas de Lançamento
Fly slots now have a trade date. Set "Trade date for the slots" (My Flies settings) to today before entering the day's flies. Slots only draw, alert and show in the table on that date, so yesterday's flies no longer reappear on a new day; past days keep their boxes on their own date. Also: the overnight rows now need at least an hour of overnight bars, so they show n/a on CBOE:SPX instead of a wrong range.Fly name tags now sit just above the center line.
Notas de Lançamento
Small bug fixNotas de Lançamento
bug fixes 
Aviso legal
As informações e publicações não se destinam a ser, e não constituem, conselhos ou recomendações financeiras, de investimento, comerciais ou de outro tipo fornecidos ou endossados pela TradingView. Leia mais nos Termos de Uso.
Aviso legal
As informações e publicações não se destinam a ser, e não constituem, conselhos ou recomendações financeiras, de investimento, comerciais ou de outro tipo fornecidos ou endossados pela TradingView. Leia mais nos Termos de Uso.