OPEN-SOURCE SCRIPT
Sine Wave Cycle Oscillator [HT]
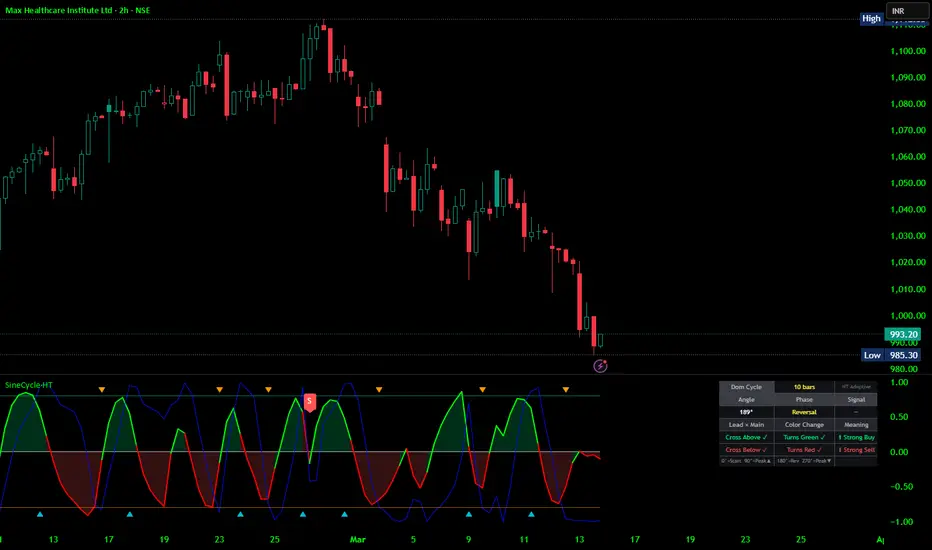
Overview:
This oscillator identifies the dominant market cycle in real time using John Ehlers' Hilbert Transform and Homodyne Discriminator — a signal-processing technique adapted from radio engineering. Rather than using a fixed bar count to simulate a sine wave, the indicator measures the market's own oscillatory rhythm bar-by-bar, producing a phase-accurate sine wave that stays synchronized with actual price cycles as they expand and contract.
How It Works:
Adaptive Cycle Detection (Hilbert Transform)
Price is passed through a multi-stage signal processing pipeline:
4-bar weighted smooth — reduces noise before analysis-
Hilbert detrend — strips the DC trend component, isolating the cyclic portion
In-phase (I1) / Quadrature (Q1) decomposition — constructs a phasor representation of price
90° phase advance — produces jI and jQ for phasor rotation
Phasor addition — yields the corrected I2/Q2 complex pair
Homodyne Discriminator — computes the instantaneous cycle period from the rate of phase change between consecutive bars
Adaptive period — clamped between 6 and 50 bars, double-smoothed for stability
The result is a live dominant cycle period that updates every bar and is displayed in the info table.
Instantaneous Phase Engine
From the I1/Q1 phasor, the indicator derives a continuous phase angle (0°–360°) that tracks where price currently sits within its cycle — no fixed-length assumption, no lag from windowing.
Sine wave — sin(phase), EMA-smoothed for display clarity
Lead sine — cos(phase) = exactly 90° ahead of the main wave, acting as an early-warning signal for turns
Signals:
Strong signals require both conditions to fire simultaneously (table) — the highest-conviction setup. Early warnings give traders advance notice of a potential turn before the zero-line confirms. Weak signals flag zero-line crossings that lack lead-sine confirmation and should be treated with caution.
Visual Elements:
Sine wave — colour-coded green above zero, red below, with a matching fill
Lead sine — plotted in blue, always one quarter-cycle ahead
±0.8 bands — mark the 90° and 270° peak zones where cycle reversals are most likely
Background shading — highlights three key phase zones:
🟢 80°–100° — approaching upside peak
🟡 170°–190° — mid-cycle reversal zone
🔴 260°–280° — approaching downside peak
Label markers — L (Strong Buy) and S (Strong Sell) plotted directly on the oscillator panel; triangles mark early warnings
Info Table (Top-Right)
Field Description Dom Cycle Current adaptive period in bars (Homodyne Discriminator output)
Angle Instantaneous phase angle in degrees
Phase Named cycle stage: Cycle Start / Uptrend Peak / Reversal / Downtrend Peak Signal Current bar's signal classification
Legend rows Cross / color change logic reference and phase reference guide
Settings:
Parameter Default Description Smoothing 3EMA length applied to the raw sine wave before plotting
The cycle period requires no manual input — it is derived entirely from the market via the Hilbert Transform engine.
Notes & Best Practices:
Works on any symbol and timeframe; the adaptive period adjusts automatically
Most reliable on liquid instruments with clear cyclic behavior (indices, major FX pairs, large-cap equities)
Combine Strong signals with trend context from a higher timeframe for best results — this oscillator excels at timing entries within a known trend, not at predicting trend direction itself
The lead sine can precede actual turns by several bars; wait for the zero-line confirmation on lower-conviction setups
Ref:
Based on the work of John F. Ehlers — Cybernetic Analysis for Stocks and Futures (2004)
Disclaimer: This indicator is for educational purposes only. Always practice proper risk management and combine with your own analysis before making trading decisions. Happy trading.
Script de código aberto
Em verdadeiro espírito do TradingView, o criador deste script o tornou de código aberto, para que os traders possam revisar e verificar sua funcionalidade. Parabéns ao autor! Embora você possa usá-lo gratuitamente, lembre-se de que a republicação do código está sujeita às nossas Regras da Casa.

Aviso legal
As informações e publicações não se destinam a ser, e não constituem, conselhos ou recomendações financeiras, de investimento, comerciais ou de outro tipo fornecidos ou endossados pela TradingView. Leia mais nos Termos de Uso.
Script de código aberto
Em verdadeiro espírito do TradingView, o criador deste script o tornou de código aberto, para que os traders possam revisar e verificar sua funcionalidade. Parabéns ao autor! Embora você possa usá-lo gratuitamente, lembre-se de que a republicação do código está sujeita às nossas Regras da Casa.
Aviso legal
As informações e publicações não se destinam a ser, e não constituem, conselhos ou recomendações financeiras, de investimento, comerciais ou de outro tipo fornecidos ou endossados pela TradingView. Leia mais nos Termos de Uso.