Atualizado
Panic Marker: Does Buying Fear Work? Every VIX Spike Scored
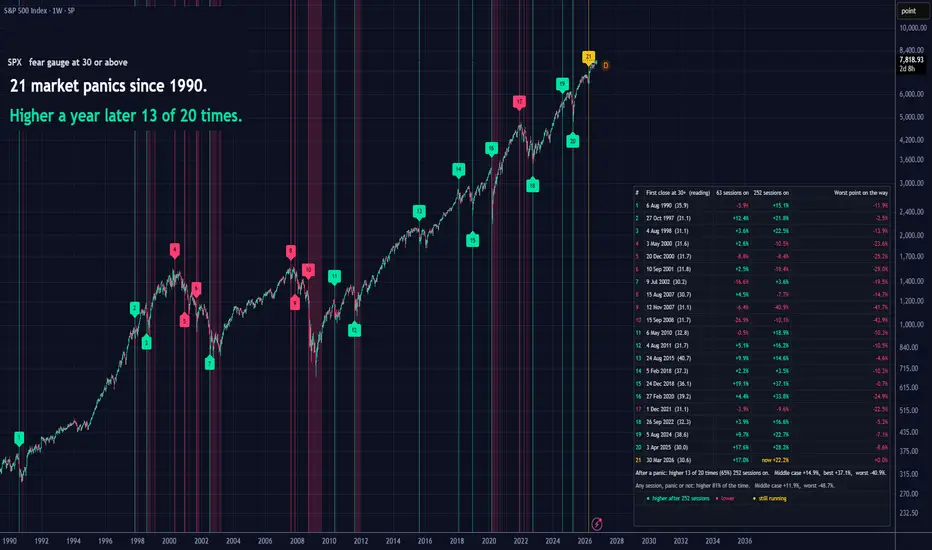
Everyone says "buy when there's blood in the streets". I wanted to know if that actually worked, so I built this to check 📊
😱 What it does
Every time the VIX (the market's fear gauge) closes at 30 or higher after a calm stretch, the script drops a number on your chart. Then it tells you what happened next: where price was about 3 months later, where it was about a year later, and how bad it got along the way.
Nothing is hidden. The panics that kept falling are listed right next to the ones that turned out to be great entries.
👀 How to read it
🟢 Green number: price was higher a year later
🔴 Red number: price was lower a year later
🟡 Yellow number: that one is still playing out
The red bands show how long fear stayed at 30 or above.
The table has every episode with its date, the VIX reading that day and the three results.
⚖️ The part most people skip
Under the table there are two lines. The first is the record after panics. The second is the same test run on every single day, panic or not.
Look at both. Stocks go up most years, so "higher a year later" is true most of the time anyway. The panic record only tells you something when you put it next to the normal one.
🔧 How it counts
One long scare counts once. A new panic needs 60 calm sessions before it.
Results start from the next day's open. The VIX closes after the stock market, so that's the first price you could really have traded.
It counts daily sessions on any timeframe. Put it on a weekly chart to see decades at once and you get the same numbers as on a daily chart.
⚙️ Settings
You can swap the fear gauge, change the level, the calm period and both time horizons, hide the headline, the table or the colour key, and move the table to any corner.
📈 What I found on the S&P 500
Weekly chart, at the time of posting: 21 panics since 1990. Of the 20 that have had a full year, 13 ended higher.
The losers came in clusters. Three panics in 2000 and 2001 and three in 2007 and 2008 were all lower a year later. Buying the first scare of a real bear market hurt.
⚠️ Please keep in mind
This shows what happened. It doesn't know what happens next, and it's not a buy or sell signal.
About twenty episodes is a small sample, so treat the percentages as rough.
Use it on a daily, weekly or monthly chart of something with a long history.
Try it on your own market and see how it compares 🔍
😱 What it does
Every time the VIX (the market's fear gauge) closes at 30 or higher after a calm stretch, the script drops a number on your chart. Then it tells you what happened next: where price was about 3 months later, where it was about a year later, and how bad it got along the way.
Nothing is hidden. The panics that kept falling are listed right next to the ones that turned out to be great entries.
👀 How to read it
🟢 Green number: price was higher a year later
🔴 Red number: price was lower a year later
🟡 Yellow number: that one is still playing out
The red bands show how long fear stayed at 30 or above.
The table has every episode with its date, the VIX reading that day and the three results.
⚖️ The part most people skip
Under the table there are two lines. The first is the record after panics. The second is the same test run on every single day, panic or not.
Look at both. Stocks go up most years, so "higher a year later" is true most of the time anyway. The panic record only tells you something when you put it next to the normal one.
🔧 How it counts
One long scare counts once. A new panic needs 60 calm sessions before it.
Results start from the next day's open. The VIX closes after the stock market, so that's the first price you could really have traded.
It counts daily sessions on any timeframe. Put it on a weekly chart to see decades at once and you get the same numbers as on a daily chart.
⚙️ Settings
You can swap the fear gauge, change the level, the calm period and both time horizons, hide the headline, the table or the colour key, and move the table to any corner.
📈 What I found on the S&P 500
Weekly chart, at the time of posting: 21 panics since 1990. Of the 20 that have had a full year, 13 ended higher.
The losers came in clusters. Three panics in 2000 and 2001 and three in 2007 and 2008 were all lower a year later. Buying the first scare of a real bear market hurt.
⚠️ Please keep in mind
This shows what happened. It doesn't know what happens next, and it's not a buy or sell signal.
About twenty episodes is a small sample, so treat the percentages as rough.
Use it on a daily, weekly or monthly chart of something with a long history.
Try it on your own market and see how it compares 🔍
Notas de Lançamento
🛠 Fixed: the fear gauge and your chart are now matched by trading day, on every market and every timeframe.Before this update, daily charts of markets outside the US (India, Europe, Asia) could miss panics or show none at all, and weekly or monthly charts could date a panic that began on a Friday to the next Monday. Thanks to the comment that spotted it 🙏
📈 The S&P 500 record with the fix: 22 panics since 1990, higher a year later 14 of 21 times. Daily, weekly and monthly charts now give exactly the same table.
Just remove the indicator and add it again to get the new version 🔍

Trade smarter, not louder. Free signals 📈 lessons 🎓 market news 📰 👉 t.me/nambou_signals
Aviso legal
As informações e publicações não se destinam a ser, e não constituem, conselhos ou recomendações financeiras, de investimento, comerciais ou de outro tipo fornecidos ou endossados pela TradingView. Leia mais nos Termos de Uso.
Trade smarter, not louder. Free signals 📈 lessons 🎓 market news 📰 👉 t.me/nambou_signals
Aviso legal
As informações e publicações não se destinam a ser, e não constituem, conselhos ou recomendações financeiras, de investimento, comerciais ou de outro tipo fornecidos ou endossados pela TradingView. Leia mais nos Termos de Uso.