Bitcoin Rainbow Wave (2026 Recalibration)
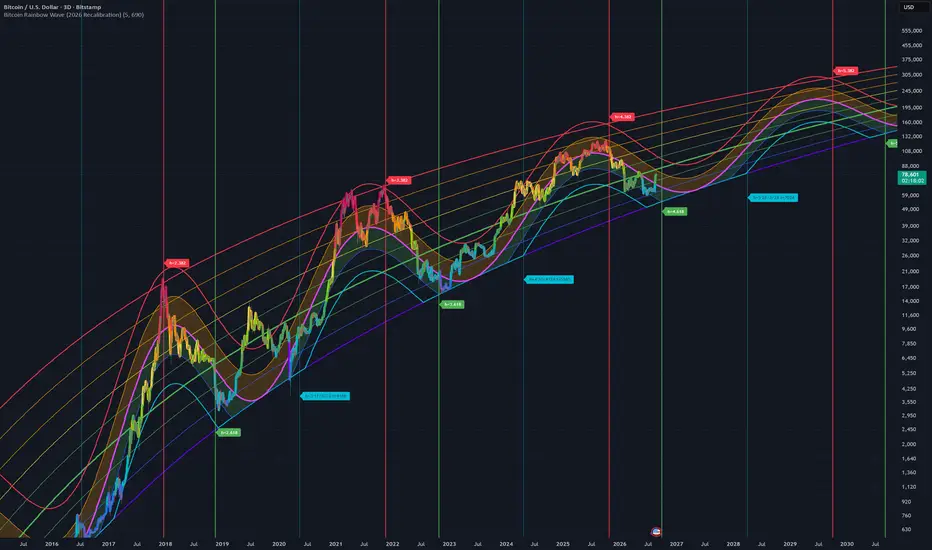
This is a recalibrated version of the open-source Bitcoin Rainbow Wave indicator originally published by leoum. What is original here: after the 2024–2025 cycle topped near $126K, far below the level the original parameters projected, I re-estimated all model parameters against the full history of cycle highs and lows, and added one curvature term to the trend equation. Nothing else in the model logic was changed.
What it does. The indicator draws a long-term envelope around BTC/USD. It converts calendar time into "halving time" h (block height divided by 210,000) using the actual timestamps of past halving and quarter-cycle blocks, so cycles become directly comparable. A trend line is computed as log10(price) = a + b·log10(h) + c·log10(h)², where the added c term (absent in the original, which is recovered by setting c = 0) lets growth per cycle slow smoothly instead of remaining a pure power law. Around this trend, a sine wave oscillates once per halving cycle. Its amplitude shrinks each cycle by a decay factor, and its phase is shifted by a "lag" function that models the market's delayed reaction to early halvings. Five wave lines are drawn at fixed offsets of this oscillation; the outermost upper line is fitted through past cycle all-time highs and the outermost lower line through past bear-market lows. An optional "miners profitability floor" caps how far the lower lines can fall below trend.
How the parameters were chosen. The five parameters were fitted by least squares in log space so that the upper band passes as close as possible to the 2013, 2017, 2021, and 2025 cycle tops and the lower band through the 2015, 2018, and 2022 lows, using one continuous formula over the whole history, with no per-cycle adjustments. Residual errors at each anchor are between roughly 2% and 19%; the largest gap is at the 2025 top, which sits below the fitted upper band.
How to use it. Designed for BTCUSD on the weekly timeframe with a logarithmic price scale. The fuchsia wave is the model's central estimate; the red upper and aqua lower bands mark the zones where previous cycles have topped and bottomed. Vertical lines mark past and estimated future halvings, with additional time markers at 38.2% and 61.8% of each cycle, near which past tops and bottoms respectively have occurred. Settings allow toggling the power-law rainbow bands, the wave bands, background highlighting when price touches the outer bands, and a price line colored by rainbow zone.
Important behavior to understand. The script plots the model's future path by offsetting plots into the future (default 690 bars, configurable), and draws vertical lines and labels at estimated future dates. Future halving dates are estimates extrapolated from the 2021–2025 cycle length and will differ from actual block times.
Limitations. This is a deterministic curve fitted to a small number of historical extremes, not a statistical model: its forward bands are extrapolations, and it will be wrong if market structure changes, as the 2024–2025 cycle demonstrated against the original calibration, which this version had to correct. It is a visualization framework for cycle context, not a trading signal and not financial advice.
What it does. The indicator draws a long-term envelope around BTC/USD. It converts calendar time into "halving time" h (block height divided by 210,000) using the actual timestamps of past halving and quarter-cycle blocks, so cycles become directly comparable. A trend line is computed as log10(price) = a + b·log10(h) + c·log10(h)², where the added c term (absent in the original, which is recovered by setting c = 0) lets growth per cycle slow smoothly instead of remaining a pure power law. Around this trend, a sine wave oscillates once per halving cycle. Its amplitude shrinks each cycle by a decay factor, and its phase is shifted by a "lag" function that models the market's delayed reaction to early halvings. Five wave lines are drawn at fixed offsets of this oscillation; the outermost upper line is fitted through past cycle all-time highs and the outermost lower line through past bear-market lows. An optional "miners profitability floor" caps how far the lower lines can fall below trend.
How the parameters were chosen. The five parameters were fitted by least squares in log space so that the upper band passes as close as possible to the 2013, 2017, 2021, and 2025 cycle tops and the lower band through the 2015, 2018, and 2022 lows, using one continuous formula over the whole history, with no per-cycle adjustments. Residual errors at each anchor are between roughly 2% and 19%; the largest gap is at the 2025 top, which sits below the fitted upper band.
How to use it. Designed for BTCUSD on the weekly timeframe with a logarithmic price scale. The fuchsia wave is the model's central estimate; the red upper and aqua lower bands mark the zones where previous cycles have topped and bottomed. Vertical lines mark past and estimated future halvings, with additional time markers at 38.2% and 61.8% of each cycle, near which past tops and bottoms respectively have occurred. Settings allow toggling the power-law rainbow bands, the wave bands, background highlighting when price touches the outer bands, and a price line colored by rainbow zone.
Important behavior to understand. The script plots the model's future path by offsetting plots into the future (default 690 bars, configurable), and draws vertical lines and labels at estimated future dates. Future halving dates are estimates extrapolated from the 2021–2025 cycle length and will differ from actual block times.
Limitations. This is a deterministic curve fitted to a small number of historical extremes, not a statistical model: its forward bands are extrapolations, and it will be wrong if market structure changes, as the 2024–2025 cycle demonstrated against the original calibration, which this version had to correct. It is a visualization framework for cycle context, not a trading signal and not financial advice.

Aviso legal
As informações e publicações não se destinam a ser, e não constituem, conselhos ou recomendações financeiras, de investimento, comerciais ou de outro tipo fornecidos ou endossados pela TradingView. Leia mais nos Termos de Uso.
Aviso legal
As informações e publicações não se destinam a ser, e não constituem, conselhos ou recomendações financeiras, de investimento, comerciais ou de outro tipo fornecidos ou endossados pela TradingView. Leia mais nos Termos de Uso.