OPEN-SOURCE SCRIPT
Adaptive Swing Matrix | Mourya
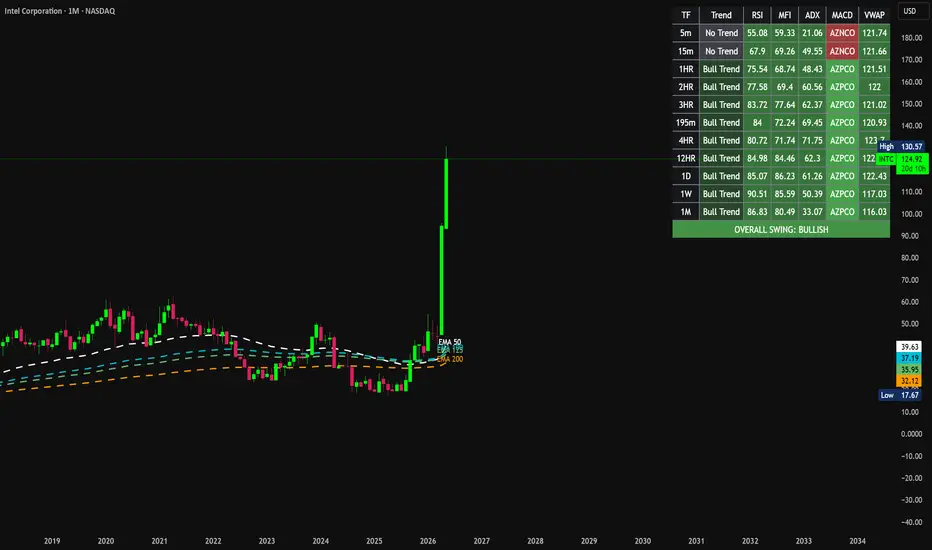
This indicator provides a Multi-Timeframe (MTF) table matrix designed to display the real-time states of several standard momentum and trend indicators across 11 user-defined timeframes simultaneously.
The primary purpose of this script is to consolidate chart real estate. By organizing MTF data into a single table, it allows users to monitor higher-timeframe trends and oscillator states without needing to continuously switch chart intervals or clutter their screen with multiple lower panes.
Indicator Logic & Components:
This matrix tracks the following standard indicators across the user's chosen timeframes:
Trend (EMA Crossover): Evaluates a fast EMA crossing a medium or slow EMA, filtered by a macro 200-period baseline EMA.
RSI (Relative Strength Index): Displays the current RSI value, color-coded based on user-defined breakout/breakdown thresholds.
MFI (Money Flow Index): Displays volume-weighted momentum.
ADX (Average Directional Index): Evaluates trend strength to filter out sideways consolidation periods.
MACD (Moving Average Convergence Divergence): Evaluates the relationship between the MACD line and the Signal line relative to the zero-line. The matrix uses the following acronyms to display the exact MACD state:
AZPCO: Above Zero, Positive Crossover (MACD is > 0 and MACD > Signal)
AZNCO: Above Zero, Negative Crossover (MACD is > 0 and MACD < Signal)
BZPCO: Below Zero, Positive Crossover (MACD is < 0 and MACD > Signal)
BZNCO: Below Zero, Negative Crossover (MACD is < 0 and MACD < Signal)
VWAP (Volume Weighted Average Price): Displays the current VWAP value and highlights if the closing price is currently holding above or below the baseline.
 INTC Matrix Features:
Customizable Timeframes: Users are not restricted to default intervals. You can input custom minute, hour, day, week, or month intervals for all 11 rows via the settings menu.
Overall Consensus Score: The bottom row of the table evaluates a 7-timeframe core grouping. If a strict majority of these selected timeframes share the same trend direction, it outputs a unified directional signal.
Visual Chart Overlays: Users can optionally enable the EMA lines and VWAP bands on their main chart. These visual elements have been strictly segregated in the indicator's Style tab for easy toggling.
All backend settings—including lengths, source data, and trigger thresholds for the RSI, MFI, and ADX—are fully unlocked in the inputs menu for personal customisation.
The primary purpose of this script is to consolidate chart real estate. By organizing MTF data into a single table, it allows users to monitor higher-timeframe trends and oscillator states without needing to continuously switch chart intervals or clutter their screen with multiple lower panes.
Indicator Logic & Components:
This matrix tracks the following standard indicators across the user's chosen timeframes:
Trend (EMA Crossover): Evaluates a fast EMA crossing a medium or slow EMA, filtered by a macro 200-period baseline EMA.
RSI (Relative Strength Index): Displays the current RSI value, color-coded based on user-defined breakout/breakdown thresholds.
MFI (Money Flow Index): Displays volume-weighted momentum.
ADX (Average Directional Index): Evaluates trend strength to filter out sideways consolidation periods.
MACD (Moving Average Convergence Divergence): Evaluates the relationship between the MACD line and the Signal line relative to the zero-line. The matrix uses the following acronyms to display the exact MACD state:
AZPCO: Above Zero, Positive Crossover (MACD is > 0 and MACD > Signal)
AZNCO: Above Zero, Negative Crossover (MACD is > 0 and MACD < Signal)
BZPCO: Below Zero, Positive Crossover (MACD is < 0 and MACD > Signal)
BZNCO: Below Zero, Negative Crossover (MACD is < 0 and MACD < Signal)
VWAP (Volume Weighted Average Price): Displays the current VWAP value and highlights if the closing price is currently holding above or below the baseline.
INTC Matrix Features:Customizable Timeframes: Users are not restricted to default intervals. You can input custom minute, hour, day, week, or month intervals for all 11 rows via the settings menu.
Overall Consensus Score: The bottom row of the table evaluates a 7-timeframe core grouping. If a strict majority of these selected timeframes share the same trend direction, it outputs a unified directional signal.
Visual Chart Overlays: Users can optionally enable the EMA lines and VWAP bands on their main chart. These visual elements have been strictly segregated in the indicator's Style tab for easy toggling.
All backend settings—including lengths, source data, and trigger thresholds for the RSI, MFI, and ADX—are fully unlocked in the inputs menu for personal customisation.
Script de código aberto
Em verdadeiro espírito do TradingView, o criador deste script o tornou de código aberto, para que os traders possam revisar e verificar sua funcionalidade. Parabéns ao autor! Embora você possa usá-lo gratuitamente, lembre-se de que a republicação do código está sujeita às nossas Regras da Casa.

Aviso legal
As informações e publicações não se destinam a ser, e não constituem, conselhos ou recomendações financeiras, de investimento, comerciais ou de outro tipo fornecidos ou endossados pela TradingView. Leia mais nos Termos de Uso.
Script de código aberto
Em verdadeiro espírito do TradingView, o criador deste script o tornou de código aberto, para que os traders possam revisar e verificar sua funcionalidade. Parabéns ao autor! Embora você possa usá-lo gratuitamente, lembre-se de que a republicação do código está sujeita às nossas Regras da Casa.
Aviso legal
As informações e publicações não se destinam a ser, e não constituem, conselhos ou recomendações financeiras, de investimento, comerciais ou de outro tipo fornecidos ou endossados pela TradingView. Leia mais nos Termos de Uso.