Atualizado
Cross-Instrument Cash-Close Ladder Jessnat
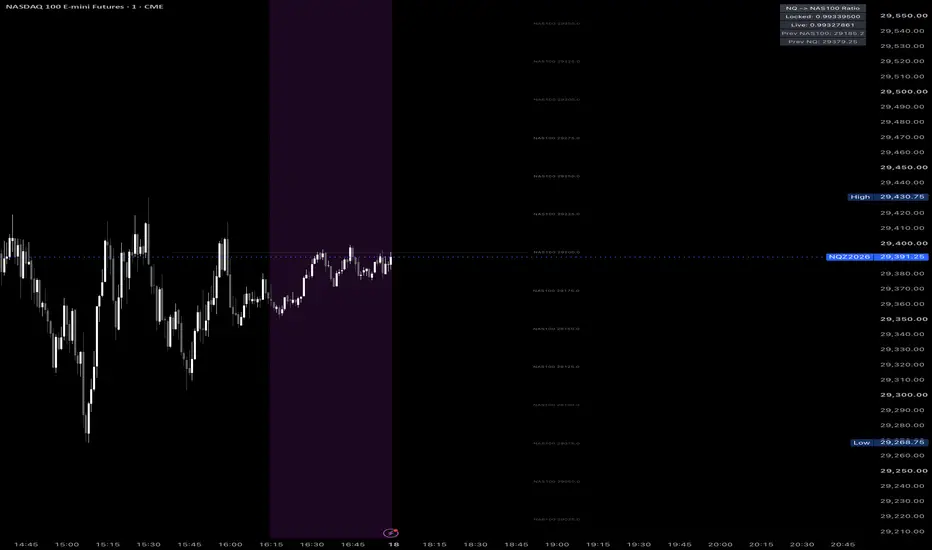
This indicator draws a ladder of round-number price levels from one instrument onto the chart of a related instrument. Each level is placed at its correct equivalent price. For example, it can show NAS100 levels on an NQ1! chart, NQ levels on a NAS100 chart, or SPY levels on an ES1! chart.
How it works
Futures, ETFs and CFD indices track the same market at different prices. The gap comes from basis, dividends, and how each broker prices its feed. The indicator uses the official 4:00 PM New York cash close of both instruments to calculate a conversion ratio. That ratio maps every level from one instrument to the other. The lines sit at the correct place on your chart, and each label shows the price of the other instrument.
Modes
Auto (default): detects the chart and picks the right mode on its own.
– On NQ / MNQ, it shows NAS100 or QQQ levels (your choice).
– On ES / MES, it shows SPY levels.
– On any other chart, such as NAS100 or US100, it shows futures levels (NQ by default).
Index Chart → Show Futures Levels: forces futures levels onto an index or CFD chart.
Futures Chart → Show ETF Levels: forces ETF or NAS100 levels onto a futures chart.
Features
Adjustable number of levels above and below price
Step size in the labeled instrument’s own units (e.g. every 25 NAS100 points)
Separate styling for the center line, near levels and far levels: color, width, opacity and line style
Ratio box showing the locked ratio from the previous cash close, the live ratio, and both previous closes
Custom anchor symbols, so you can match your broker’s feed (OANDA, Capital.com, Pepperstone, etc.)
Settings tips
Set the NAS100 Anchor to the exact symbol your broker uses. Each CFD feed is priced slightly differently.
The locked ratio updates once per day at the cash close. The live ratio shows how far the relationship has drifted during the session.
The previous-close calculation uses 1-minute data, so the anchor symbols must have intraday history available.
Use case
This is useful for traders who analyze one instrument and execute on another. For example, you can follow key NAS100 round numbers while trading NQ futures, or the reverse, without converting prices by hand.
This indicator is a visual tool only and does not give buy or sell signals. It is not financial advice.
How it works
Futures, ETFs and CFD indices track the same market at different prices. The gap comes from basis, dividends, and how each broker prices its feed. The indicator uses the official 4:00 PM New York cash close of both instruments to calculate a conversion ratio. That ratio maps every level from one instrument to the other. The lines sit at the correct place on your chart, and each label shows the price of the other instrument.
Modes
Auto (default): detects the chart and picks the right mode on its own.
– On NQ / MNQ, it shows NAS100 or QQQ levels (your choice).
– On ES / MES, it shows SPY levels.
– On any other chart, such as NAS100 or US100, it shows futures levels (NQ by default).
Index Chart → Show Futures Levels: forces futures levels onto an index or CFD chart.
Futures Chart → Show ETF Levels: forces ETF or NAS100 levels onto a futures chart.
Features
Adjustable number of levels above and below price
Step size in the labeled instrument’s own units (e.g. every 25 NAS100 points)
Separate styling for the center line, near levels and far levels: color, width, opacity and line style
Ratio box showing the locked ratio from the previous cash close, the live ratio, and both previous closes
Custom anchor symbols, so you can match your broker’s feed (OANDA, Capital.com, Pepperstone, etc.)
Settings tips
Set the NAS100 Anchor to the exact symbol your broker uses. Each CFD feed is priced slightly differently.
The locked ratio updates once per day at the cash close. The live ratio shows how far the relationship has drifted during the session.
The previous-close calculation uses 1-minute data, so the anchor symbols must have intraday history available.
Use case
This is useful for traders who analyze one instrument and execute on another. For example, you can follow key NAS100 round numbers while trading NQ futures, or the reverse, without converting prices by hand.
This indicator is a visual tool only and does not give buy or sell signals. It is not financial advice.
Notas de Lançamento
update the chart imageNotas de Lançamento
add auto for level
Aviso legal
As informações e publicações não se destinam a ser, e não constituem, conselhos ou recomendações financeiras, de investimento, comerciais ou de outro tipo fornecidos ou endossados pela TradingView. Leia mais nos Termos de Uso.
Aviso legal
As informações e publicações não se destinam a ser, e não constituem, conselhos ou recomendações financeiras, de investimento, comerciais ou de outro tipo fornecidos ou endossados pela TradingView. Leia mais nos Termos de Uso.