OPEN-SOURCE SCRIPT
ICT Swing Structure [STL/STH/ ITL/ITH /LTL/LTH]
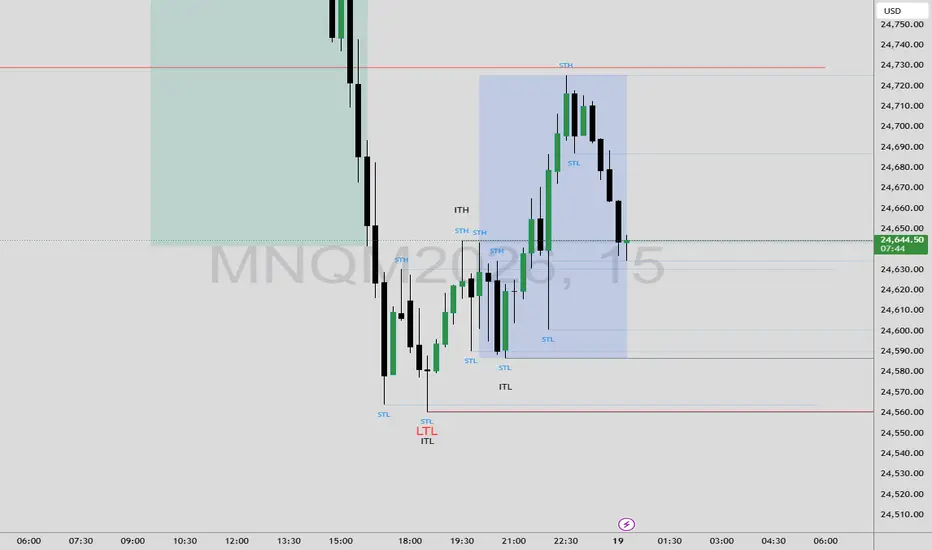
ICT Swing Structure [STL/STH · ITL/ITH · LTL/LTH]
This indicator automatically identifies and labels the three degrees of market structure as taught in the ICT (Inner Circle Trader) 2022 Mentorship — Short-Term, Intermediate-Term, and Long-Term swing highs and lows.
Price swings are classified into a nested hierarchy:
STH / STL — Short-Term Highs and Lows, the most frequent pivots on any timeframe
ITH / ITL — Intermediate-Term Highs and Lows, formed when a short-term swing is confirmed by surrounding short-term pivots on both sides
LTH / LTL — Long-Term Highs and Lows, the most significant turning points requiring intermediate-term confirmation on both sides
Each degree is displayed with a distinct color-coded label and a horizontal reference line extending forward from the swing point. Line lengths are scaled to significance — ST levels extend the shortest distance, LT levels the longest — keeping the chart clean while highlighting what matters most.
Fully customizable with toggles for each degree, adjustable pivot sensitivity, and individual color controls for ST, IT, and LT levels.
Best used as part of a top-down analysis workflow to define HTF bias, identify liquidity pools, and frame precision entries across all asset classes and timeframes.
This indicator automatically identifies and labels the three degrees of market structure as taught in the ICT (Inner Circle Trader) 2022 Mentorship — Short-Term, Intermediate-Term, and Long-Term swing highs and lows.
Price swings are classified into a nested hierarchy:
STH / STL — Short-Term Highs and Lows, the most frequent pivots on any timeframe
ITH / ITL — Intermediate-Term Highs and Lows, formed when a short-term swing is confirmed by surrounding short-term pivots on both sides
LTH / LTL — Long-Term Highs and Lows, the most significant turning points requiring intermediate-term confirmation on both sides
Each degree is displayed with a distinct color-coded label and a horizontal reference line extending forward from the swing point. Line lengths are scaled to significance — ST levels extend the shortest distance, LT levels the longest — keeping the chart clean while highlighting what matters most.
Fully customizable with toggles for each degree, adjustable pivot sensitivity, and individual color controls for ST, IT, and LT levels.
Best used as part of a top-down analysis workflow to define HTF bias, identify liquidity pools, and frame precision entries across all asset classes and timeframes.
Script de código aberto
Em verdadeiro espírito do TradingView, o criador deste script o tornou de código aberto, para que os traders possam revisar e verificar sua funcionalidade. Parabéns ao autor! Embora você possa usá-lo gratuitamente, lembre-se de que a republicação do código está sujeita às nossas Regras da Casa.

Aviso legal
As informações e publicações não se destinam a ser, e não constituem, conselhos ou recomendações financeiras, de investimento, comerciais ou de outro tipo fornecidos ou endossados pela TradingView. Leia mais nos Termos de Uso.
Script de código aberto
Em verdadeiro espírito do TradingView, o criador deste script o tornou de código aberto, para que os traders possam revisar e verificar sua funcionalidade. Parabéns ao autor! Embora você possa usá-lo gratuitamente, lembre-se de que a republicação do código está sujeita às nossas Regras da Casa.
Aviso legal
As informações e publicações não se destinam a ser, e não constituem, conselhos ou recomendações financeiras, de investimento, comerciais ou de outro tipo fornecidos ou endossados pela TradingView. Leia mais nos Termos de Uso.