OPEN-SOURCE SCRIPT
Auto Fib Evo
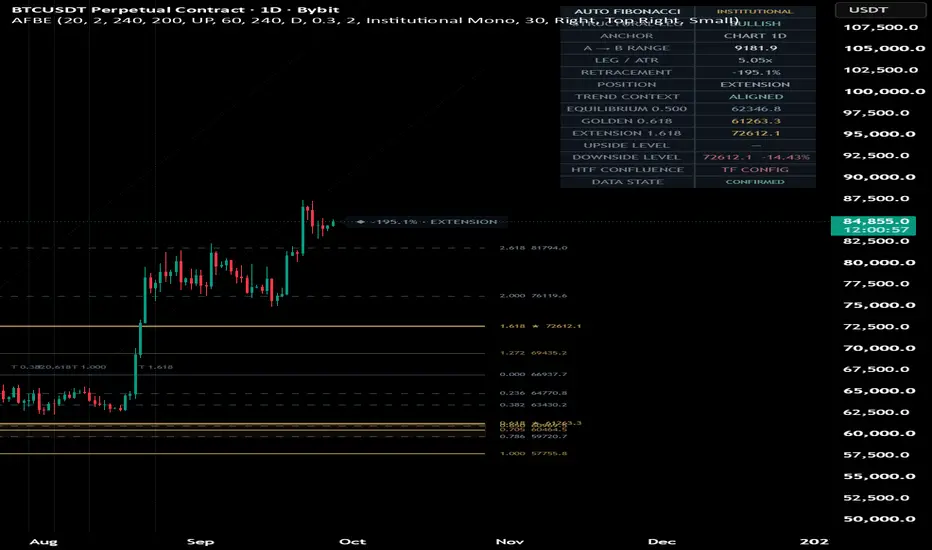
auto fib evo is an automatic fibonacci structure tool designed to detect significant market swings, anchor fibonacci levels to confirmed price structure, map retracement and extension zones, project potential targets, identify multi-timeframe confluence, and provide a live reading of where price is positioned inside the current structural leg.
instead of requiring manual fibonacci placement, the indicator builds its framework from confirmed swing pivots and filters weak legs using atr. the active a → b structure can be calculated directly from the chart timeframe or from a confirmed higher-timeframe anchor.
### swing engine
the swing engine determines which price leg is used as the foundation for the fibonacci structure.
**pivot length**
controls how many bars on each side are required to confirm a swing pivot.
a higher value focuses on larger and more established market swings. a lower value reacts faster and captures smaller structures.
because pivots require confirmation, a swing becomes available only after the required number of bars has formed.
**min leg size**
filters structural legs according to atr.
the distance between a and b must be large enough relative to atr at the confirmed b pivot. this helps prevent very small price fluctuations from becoming the active fibonacci structure.
for example, a setting of 2.0 requires the detected leg to measure at least two times the relevant atr.
**use htf anchor**
switches the main fibonacci structure from the chart timeframe to a higher timeframe.
when enabled, the complete swing calculation is performed using confirmed higher-timeframe data.
the selected anchor timeframe must be higher than the current chart timeframe.
**htf timeframe**
selects the higher timeframe used by the main structural engine.
this can be useful when trading on a lower timeframe while keeping the fibonacci framework anchored to a larger market structure.
**trend ema**
sets the ema used to evaluate whether the active structural direction agrees with the broader price trend.
**auto direction**
automatically follows the latest valid bullish or bearish structural leg.
**manual direction**
when auto direction is disabled, the engine can be restricted to either up or down structures.
this allows the user to focus only on bullish retracement structures or only on bearish ones.
### fibonacci retracement grid
the retracement grid automatically calculates fibonacci levels between the confirmed a and b anchors.
available levels include:
0.000
0.236
0.382
0.500
0.618
0.650
0.705
0.786
0.886
1.000
each level can be enabled or disabled individually.
**0.500**
represents the equilibrium area of the structural leg.
**0.618**
highlights the classic golden fibonacci retracement.
**0.650 and 0.705**
provide additional levels around the deeper retracement area and can be used together with the ote framework.
**0.786 and 0.886**
provide deeper retracement references closer to a full return toward the original structural anchor.
the indicator automatically adapts these levels to bullish and bearish legs.
### golden pocket
the golden pocket highlights the area between the 0.618 and 0.650 retracement levels.
when enabled, this zone is displayed directly on the active structure.
it provides a fast visual reference for one of the most closely watched fibonacci retracement areas without requiring the trader to calculate or draw it manually.
### ote zone
the ote zone covers the broader 0.620 to 0.790 retracement region.
this creates a larger structural retracement area around several important fibonacci levels.
the golden pocket and ote can be displayed together, allowing the narrower golden area to remain visible inside the broader deep-retracement zone.
### fibonacci extensions
auto fib evo can automatically project fibonacci levels beyond the confirmed a → b leg.
available extensions include:
1.272
1.414
1.618
2.000
2.618
each extension can be activated independently.
**1.272**
provides an initial extension reference beyond the completed structural leg.
**1.618**
is highlighted as the primary golden extension.
**2.000 and 2.618**
provide progressively more distant structural projection levels.
extensions can be used as reference areas when price moves beyond the original a → b structure.
### a-b-c measured projection
the indicator includes a separate measured-move projection engine.
after a valid a → b leg has been established, the script waits for a confirmed c retracement pivot.
from c, it projects the magnitude of the original a → b move.
two projection targets are displayed:
**abc 1.000**
projects 100% of the original a → b magnitude from c.
**abc 1.618**
projects 161.8% of the original a → b magnitude from c.
this provides a second projection framework that is structurally different from standard fibonacci extensions.
### time fibonacci
auto fib evo also applies fibonacci ratios to time.
the duration between the confirmed a and b pivots becomes the reference time span.
available time ratios are:
0.382
0.618
1.000
1.618
vertical fibonacci time markers are projected forward from b.
these levels do not predict a specific price. they provide time references based on the duration of the detected structural move.
this can help compare future market activity with the temporal proportions of the original leg.
### multi-timeframe confluence engine
the confluence engine compares fibonacci structures from three configurable higher timeframes.
**confluence tf 1**
sets the first timeframe.
**confluence tf 2**
sets the second timeframe.
**confluence tf 3**
sets the third timeframe.
only genuine higher timeframes participate in the calculation. duplicate timeframe selections are excluded so the same market context cannot be counted more than once.
the confluence engine compares several important fibonacci levels from each valid timeframe, including retracements and extensions.
when levels from different timeframes are sufficiently close to each other, they can form a confluence cluster.
**cluster tolerance %**
controls the maximum price distance allowed between levels for them to belong to the same cluster.
a smaller tolerance requires tighter agreement between levels.
a larger tolerance allows wider clusters.
**minimum distinct tfs**
controls how many different timeframes must contribute before a cluster is considered valid.
this can be set to two or three.
the system also weights valid timeframes according to their actual timeframe magnitude.
confluence quality is classified as:
none
valid
moderate
strong
very strong
the strongest detected cluster is also tracked by the dashboard.
### live retracement position
the indicator continuously measures the current price relative to the active a → b structure.
the live readout displays the current retracement percentage and automatically classifies price into structural zones.
possible states include:
extension
shallow retrace
mid retrace
equilibrium
golden pocket
ote
deep retrace
full retrace
this makes it possible to understand the current fibonacci position without manually comparing price against every individual line.
### trend context
the active structural direction is compared with the selected trend ema.
when the detected fibonacci leg and ema context point in the same direction, the dashboard reports the structure as aligned.
when they disagree, it reports a divergent trend context.
this provides an additional layer of information when evaluating the active fibonacci structure.
### parallel fib channel
the parallel fib channel extends the geometry of the detected a → b leg.
instead of displaying only horizontal fibonacci prices, it creates parallel projected boundaries based on the slope and magnitude of the active structural move.
this can help visualize the directional geometry surrounding the current fibonacci framework.
### visual options
three themes are available:
**obsidian gold**
**neon wizard**
**institutional mono**
**extend right**
controls how far the active fibonacci levels and related visual elements extend beyond the current bar.
**label position**
labels can be displayed on the right, left, or both sides of the structure.
**live retracement readout**
enables the live percentage and structural-zone label next to current price.
**parallel fib channel**
enables or disables the projected channel around the structural leg.
### dashboard
the dashboard summarizes the current fibonacci structure in a compact format.
it includes information about the active structural leg, anchor source, a → b range, leg size relative to atr, current retracement, structural position, trend context, equilibrium level, golden 0.618 level, 1.618 extension and nearby structural levels.
the dashboard also incorporates the multi-timeframe confluence state when enough valid higher-timeframe structures are available.
its position can be moved between the four chart corners and the text can be displayed in tiny, small, or normal size.
### quick start
add auto fib evo to the chart and begin with the default settings.
first, allow the swing engine to detect a confirmed a → b leg.
**a** represents the beginning of the detected structural move.
**b** represents the confirmed endpoint of that move.
once the structure is available, the fibonacci retracement grid is automatically positioned between these anchors.
watch the live retracement readout to see where current price is located inside the structure.
a reading around 50% places price near equilibrium.
a retracement around 61.8% to 65% places price inside the golden pocket.
a deeper retracement between approximately 62% and 79% falls inside the broader ote area.
if price expands beyond the original structural move, use the 1.272, 1.618, 2.000 and 2.618 extensions as projected structural references.
when a confirmed c pivot becomes available, the abc projection adds separate 1.000 and 1.618 measured-move targets.
enable the multi-timeframe confluence overlay to identify areas where fibonacci levels from different higher-timeframe structures cluster near the same price.
the time fibonacci verticals can then be used as an additional time-based reference alongside the price-based fibonacci framework.
### using the htf anchor
for a cleaner higher-timeframe structure while trading a lower chart timeframe, enable **use htf anchor**.
select a timeframe higher than the chart timeframe.
for example, a trader working on a lower intraday chart can anchor the main fibonacci structure to a larger intraday or higher-timeframe swing.
the main grid will then follow the accepted confirmed structure from that higher timeframe rather than rebuilding its primary anchors from smaller chart-timeframe swings.
for native chart-timeframe structures, leave htf anchor disabled.
### adjusting sensitivity
if the indicator detects too many small structures, increase **pivot length** or **min leg size**.
this forces the engine to focus on more significant confirmed swings.
if the structure reacts too slowly, reduce the pivot length while keeping enough filtering to avoid insignificant market noise.
increasing **min leg size** is particularly useful when the objective is to reject small swings during low-volatility or noisy conditions.
for multi-timeframe confluence, reduce **cluster tolerance %** when tighter price agreement is required.
increase **minimum distinct tfs** to require confirmation from more independent timeframe structures.
### how auto fib evo can help
auto fib evo is designed to remove much of the manual work involved in maintaining fibonacci structures while keeping the levels connected to confirmed market swings.
it can help with:
automatically identifying significant bullish and bearish structural legs
filtering small swings with atr-based validation
automatically placing fibonacci retracement levels
tracking the current retracement percentage in real time
identifying equilibrium, golden pocket, ote and deep retracement areas
projecting standard fibonacci extensions
creating a-b-c measured-move targets
mapping fibonacci relationships in time
comparing fibonacci structures across multiple higher timeframes
locating price areas where independent timeframe levels converge
keeping lower-timeframe analysis anchored to confirmed higher-timeframe structure
checking whether the active structural leg agrees with the ema trend context
visualizing the geometry of the move with a parallel fibonacci channel
reducing repeated manual fibonacci drawing as market structure evolves
the indicator is best used as a structural mapping tool. fibonacci levels represent reference areas derived from confirmed price swings, not guaranteed reversal or target prices. confluence, trend context, current price behavior, volatility and risk management should be considered together when evaluating a setup.
instead of requiring manual fibonacci placement, the indicator builds its framework from confirmed swing pivots and filters weak legs using atr. the active a → b structure can be calculated directly from the chart timeframe or from a confirmed higher-timeframe anchor.
### swing engine
the swing engine determines which price leg is used as the foundation for the fibonacci structure.
**pivot length**
controls how many bars on each side are required to confirm a swing pivot.
a higher value focuses on larger and more established market swings. a lower value reacts faster and captures smaller structures.
because pivots require confirmation, a swing becomes available only after the required number of bars has formed.
**min leg size**
filters structural legs according to atr.
the distance between a and b must be large enough relative to atr at the confirmed b pivot. this helps prevent very small price fluctuations from becoming the active fibonacci structure.
for example, a setting of 2.0 requires the detected leg to measure at least two times the relevant atr.
**use htf anchor**
switches the main fibonacci structure from the chart timeframe to a higher timeframe.
when enabled, the complete swing calculation is performed using confirmed higher-timeframe data.
the selected anchor timeframe must be higher than the current chart timeframe.
**htf timeframe**
selects the higher timeframe used by the main structural engine.
this can be useful when trading on a lower timeframe while keeping the fibonacci framework anchored to a larger market structure.
**trend ema**
sets the ema used to evaluate whether the active structural direction agrees with the broader price trend.
**auto direction**
automatically follows the latest valid bullish or bearish structural leg.
**manual direction**
when auto direction is disabled, the engine can be restricted to either up or down structures.
this allows the user to focus only on bullish retracement structures or only on bearish ones.
### fibonacci retracement grid
the retracement grid automatically calculates fibonacci levels between the confirmed a and b anchors.
available levels include:
0.000
0.236
0.382
0.500
0.618
0.650
0.705
0.786
0.886
1.000
each level can be enabled or disabled individually.
**0.500**
represents the equilibrium area of the structural leg.
**0.618**
highlights the classic golden fibonacci retracement.
**0.650 and 0.705**
provide additional levels around the deeper retracement area and can be used together with the ote framework.
**0.786 and 0.886**
provide deeper retracement references closer to a full return toward the original structural anchor.
the indicator automatically adapts these levels to bullish and bearish legs.
### golden pocket
the golden pocket highlights the area between the 0.618 and 0.650 retracement levels.
when enabled, this zone is displayed directly on the active structure.
it provides a fast visual reference for one of the most closely watched fibonacci retracement areas without requiring the trader to calculate or draw it manually.
### ote zone
the ote zone covers the broader 0.620 to 0.790 retracement region.
this creates a larger structural retracement area around several important fibonacci levels.
the golden pocket and ote can be displayed together, allowing the narrower golden area to remain visible inside the broader deep-retracement zone.
### fibonacci extensions
auto fib evo can automatically project fibonacci levels beyond the confirmed a → b leg.
available extensions include:
1.272
1.414
1.618
2.000
2.618
each extension can be activated independently.
**1.272**
provides an initial extension reference beyond the completed structural leg.
**1.618**
is highlighted as the primary golden extension.
**2.000 and 2.618**
provide progressively more distant structural projection levels.
extensions can be used as reference areas when price moves beyond the original a → b structure.
### a-b-c measured projection
the indicator includes a separate measured-move projection engine.
after a valid a → b leg has been established, the script waits for a confirmed c retracement pivot.
from c, it projects the magnitude of the original a → b move.
two projection targets are displayed:
**abc 1.000**
projects 100% of the original a → b magnitude from c.
**abc 1.618**
projects 161.8% of the original a → b magnitude from c.
this provides a second projection framework that is structurally different from standard fibonacci extensions.
### time fibonacci
auto fib evo also applies fibonacci ratios to time.
the duration between the confirmed a and b pivots becomes the reference time span.
available time ratios are:
0.382
0.618
1.000
1.618
vertical fibonacci time markers are projected forward from b.
these levels do not predict a specific price. they provide time references based on the duration of the detected structural move.
this can help compare future market activity with the temporal proportions of the original leg.
### multi-timeframe confluence engine
the confluence engine compares fibonacci structures from three configurable higher timeframes.
**confluence tf 1**
sets the first timeframe.
**confluence tf 2**
sets the second timeframe.
**confluence tf 3**
sets the third timeframe.
only genuine higher timeframes participate in the calculation. duplicate timeframe selections are excluded so the same market context cannot be counted more than once.
the confluence engine compares several important fibonacci levels from each valid timeframe, including retracements and extensions.
when levels from different timeframes are sufficiently close to each other, they can form a confluence cluster.
**cluster tolerance %**
controls the maximum price distance allowed between levels for them to belong to the same cluster.
a smaller tolerance requires tighter agreement between levels.
a larger tolerance allows wider clusters.
**minimum distinct tfs**
controls how many different timeframes must contribute before a cluster is considered valid.
this can be set to two or three.
the system also weights valid timeframes according to their actual timeframe magnitude.
confluence quality is classified as:
none
valid
moderate
strong
very strong
the strongest detected cluster is also tracked by the dashboard.
### live retracement position
the indicator continuously measures the current price relative to the active a → b structure.
the live readout displays the current retracement percentage and automatically classifies price into structural zones.
possible states include:
extension
shallow retrace
mid retrace
equilibrium
golden pocket
ote
deep retrace
full retrace
this makes it possible to understand the current fibonacci position without manually comparing price against every individual line.
### trend context
the active structural direction is compared with the selected trend ema.
when the detected fibonacci leg and ema context point in the same direction, the dashboard reports the structure as aligned.
when they disagree, it reports a divergent trend context.
this provides an additional layer of information when evaluating the active fibonacci structure.
### parallel fib channel
the parallel fib channel extends the geometry of the detected a → b leg.
instead of displaying only horizontal fibonacci prices, it creates parallel projected boundaries based on the slope and magnitude of the active structural move.
this can help visualize the directional geometry surrounding the current fibonacci framework.
### visual options
three themes are available:
**obsidian gold**
**neon wizard**
**institutional mono**
**extend right**
controls how far the active fibonacci levels and related visual elements extend beyond the current bar.
**label position**
labels can be displayed on the right, left, or both sides of the structure.
**live retracement readout**
enables the live percentage and structural-zone label next to current price.
**parallel fib channel**
enables or disables the projected channel around the structural leg.
### dashboard
the dashboard summarizes the current fibonacci structure in a compact format.
it includes information about the active structural leg, anchor source, a → b range, leg size relative to atr, current retracement, structural position, trend context, equilibrium level, golden 0.618 level, 1.618 extension and nearby structural levels.
the dashboard also incorporates the multi-timeframe confluence state when enough valid higher-timeframe structures are available.
its position can be moved between the four chart corners and the text can be displayed in tiny, small, or normal size.
### quick start
add auto fib evo to the chart and begin with the default settings.
first, allow the swing engine to detect a confirmed a → b leg.
**a** represents the beginning of the detected structural move.
**b** represents the confirmed endpoint of that move.
once the structure is available, the fibonacci retracement grid is automatically positioned between these anchors.
watch the live retracement readout to see where current price is located inside the structure.
a reading around 50% places price near equilibrium.
a retracement around 61.8% to 65% places price inside the golden pocket.
a deeper retracement between approximately 62% and 79% falls inside the broader ote area.
if price expands beyond the original structural move, use the 1.272, 1.618, 2.000 and 2.618 extensions as projected structural references.
when a confirmed c pivot becomes available, the abc projection adds separate 1.000 and 1.618 measured-move targets.
enable the multi-timeframe confluence overlay to identify areas where fibonacci levels from different higher-timeframe structures cluster near the same price.
the time fibonacci verticals can then be used as an additional time-based reference alongside the price-based fibonacci framework.
### using the htf anchor
for a cleaner higher-timeframe structure while trading a lower chart timeframe, enable **use htf anchor**.
select a timeframe higher than the chart timeframe.
for example, a trader working on a lower intraday chart can anchor the main fibonacci structure to a larger intraday or higher-timeframe swing.
the main grid will then follow the accepted confirmed structure from that higher timeframe rather than rebuilding its primary anchors from smaller chart-timeframe swings.
for native chart-timeframe structures, leave htf anchor disabled.
### adjusting sensitivity
if the indicator detects too many small structures, increase **pivot length** or **min leg size**.
this forces the engine to focus on more significant confirmed swings.
if the structure reacts too slowly, reduce the pivot length while keeping enough filtering to avoid insignificant market noise.
increasing **min leg size** is particularly useful when the objective is to reject small swings during low-volatility or noisy conditions.
for multi-timeframe confluence, reduce **cluster tolerance %** when tighter price agreement is required.
increase **minimum distinct tfs** to require confirmation from more independent timeframe structures.
### how auto fib evo can help
auto fib evo is designed to remove much of the manual work involved in maintaining fibonacci structures while keeping the levels connected to confirmed market swings.
it can help with:
automatically identifying significant bullish and bearish structural legs
filtering small swings with atr-based validation
automatically placing fibonacci retracement levels
tracking the current retracement percentage in real time
identifying equilibrium, golden pocket, ote and deep retracement areas
projecting standard fibonacci extensions
creating a-b-c measured-move targets
mapping fibonacci relationships in time
comparing fibonacci structures across multiple higher timeframes
locating price areas where independent timeframe levels converge
keeping lower-timeframe analysis anchored to confirmed higher-timeframe structure
checking whether the active structural leg agrees with the ema trend context
visualizing the geometry of the move with a parallel fibonacci channel
reducing repeated manual fibonacci drawing as market structure evolves
the indicator is best used as a structural mapping tool. fibonacci levels represent reference areas derived from confirmed price swings, not guaranteed reversal or target prices. confluence, trend context, current price behavior, volatility and risk management should be considered together when evaluating a setup.
Script de código aberto
Em verdadeiro espírito do TradingView, o criador deste script o tornou de código aberto, para que os traders possam revisar e verificar sua funcionalidade. Parabéns ao autor! Embora você possa usá-lo gratuitamente, lembre-se de que a republicação do código está sujeita às nossas Regras da Casa.

Light the candle that sleeps within you.
Aviso legal
As informações e publicações não se destinam a ser, e não constituem, conselhos ou recomendações financeiras, de investimento, comerciais ou de outro tipo fornecidos ou endossados pela TradingView. Leia mais nos Termos de Uso.
Script de código aberto
Em verdadeiro espírito do TradingView, o criador deste script o tornou de código aberto, para que os traders possam revisar e verificar sua funcionalidade. Parabéns ao autor! Embora você possa usá-lo gratuitamente, lembre-se de que a republicação do código está sujeita às nossas Regras da Casa.
Light the candle that sleeps within you.
Aviso legal
As informações e publicações não se destinam a ser, e não constituem, conselhos ou recomendações financeiras, de investimento, comerciais ou de outro tipo fornecidos ou endossados pela TradingView. Leia mais nos Termos de Uso.