OPEN-SOURCE SCRIPT
Atualizado Candle Emotion Oscillator [CEO]
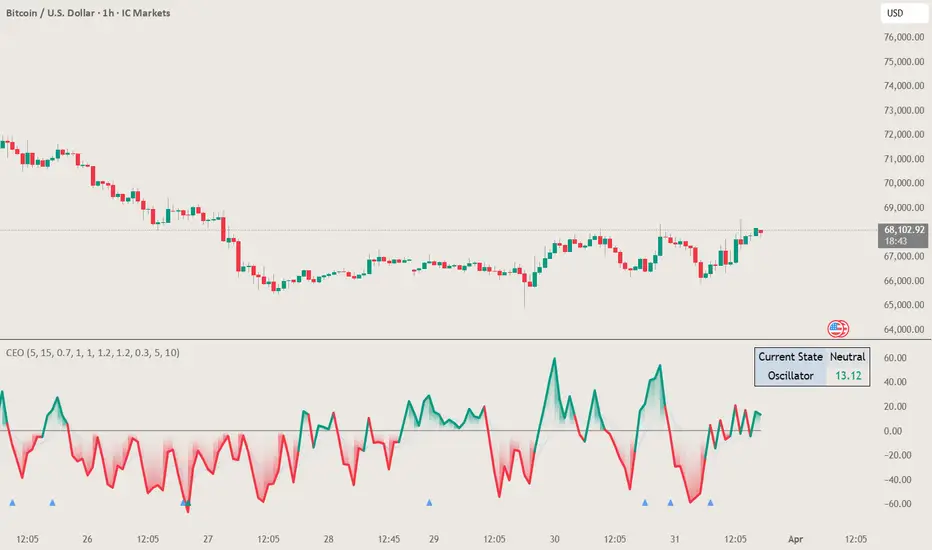
Candle Emotion Oscillator (CEO) - Revolutionary User Guide
🧠 World's First Market Psychology Oscillator
The Candle Emotion Oscillator (CEO) is a groundbreaking indicator that measures market emotions through pure candle price action analysis. This is the first oscillator ever created that translates candle patterns into psychological states, giving you unprecedented insight into market sentiment.
🚀 Revolutionary Concept
What Makes CEO Unique
The Four Core Emotions
🟢 GREED (Positive Values)
What it measures: Market conviction and decisiveness
🔴 FEAR (Negative Values)
What it measures: Market uncertainty and indecision
🚀 EUPHORIA (Extreme Positive)
What it measures: Excessive optimism and buying pressure
Trading Implication: Overbought, reversal warning
💥 PANIC (Extreme Negative)
What it measures: Capitulation and selling pressure
Oscillator: Values below -60
Trading Implication: Oversold, reversal opportunity
📊 Visual Elements Explained
Main Components
Thin Blue Line: Emotion trend (longer-term context)
Background Gradient: Emotional intensity
Darker = stronger emotions
Lighter = weaker emotions
Diamond Signals: 🔶 Emotional exhaustion detected
Rocket Signals: 🚀 Extreme euphoria warning
Explosion Signals: 💥 Extreme panic warning
Information Table (Top Right)
🧠 World's First Market Psychology Oscillator
The Candle Emotion Oscillator (CEO) is a groundbreaking indicator that measures market emotions through pure candle price action analysis. This is the first oscillator ever created that translates candle patterns into psychological states, giving you unprecedented insight into market sentiment.
🚀 Revolutionary Concept
What Makes CEO Unique
- 100% Pure Price Action: No volume, no external data - just candle analysis
- Market Psychology: Measures actual emotions: Fear, Greed, Panic, Euphoria
- Never Been Done Before: First oscillator to analyze market emotions
- Exhaustion Prediction: Detects emotional fatigue before reversals
- Fast Response: Perfect for your 2-5 minute scalping setup
The Four Core Emotions
🟢 GREED (Positive Values)
What it measures: Market conviction and decisiveness
- Candle Pattern: Large bodies, small wicks
- Psychology: Traders are confident and decisive
- Oscillator: Positive values (0 to +100)
- Trading Implication: Trend continuation likely
🔴 FEAR (Negative Values)
What it measures: Market uncertainty and indecision
- Candle Pattern: Small bodies, large wicks
- Psychology: Traders are uncertain and hesitant
- Oscillator: Negative values (0 to -100)
- Trading Implication: Consolidation or reversal likely
🚀 EUPHORIA (Extreme Positive)
What it measures: Excessive optimism and buying pressure
- Candle Pattern: Large green bodies with upper wicks
- Psychology: Extreme bullish sentiment
- Oscillator: Values above +60
Trading Implication: Overbought, reversal warning
💥 PANIC (Extreme Negative)
What it measures: Capitulation and selling pressure
- Candle Pattern: Large red bodies with lower wicks
- Psychology: Extreme bearish sentiment
Oscillator: Values below -60
Trading Implication: Oversold, reversal opportunity
📊 Visual Elements Explained
Main Components
- Thick Colored Line: Primary emotion oscillator
- Green: Greed (positive emotions)
- Red: Fear (negative emotions)
- Bright Green: Euphoria (extreme positive)
- Dark Red: Panic (extreme negative)
Thin Blue Line: Emotion trend (longer-term context)
Background Gradient: Emotional intensity
Darker = stronger emotions
Lighter = weaker emotions
Diamond Signals: 🔶 Emotional exhaustion detected
Rocket Signals: 🚀 Extreme euphoria warning
Explosion Signals: 💥 Extreme panic warning
Information Table (Top Right)
Notas de Lançamento
**Key Enhancements Made:****Main Oscillator Styling:**
Replaced the previous column-based plot with a thick, bold line (`linewidth=3`) that dynamically changes color based on the market's emotional state — green for bullish emotion and red for bearish emotion.
**Vertical Gradient Fill:**
Added a smooth vertical gradient that flows from the equilibrium (zero) line to the oscillator value. It uses a fading transparency effect to create a clean "glow" appearance.
**Ribbon Background:**
Integrated five faint background EMAs of the oscillator to create a subtle "ribbon" effect. This provides better context for trend momentum and depth without adding clutter.
**Status Information:**
Added a real-time status table in the top-right corner that displays the current dominant emotion (e.g., Euphoria, Greed, Panic, Fear) along with the exact oscillator value.
**Refined Signals:**
Updated the exhaustion and extreme emotion signals to be more subtle and less obtrusive, keeping the overall chart clean and professional.
Key Enhancements Made:
Main Oscillator Styling:
Replaced the previous column-based plot with a thick, bold line (linewidth=3) that dynamically changes color based on the market's emotional state — green for bullish emotion and red for bearish emotion.
Vertical Gradient Fill:
Added a smooth vertical gradient that flows from the equilibrium (zero) line to the oscillator value. It uses a fading transparency effect to create a clean "glow" appearance.
Ribbon Background:
Integrated five faint background EMAs of the oscillator to create a subtle "ribbon" effect. This provides better context for trend momentum and depth without adding clutter.
Status Information:
Added a real-time status table in the top-right corner that displays the current dominant emotion (e.g., Euphoria, Greed, Panic, Fear) along with the exact oscillator value.
Refined Signals:
Updated the exhaustion and extreme emotion signals to be more subtle and less obtrusive, keeping the overall chart clean and professional.
Notas de Lançamento
updated nameScript de código aberto
Em verdadeiro espírito do TradingView, o criador deste script o tornou de código aberto, para que os traders possam revisar e verificar sua funcionalidade. Parabéns ao autor! Embora você possa usá-lo gratuitamente, lembre-se de que a republicação do código está sujeita às nossas Regras da Casa.

Aviso legal
As informações e publicações não se destinam a ser, e não constituem, conselhos ou recomendações financeiras, de investimento, comerciais ou de outro tipo fornecidos ou endossados pela TradingView. Leia mais nos Termos de Uso.
Script de código aberto
Em verdadeiro espírito do TradingView, o criador deste script o tornou de código aberto, para que os traders possam revisar e verificar sua funcionalidade. Parabéns ao autor! Embora você possa usá-lo gratuitamente, lembre-se de que a republicação do código está sujeita às nossas Regras da Casa.
Aviso legal
As informações e publicações não se destinam a ser, e não constituem, conselhos ou recomendações financeiras, de investimento, comerciais ou de outro tipo fornecidos ou endossados pela TradingView. Leia mais nos Termos de Uso.