RSI + Bollinger Bands
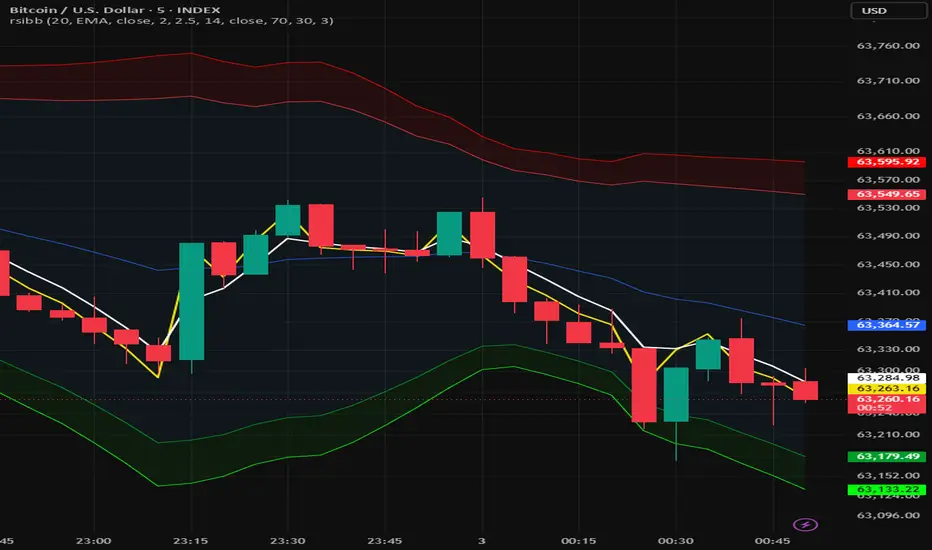
RSI + Bollinger Bands — RSIBB
RSIBB combines the Relative Strength Index with Bollinger Bands by projecting RSI momentum directly into price space. Instead of displaying RSI in a separate oscillator pane, this indicator places the RSI Flow alongside price and the Bollinger Band structure, allowing momentum, volatility, and price action to be evaluated together on a single chart.
How It Works
The RSI Flow is centered around the Bollinger Band basis:
RSI 50 aligns with the Bollinger Band basis.
The upper RSI threshold, set to 70 by default, aligns with the primary Upper Band.
The lower RSI threshold, set to 30 by default, aligns with the primary Lower Band.
RSI values beyond the selected thresholds extend into the outer momentum and volatility zones.
The yellow RSI Flow line represents projected RSI momentum. The white RSI Flow-Base line applies EMA smoothing to the projected RSI Flow, making momentum shifts and potential crosses easier to identify.
Bollinger Band Settings
The Bollinger Band system includes adjustable:
Length
Source
Basis moving-average type
Standard-deviation multiplier
Extended-band multiplier
Extended-band visibility
Supported basis moving averages include:
SMA
EMA
SMMA/RMA
WMA
VWMA
The optional Extended Bands highlight areas where momentum and price have moved beyond the primary Bollinger Band range.
RSI Settings
The RSI system includes adjustable:
RSI length
RSI source
Upper RSI threshold
Lower RSI threshold
EMA smoothing length
The default thresholds are 70 and 30, but they can be changed to make the projection more or less sensitive.
Interpretation
When the RSI Flow moves above the basis, momentum is positioned on the bullish side of its range. When it moves below the basis, momentum is positioned on the bearish side.
Movement near or beyond the primary bands indicates that RSI has reached or exceeded its selected upper or lower threshold. The extended zones can help identify stronger momentum expansion, volatility extremes, and possible exhaustion areas.
Crosses between the RSI Flow and its smoothed Flow-Base may help visualize changes in momentum direction. These signals should be evaluated alongside market structure, trend, volatility, and other forms of confirmation.
RSIBB does not provide automatic trade entries or guarantee reversals at the bands. It is designed as a visual analysis tool that places RSI momentum and Bollinger Band behavior into one unified price-chart display.
This indicator is intended for informational and educational purposes only and does not constitute financial advice.
RSIBB combines the Relative Strength Index with Bollinger Bands by projecting RSI momentum directly into price space. Instead of displaying RSI in a separate oscillator pane, this indicator places the RSI Flow alongside price and the Bollinger Band structure, allowing momentum, volatility, and price action to be evaluated together on a single chart.
How It Works
The RSI Flow is centered around the Bollinger Band basis:
RSI 50 aligns with the Bollinger Band basis.
The upper RSI threshold, set to 70 by default, aligns with the primary Upper Band.
The lower RSI threshold, set to 30 by default, aligns with the primary Lower Band.
RSI values beyond the selected thresholds extend into the outer momentum and volatility zones.
The yellow RSI Flow line represents projected RSI momentum. The white RSI Flow-Base line applies EMA smoothing to the projected RSI Flow, making momentum shifts and potential crosses easier to identify.
Bollinger Band Settings
The Bollinger Band system includes adjustable:
Length
Source
Basis moving-average type
Standard-deviation multiplier
Extended-band multiplier
Extended-band visibility
Supported basis moving averages include:
SMA
EMA
SMMA/RMA
WMA
VWMA
The optional Extended Bands highlight areas where momentum and price have moved beyond the primary Bollinger Band range.
RSI Settings
The RSI system includes adjustable:
RSI length
RSI source
Upper RSI threshold
Lower RSI threshold
EMA smoothing length
The default thresholds are 70 and 30, but they can be changed to make the projection more or less sensitive.
Interpretation
When the RSI Flow moves above the basis, momentum is positioned on the bullish side of its range. When it moves below the basis, momentum is positioned on the bearish side.
Movement near or beyond the primary bands indicates that RSI has reached or exceeded its selected upper or lower threshold. The extended zones can help identify stronger momentum expansion, volatility extremes, and possible exhaustion areas.
Crosses between the RSI Flow and its smoothed Flow-Base may help visualize changes in momentum direction. These signals should be evaluated alongside market structure, trend, volatility, and other forms of confirmation.
RSIBB does not provide automatic trade entries or guarantee reversals at the bands. It is designed as a visual analysis tool that places RSI momentum and Bollinger Band behavior into one unified price-chart display.
This indicator is intended for informational and educational purposes only and does not constitute financial advice.

Aviso legal
As informações e publicações não se destinam a ser, e não constituem, conselhos ou recomendações financeiras, de investimento, comerciais ou de outro tipo fornecidos ou endossados pela TradingView. Leia mais nos Termos de Uso.
Aviso legal
As informações e publicações não se destinam a ser, e não constituem, conselhos ou recomendações financeiras, de investimento, comerciais ou de outro tipo fornecidos ou endossados pela TradingView. Leia mais nos Termos de Uso.