Liquidity Master [SimpleAlgo]
🧱 INTRODUCING LIQUIDITY MASTER
Every trader talks about liquidity and almost nobody can see it. The order book is on the exchange, it is different on every venue, and the part that matters, the stops, never shows in a book at all. But resting orders sit where traders put them, and traders put them in the same places every time: just past a swing high, just under a swing low, and at the prices where a push got rejected and left a wick behind.
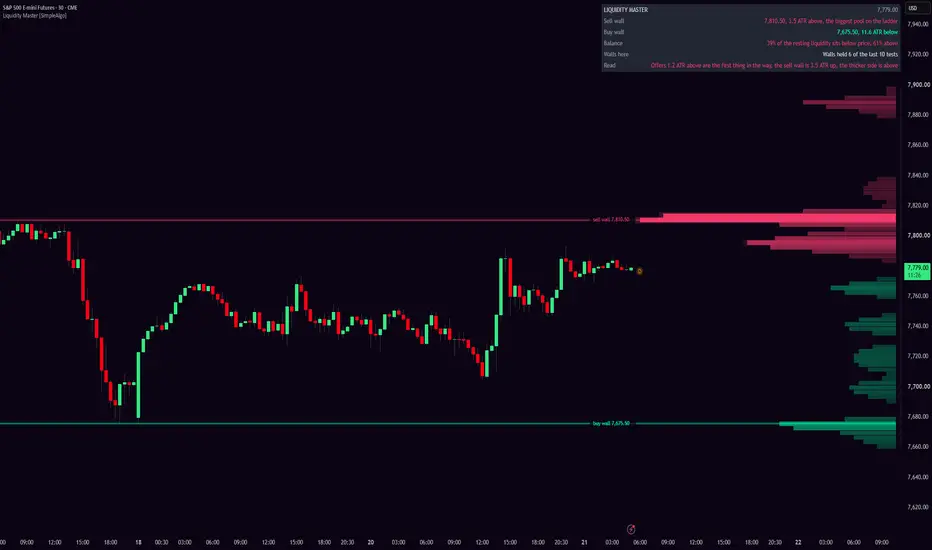
Liquidity Master reads those places off the chart and draws them as a depth ladder beside price. Every swing leaves a pool of stops past it, every rejection wick leaves the orders that absorbed it, and each pool is kept until price trades through it and spends it, or until it ages out because orders get pulled. What is left is stacked into rows: bids below in mint, offers above in pink, the longer the row the more is resting there. The biggest wall on each side is named and tracked, and the panel keeps the score of what happened on this chart the last ten times price reached a wall.

🪜 The ladder
The ladder is the whole picture, so nothing else is drawn across the candles. It covers the price range of the last 300 bars, in 80 rows, and sits over the most recent candles by default, the way a volume profile does. Set it to the right of price for the look in the screenshots. The two walls get a dotted line back across the chart and a name, the panel does the words, and four alerts cover the events.
💡 What's different
A volume profile shows where volume already traded. This shows where orders are likely still waiting. The two look alike on the right edge of a chart and answer opposite questions: one is history, the other is what is in the way.
⚙️ HOW IT WORKS
📌 1. Where the orders rest
Two kinds of pool. The first is the stops past a swing. When a swing high confirms, a pool of buy stops is added in the three quarters of an ATR above it, and the same below a swing low. If price has already run through part of that zone by the time the swing confirms, the pool starts out partly spent:
Pine Script®
The second is a rejection wick. A wick at least 0.45 ATR long means orders sat there and absorbed the push, so the wick itself becomes a pool, weighted by the bar's volume against its average:
Pine Script®
Every pool knows which side of price it works on, its zone, its weight, the bar it was created, and how far price has eaten into it since.
🧹 2. Spent when price trades through
This is the rule that makes it a map of resting orders rather than a map of where price has been. Every bar, each pool above price is eaten into as far as that bar's high reached, and each pool below as far as its low reached. Once price has traded through the whole zone the pool is gone:
Pine Script®
So the stops above a high stay on the ladder until the high is taken, and only the part price has not reached is still drawn. A level price has visited twice is not liquidity any more, and the ladder does not pretend it is.
⏳ 3. Ageing out
Orders get pulled. Each pool loses half its weight every 300 bars, and after four half-lives it is dropped:
Pine Script®
📊 4. The ladder
The ladder spans the range of the last 300 bars plus a margin, so it covers what is on screen:
Pine Script®
Rows sit on a fixed price grid rather than being measured from the current close, so they do not slide with every tick. Each pool's remaining zone is spread across the rows it overlaps, in proportion to the overlap:
Pine Script®
The rows are then smoothed once with their neighbours and scaled so the biggest row is the full width. The ladder is relative: it tells you where the liquidity is thickest and thinnest, never how many contracts are there, because nothing on a chart can know that.
🚧 5. The walls
The biggest row at least 0.3 ATR above price is the sell wall, the biggest row at least 0.3 ATR below is the buy wall:
Pine Script®
The nearest real pool on each side is found at the same time, because the wall is not always the first thing in the way. The panel says both: "Offers 1.0 ATR above are the first thing in the way, the sell wall is 1.3 ATR up".
🧪 6. The record
A wall is only worth drawing if walls on this chart do something. So every ten bars the two walls are noted, and when price reaches one, a test starts:
Pine Script®
The verdict is symmetric. A close half an ATR through the wall and it broke; a close half an ATR back from it and it held:
Pine Script®
The last ten verdicts are kept and the panel reads "Walls held 7 of the last 10 tests". Because the rule is symmetric, a market that ignores these walls scores about five of ten. Anything well above that is the chart telling you its walls get respected; anything well below is a chart where the walls get run.
🪟 7. The panel

🎨 Repainting
The ladder is drawn on the last bar only, from pools that were created on closed bars, so there is no history to repaint. A swing adds its pool when it confirms, a few bars after the extreme, and from then on the pool only shrinks. On the live bar the ladder reshapes as price moves, because price moving is what spends pools, and the walls and the Read follow it. The record only changes on closes.
✨ WHY IT IS ORIGINAL
Swing highs, swing lows and long wicks are the oldest things on a chart, and we have not changed what they are. What is new is treating them as orders and keeping the books. A pool is created where traders actually leave orders, it is spent exactly as far as price has traded into it, it ages out, and the remainder is stacked into a ladder that reads like a depth chart and is honest about being an estimate. Then the walls are tested and scored by a rule that cannot flatter a chart. A volume profile, a liquidity heatmap built from exchange data, and a script that marks equal highs each exist on their own. A resting-order ladder built from the chart alone, spent by price, with named walls and a measured record of whether walls hold here, is what none of them give you.
🧭 HOW TO USE IT
👀 Read the ladder first
Thick rows are where price should slow down, thin stretches are where it should move fast. A ladder that is thick below and thin above is a market with a floor and no ceiling in reach; the Balance line says it in numbers. A ladder that is thin on both sides is a market with nothing in the way, which is its own kind of information.
🚦 Then the walls
The sell wall is the first place a rally should get tested, the buy wall the first place a drop should. Both are named with their distance in ATRs, so "0.4 ATR above" is now and "7.3 ATR above" is background. When a smaller pool sits between price and the wall the Read names it, because that pool is what price meets first.
📒 Then the record
If walls held 8 of the last 10 tests here, fading the walls has been the right side lately. If they held 3 of 10, this is a chart that runs its stops, and a wall is a target rather than a barrier. Take the number at face value and let it argue with your habit.
⏱️ Timeframes
Everything is measured in ATRs and bars, so the same settings give a sensible ladder on a 5-minute chart and a daily. On the 5-minute, pools are spent within hours and the record fills in days. On the daily, a pool can sit for months and ten tests can be years, so read the count. Different timeframes show different ladders on the same symbol at the same moment, because a swing on the 5-minute is a wick on the hourly.

🖥️ The right margin
By default the ladder sits over the last 30 candles. If you prefer it in the empty space to the right, set "Ladder sits" to "Right of price" and give the chart about 35 bars of right margin: drag the price scale to the left, or raise the right margin in the chart settings.
🌱 If you're new
Three sentences. The mint rows are where buy orders are probably waiting, the pink rows are where sell orders are, and the longest row on each side is the wall. The dotted lines show you where the walls are on the chart, and the panel tells you which one is closer and how often walls on this chart have held.
None of this is the exchange's order book, and none of it predicts where price goes. It is an estimate of where orders tend to rest, built from the chart, and a record of what happened when price got there. Use it with your own analysis and manage your risk.
🛠️ SETTINGS
💧 Liquidity
🖌️ Ladder
The rules behind the pools and the record are fixed:
Pine Script®
Pine Script®
Those numbers are right or wrong rather than a matter of taste, and the record only means something if the rule behind it never moves.
🔔 ALERTS
Set them to "Once per bar close".
📝 NOTES AND LIMITS
⚠️ DISCLAIMER
This script is for education and information. It isn't financial advice, a recommendation to buy or sell anything, or a promise about what any market will do. Past behaviour of a market, a method or an indicator doesn't guarantee future results, and nothing on this chart replaces your own judgement. Trading involves risk and you are responsible for your decisions.
Every trader talks about liquidity and almost nobody can see it. The order book is on the exchange, it is different on every venue, and the part that matters, the stops, never shows in a book at all. But resting orders sit where traders put them, and traders put them in the same places every time: just past a swing high, just under a swing low, and at the prices where a push got rejected and left a wick behind.
Liquidity Master reads those places off the chart and draws them as a depth ladder beside price. Every swing leaves a pool of stops past it, every rejection wick leaves the orders that absorbed it, and each pool is kept until price trades through it and spends it, or until it ages out because orders get pulled. What is left is stacked into rows: bids below in mint, offers above in pink, the longer the row the more is resting there. The biggest wall on each side is named and tracked, and the panel keeps the score of what happened on this chart the last ten times price reached a wall.
🪜 The ladder
The ladder is the whole picture, so nothing else is drawn across the candles. It covers the price range of the last 300 bars, in 80 rows, and sits over the most recent candles by default, the way a volume profile does. Set it to the right of price for the look in the screenshots. The two walls get a dotted line back across the chart and a name, the panel does the words, and four alerts cover the events.
💡 What's different
A volume profile shows where volume already traded. This shows where orders are likely still waiting. The two look alike on the right edge of a chart and answer opposite questions: one is history, the other is what is in the way.
⚙️ HOW IT WORKS
📌 1. Where the orders rest
Two kinds of pool. The first is the stops past a swing. When a swing high confirms, a pool of buy stops is added in the three quarters of an ATR above it, and the same below a swing low. If price has already run through part of that zone by the time the swing confirms, the pool starts out partly spent:
The second is a rejection wick. A wick at least 0.45 ATR long means orders sat there and absorbed the push, so the wick itself becomes a pool, weighted by the bar's volume against its average:
Every pool knows which side of price it works on, its zone, its weight, the bar it was created, and how far price has eaten into it since.
🧹 2. Spent when price trades through
This is the rule that makes it a map of resting orders rather than a map of where price has been. Every bar, each pool above price is eaten into as far as that bar's high reached, and each pool below as far as its low reached. Once price has traded through the whole zone the pool is gone:
So the stops above a high stay on the ladder until the high is taken, and only the part price has not reached is still drawn. A level price has visited twice is not liquidity any more, and the ladder does not pretend it is.
⏳ 3. Ageing out
Orders get pulled. Each pool loses half its weight every 300 bars, and after four half-lives it is dropped:
📊 4. The ladder
The ladder spans the range of the last 300 bars plus a margin, so it covers what is on screen:
Rows sit on a fixed price grid rather than being measured from the current close, so they do not slide with every tick. Each pool's remaining zone is spread across the rows it overlaps, in proportion to the overlap:
The rows are then smoothed once with their neighbours and scaled so the biggest row is the full width. The ladder is relative: it tells you where the liquidity is thickest and thinnest, never how many contracts are there, because nothing on a chart can know that.
🚧 5. The walls
The biggest row at least 0.3 ATR above price is the sell wall, the biggest row at least 0.3 ATR below is the buy wall:
The nearest real pool on each side is found at the same time, because the wall is not always the first thing in the way. The panel says both: "Offers 1.0 ATR above are the first thing in the way, the sell wall is 1.3 ATR up".
🧪 6. The record
A wall is only worth drawing if walls on this chart do something. So every ten bars the two walls are noted, and when price reaches one, a test starts:
The verdict is symmetric. A close half an ATR through the wall and it broke; a close half an ATR back from it and it held:
The last ten verdicts are kept and the panel reads "Walls held 7 of the last 10 tests". Because the rule is symmetric, a market that ignores these walls scores about five of ten. Anything well above that is the chart telling you its walls get respected; anything well below is a chart where the walls get run.
🪟 7. The panel
- Sell wall: price and distance in ATRs, and whether it is the biggest pool on the ladder.
- Buy wall: the same below.
- Balance: how much of the resting liquidity sits below price against above.
- Walls here: the record, out of the last ten tests.
- Read: one line. "Sell wall 0.4 ATR above is the first thing in the way", "Bids 0.3 ATR below are the first thing in the way, the buy wall is 1.2 ATR down, the thicker side is below", "Testing the buy wall now, a close 0.5 ATR through it breaks it".
🎨 Repainting
The ladder is drawn on the last bar only, from pools that were created on closed bars, so there is no history to repaint. A swing adds its pool when it confirms, a few bars after the extreme, and from then on the pool only shrinks. On the live bar the ladder reshapes as price moves, because price moving is what spends pools, and the walls and the Read follow it. The record only changes on closes.
✨ WHY IT IS ORIGINAL
Swing highs, swing lows and long wicks are the oldest things on a chart, and we have not changed what they are. What is new is treating them as orders and keeping the books. A pool is created where traders actually leave orders, it is spent exactly as far as price has traded into it, it ages out, and the remainder is stacked into a ladder that reads like a depth chart and is honest about being an estimate. Then the walls are tested and scored by a rule that cannot flatter a chart. A volume profile, a liquidity heatmap built from exchange data, and a script that marks equal highs each exist on their own. A resting-order ladder built from the chart alone, spent by price, with named walls and a measured record of whether walls hold here, is what none of them give you.
🧭 HOW TO USE IT
👀 Read the ladder first
Thick rows are where price should slow down, thin stretches are where it should move fast. A ladder that is thick below and thin above is a market with a floor and no ceiling in reach; the Balance line says it in numbers. A ladder that is thin on both sides is a market with nothing in the way, which is its own kind of information.
🚦 Then the walls
The sell wall is the first place a rally should get tested, the buy wall the first place a drop should. Both are named with their distance in ATRs, so "0.4 ATR above" is now and "7.3 ATR above" is background. When a smaller pool sits between price and the wall the Read names it, because that pool is what price meets first.
📒 Then the record
If walls held 8 of the last 10 tests here, fading the walls has been the right side lately. If they held 3 of 10, this is a chart that runs its stops, and a wall is a target rather than a barrier. Take the number at face value and let it argue with your habit.
⏱️ Timeframes
Everything is measured in ATRs and bars, so the same settings give a sensible ladder on a 5-minute chart and a daily. On the 5-minute, pools are spent within hours and the record fills in days. On the daily, a pool can sit for months and ten tests can be years, so read the count. Different timeframes show different ladders on the same symbol at the same moment, because a swing on the 5-minute is a wick on the hourly.
🖥️ The right margin
By default the ladder sits over the last 30 candles. If you prefer it in the empty space to the right, set "Ladder sits" to "Right of price" and give the chart about 35 bars of right margin: drag the price scale to the left, or raise the right margin in the chart settings.
🌱 If you're new
Three sentences. The mint rows are where buy orders are probably waiting, the pink rows are where sell orders are, and the longest row on each side is the wall. The dotted lines show you where the walls are on the chart, and the panel tells you which one is closer and how often walls on this chart have held.
None of this is the exchange's order book, and none of it predicts where price goes. It is an estimate of where orders tend to rest, built from the chart, and a record of what happened when price got there. Use it with your own analysis and manage your risk.
🛠️ SETTINGS
💧 Liquidity
- Swing strength (bars): 4 by default. A swing high needs this many lower highs on each side, a swing low this many higher lows. Lower it for more pools, raise it for only the big ones.
- Wick rejection (ATR): 0.45 by default. A wick at least this long becomes a pool.
- Liquidity ages out over (bars): 300 by default. Half of a pool is gone after this many bars.
- Bars to compute: 1500 by default. The engine runs on the most recent bars only, to keep the chart fast.
🖌️ Ladder
- Ladder sits: over the last bars, or right of price.
- Ladder width (bars): 30 by default.
- Ladder covers (bars): 300 by default. Match it to how many bars you keep on screen.
- Rows: 80 by default.
- Colours: Mint and Pink, Ice, or Custom with your own bid and offer colours.
- Brightness: 1 to 5, for your screen and background.
- Wall lines, Wall names, Price tag: on by default.
- Panel: position and size.
The rules behind the pools and the record are fixed:
Those numbers are right or wrong rather than a matter of taste, and the record only means something if the rule behind it never moves.
🔔 ALERTS
- Sell wall reached: price reached the sell wall, a test started.
- Buy wall reached: the same below.
- Wall held: a close half an ATR back from the wall.
- Wall broke: a close half an ATR through it.
Set them to "Once per bar close".
📝 NOTES AND LIMITS
- This is an estimate built from the chart, not order book data. It does not see any exchange's book and it cannot know how many orders are at a price. It knows where orders tend to rest and whether price has been there since.
- The ladder is relative. The longest row is always full width, so a thin market and a thick market can look the same on their own ladder. Compare rows to each other, not across symbols.
- The ladder only covers the range of the last 300 bars plus a margin. A pool above or below that, from an older swing, is still counted but not drawn and cannot be the wall. Raise "Ladder covers" to reach further.
- The stop zone past a swing is three quarters of an ATR by assumption. Stops cluster there on most charts; on a chart where they sit further out, the pool is in roughly the right place rather than exactly.
- Wick pools are weighted by volume where the symbol has it. Without volume every wick weighs the same.
- The record tests only the two biggest walls, ten at a time, and a test that gets no verdict within 60 bars is dropped. Ten tests on a daily chart is a long time. Read the count.
- A sell wall at 10 ATR is real but not relevant today. Read the distance next to the price.
- In "Right of price" mode the ladder needs right margin; without it you see only the base of each row. Use "Over the last bars" or widen the margin.
- On the live bar the walls and the Read can change as price moves, because price moving is what spends pools. Nothing about closed bars changes.
⚠️ DISCLAIMER
This script is for education and information. It isn't financial advice, a recommendation to buy or sell anything, or a promise about what any market will do. Past behaviour of a market, a method or an indicator doesn't guarantee future results, and nothing on this chart replaces your own judgement. Trading involves risk and you are responsible for your decisions.

Access our exclusive invite-only scripts: simplealgo.io
Join our discord: discord.gg/simplealgo
Join our discord: discord.gg/simplealgo
Aviso legal
As informações e publicações não se destinam a ser, e não constituem, conselhos ou recomendações financeiras, de investimento, comerciais ou de outro tipo fornecidos ou endossados pela TradingView. Leia mais nos Termos de Uso.
Access our exclusive invite-only scripts: simplealgo.io
Join our discord: discord.gg/simplealgo
Join our discord: discord.gg/simplealgo
Aviso legal
As informações e publicações não se destinam a ser, e não constituem, conselhos ou recomendações financeiras, de investimento, comerciais ou de outro tipo fornecidos ou endossados pela TradingView. Leia mais nos Termos de Uso.