ES Clean Major Market Structure - HH HL LH LL
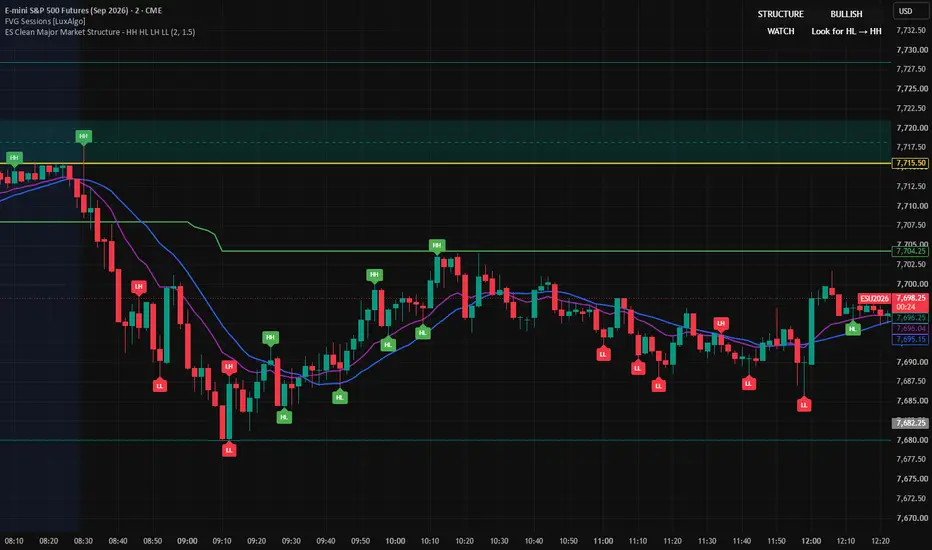
ES Clean Major Market Structure – HH HL LH LL
This indicator is designed to provide a clean visual representation of market structure by identifying meaningful swing highs and swing lows while filtering out smaller price movements.
The script classifies confirmed swing points as:
HH – Higher High: A swing high above the previous swing high.
HL – Higher Low: A swing low above the previous swing low.
LH – Lower High: A swing high below the previous swing high.
LL – Lower Low: A swing low below the previous swing low.
The goal is to make it easier to identify developing bullish and bearish market structure without filling the chart with signals from every small price fluctuation.
Market Structure
The indicator maintains a directional structure bias:
Bullish Structure
Higher Highs (HH)
Higher Lows (HL)
Dashboard displays: BULLISH
Watch for continued HL → HH development
Bearish Structure
Lower Lows (LL)
Lower Highs (LH)
Dashboard displays: BEARISH
Watch for continued LH → LL development
The structure dashboard is intended as a quick visual reference and should not be interpreted as an automatic trade signal.
Swing Strength
Swing Strength determines how many bars on each side of a potential swing are required before that swing can be confirmed.
For example, with Swing Strength set to 2, a pivot requires two bars on the left and two bars on the right.
Because right-side bars are required, HH/HL/LH/LL labels are confirmed after the actual pivot occurs and are plotted back on the pivot bar. They should not be interpreted as signals that were available at the exact moment of the labeled candle.
Minimum Swing Move
Minimum Swing Move filters smaller changes between swing points.
Increasing this value produces fewer, more significant structure labels. Decreasing it makes the indicator more sensitive to smaller price movements.
For ES, the default settings are:
Swing Strength: 2
Minimum Swing Move: 1.50 points
These settings can be adjusted depending on timeframe and trading style.
Additional Chart References
The indicator also displays:
EMA 14 – Short-term price momentum reference
SMA 20 – Trend reference
Session Open – Daily/session opening level
50% Session Midpoint – Midpoint between the developing session high and session low
Intended Use
This indicator is designed primarily as a market-structure visualization tool, not an automated entry system.
One possible way to interpret the structure is:
Bullish: HH → HL → HH
Bearish: LL → LH → LL
Traders may use the structure labels together with their own price-action, support/resistance, liquidity, risk-management, and higher-timeframe analysis.
The indicator can be used on different intraday timeframes. Lower timeframes generally produce more structure changes, while higher timeframes naturally filter more market noise.
Disclaimer: This script is provided for educational and informational purposes only. It does not provide financial advice or guarantee future market performance. Users are responsible for their own trading decisions and risk management.
This indicator is designed to provide a clean visual representation of market structure by identifying meaningful swing highs and swing lows while filtering out smaller price movements.
The script classifies confirmed swing points as:
HH – Higher High: A swing high above the previous swing high.
HL – Higher Low: A swing low above the previous swing low.
LH – Lower High: A swing high below the previous swing high.
LL – Lower Low: A swing low below the previous swing low.
The goal is to make it easier to identify developing bullish and bearish market structure without filling the chart with signals from every small price fluctuation.
Market Structure
The indicator maintains a directional structure bias:
Bullish Structure
Higher Highs (HH)
Higher Lows (HL)
Dashboard displays: BULLISH
Watch for continued HL → HH development
Bearish Structure
Lower Lows (LL)
Lower Highs (LH)
Dashboard displays: BEARISH
Watch for continued LH → LL development
The structure dashboard is intended as a quick visual reference and should not be interpreted as an automatic trade signal.
Swing Strength
Swing Strength determines how many bars on each side of a potential swing are required before that swing can be confirmed.
For example, with Swing Strength set to 2, a pivot requires two bars on the left and two bars on the right.
Because right-side bars are required, HH/HL/LH/LL labels are confirmed after the actual pivot occurs and are plotted back on the pivot bar. They should not be interpreted as signals that were available at the exact moment of the labeled candle.
Minimum Swing Move
Minimum Swing Move filters smaller changes between swing points.
Increasing this value produces fewer, more significant structure labels. Decreasing it makes the indicator more sensitive to smaller price movements.
For ES, the default settings are:
Swing Strength: 2
Minimum Swing Move: 1.50 points
These settings can be adjusted depending on timeframe and trading style.
Additional Chart References
The indicator also displays:
EMA 14 – Short-term price momentum reference
SMA 20 – Trend reference
Session Open – Daily/session opening level
50% Session Midpoint – Midpoint between the developing session high and session low
Intended Use
This indicator is designed primarily as a market-structure visualization tool, not an automated entry system.
One possible way to interpret the structure is:
Bullish: HH → HL → HH
Bearish: LL → LH → LL
Traders may use the structure labels together with their own price-action, support/resistance, liquidity, risk-management, and higher-timeframe analysis.
The indicator can be used on different intraday timeframes. Lower timeframes generally produce more structure changes, while higher timeframes naturally filter more market noise.
Disclaimer: This script is provided for educational and informational purposes only. It does not provide financial advice or guarantee future market performance. Users are responsible for their own trading decisions and risk management.

Aviso legal
As informações e publicações não se destinam a ser, e não constituem, conselhos ou recomendações financeiras, de investimento, comerciais ou de outro tipo fornecidos ou endossados pela TradingView. Leia mais nos Termos de Uso.
Aviso legal
As informações e publicações não se destinam a ser, e não constituem, conselhos ou recomendações financeiras, de investimento, comerciais ou de outro tipo fornecidos ou endossados pela TradingView. Leia mais nos Termos de Uso.