Strong EMA Dev + 13/48 Cross Signals (Long & Short)
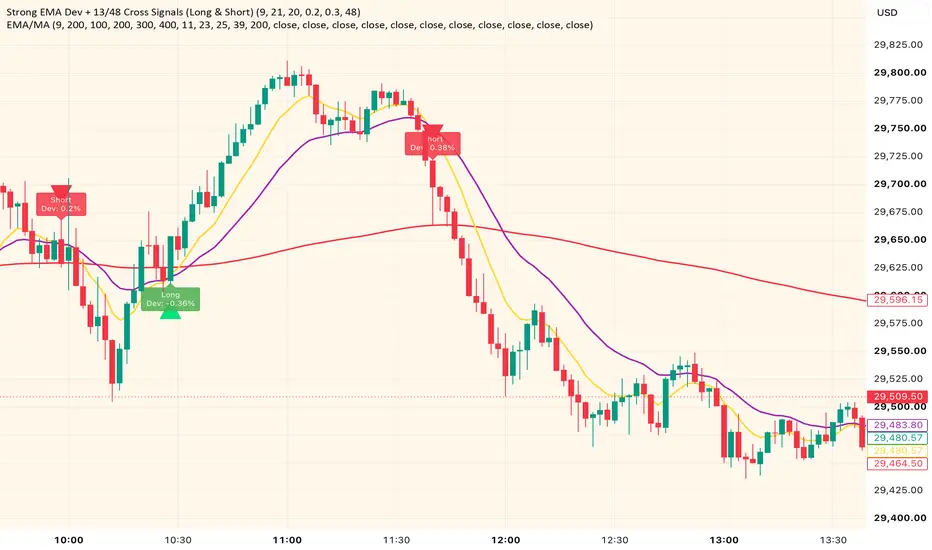
Strong EMA Deviation + 13/48 Cross Signals — Indicator Description
This indicator combines EMA trend structure, mean‑deviation analysis, and momentum‑based crossovers to identify high‑probability turning points in the market. It is designed for traders who want to detect moments when price becomes stretched far from its mean and then confirms direction through a fast/slow EMA cross.
Core Logic
The script calculates three EMAs:
Fast EMA (13) — captures short‑term momentum
Slow EMA (48) — defines the broader trend
Reference EMA (48) — used to measure deviation
Price deviation is expressed as a percentage distance from the reference EMA, allowing the indicator to detect when the market is overbought or oversold relative to its mean.
Deviation Filters
Using a configurable lookback window, the indicator tracks:
Maximum positive deviation → strongest overbought reading
Maximum negative deviation → strongest oversold reading
When deviation exceeds user‑defined thresholds, the indicator flags a strong deviation zone, highlighting areas where price is likely to revert.
Signal Conditions
A trade signal only triggers when deviation extremes align with EMA crossovers:
Long Signal
Market is strongly oversold
Fast EMA crosses above Slow EMA (bullish momentum shift)
Short Signal
Market is strongly overbought
Fast EMA crosses below Slow EMA (bearish momentum shift)
This dual‑filter approach reduces noise and focuses on moments where trend change + mean reversion occur simultaneously.
Visual Features
EMA Plots for trend clarity
Triangle markers for long/short signals
Optional deviation labels showing exact % deviation at each signal
Background shading to highlight strong deviation zones
These visual cues make it easy to spot exhaustion points and trend reversals in real time.
This indicator combines EMA trend structure, mean‑deviation analysis, and momentum‑based crossovers to identify high‑probability turning points in the market. It is designed for traders who want to detect moments when price becomes stretched far from its mean and then confirms direction through a fast/slow EMA cross.
Core Logic
The script calculates three EMAs:
Fast EMA (13) — captures short‑term momentum
Slow EMA (48) — defines the broader trend
Reference EMA (48) — used to measure deviation
Price deviation is expressed as a percentage distance from the reference EMA, allowing the indicator to detect when the market is overbought or oversold relative to its mean.
Deviation Filters
Using a configurable lookback window, the indicator tracks:
Maximum positive deviation → strongest overbought reading
Maximum negative deviation → strongest oversold reading
When deviation exceeds user‑defined thresholds, the indicator flags a strong deviation zone, highlighting areas where price is likely to revert.
Signal Conditions
A trade signal only triggers when deviation extremes align with EMA crossovers:
Long Signal
Market is strongly oversold
Fast EMA crosses above Slow EMA (bullish momentum shift)
Short Signal
Market is strongly overbought
Fast EMA crosses below Slow EMA (bearish momentum shift)
This dual‑filter approach reduces noise and focuses on moments where trend change + mean reversion occur simultaneously.
Visual Features
EMA Plots for trend clarity
Triangle markers for long/short signals
Optional deviation labels showing exact % deviation at each signal
Background shading to highlight strong deviation zones
These visual cues make it easy to spot exhaustion points and trend reversals in real time.

Aviso legal
As informações e publicações não se destinam a ser, e não constituem, conselhos ou recomendações financeiras, de investimento, comerciais ou de outro tipo fornecidos ou endossados pela TradingView. Leia mais nos Termos de Uso.
Aviso legal
As informações e publicações não se destinam a ser, e não constituem, conselhos ou recomendações financeiras, de investimento, comerciais ou de outro tipo fornecidos ou endossados pela TradingView. Leia mais nos Termos de Uso.