MACD + Run Integral Alert
# MACD Run Integral Alert
**What it does**
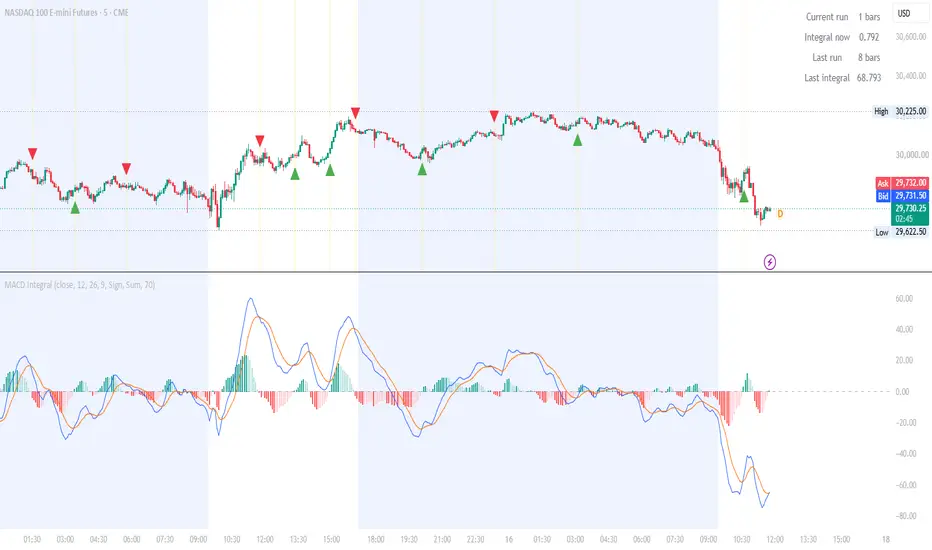
This indicator measures how much "force" a MACD histogram run has built up before it flips, and alerts you only when a strong run ends. Most MACD alerts fire on every crossover or colour flip, including the weak ones in choppy markets. This one filters those out.
**The idea**
A run is a series of consecutive histogram bars in the same state. Runs differ in character:
- 8 bars in a row, each one tall, means a short but powerful move.
- 15 bars in a row, each one short, means a slow, steady move.
Both can be significant, and counting only the number of bars or only the height of the last bar misses that. So the script adds up the bar lengths over the whole run (the integral). A flip only counts when the run that just ended reached a minimum integral you set.
**How it works**
1. The histogram is calculated as in the standard MACD (fast EMA − slow EMA, minus signal).
2. Every bar in the same state adds its length to a running total.
3. When the state flips, the finished run's total is compared to your threshold.
4. If it's high enough, the shift is marked as a strong shift. A triangle is drawn on the price chart, the background is highlighted, and the alert can trigger.
5. The counter then resets and starts collecting for the new run.
**Settings**
- **Run is defined by:** *Sign* (histogram above/below zero) or *Rising/Falling* (the colour flips of the histogram).
- **Score mode:** *Sum* is the pure integral. *Sum × bars in row* multiplies the sum by the number of bars, which gives long runs extra weight.
- **Normalize to % of price:** converts bar length to a percentage of price, so one threshold works across different instruments and price levels.
- **Alert threshold:** the minimum integral a run needs for its ending to count. This is the main setting to tune.
- **Info table:** shows the current run's length and integral, and the last finished run's values.
**How to tune it**
Scroll back through your chart and watch the info table. Note the integral values of the runs that were worth trading, then set the threshold just below them. Thresholds are instrument- and timeframe-specific, so expect to adjust them for each chart.
**Alerts**
- Strong run ended: bull to bear
- Strong run ended: bear to bull
- Strong run ended: any direction
Set the alert to **Once per bar close**. During a live bar the histogram can still change state, so intrabar alerts may fire on shifts that don't hold.
**Notes**
- The alert fires on the first bar of the new run, so it confirms the end of the previous one rather than predicting it.
- The indicator does not give entry or exit signals on its own. It tells you that a strong move has just ended, and what you do with that is up to your strategy.
- Past behaviour doesn't guarantee future results. This is a tool for analysis, not financial advice.
**What it does**
This indicator measures how much "force" a MACD histogram run has built up before it flips, and alerts you only when a strong run ends. Most MACD alerts fire on every crossover or colour flip, including the weak ones in choppy markets. This one filters those out.
**The idea**
A run is a series of consecutive histogram bars in the same state. Runs differ in character:
- 8 bars in a row, each one tall, means a short but powerful move.
- 15 bars in a row, each one short, means a slow, steady move.
Both can be significant, and counting only the number of bars or only the height of the last bar misses that. So the script adds up the bar lengths over the whole run (the integral). A flip only counts when the run that just ended reached a minimum integral you set.
**How it works**
1. The histogram is calculated as in the standard MACD (fast EMA − slow EMA, minus signal).
2. Every bar in the same state adds its length to a running total.
3. When the state flips, the finished run's total is compared to your threshold.
4. If it's high enough, the shift is marked as a strong shift. A triangle is drawn on the price chart, the background is highlighted, and the alert can trigger.
5. The counter then resets and starts collecting for the new run.
**Settings**
- **Run is defined by:** *Sign* (histogram above/below zero) or *Rising/Falling* (the colour flips of the histogram).
- **Score mode:** *Sum* is the pure integral. *Sum × bars in row* multiplies the sum by the number of bars, which gives long runs extra weight.
- **Normalize to % of price:** converts bar length to a percentage of price, so one threshold works across different instruments and price levels.
- **Alert threshold:** the minimum integral a run needs for its ending to count. This is the main setting to tune.
- **Info table:** shows the current run's length and integral, and the last finished run's values.
**How to tune it**
Scroll back through your chart and watch the info table. Note the integral values of the runs that were worth trading, then set the threshold just below them. Thresholds are instrument- and timeframe-specific, so expect to adjust them for each chart.
**Alerts**
- Strong run ended: bull to bear
- Strong run ended: bear to bull
- Strong run ended: any direction
Set the alert to **Once per bar close**. During a live bar the histogram can still change state, so intrabar alerts may fire on shifts that don't hold.
**Notes**
- The alert fires on the first bar of the new run, so it confirms the end of the previous one rather than predicting it.
- The indicator does not give entry or exit signals on its own. It tells you that a strong move has just ended, and what you do with that is up to your strategy.
- Past behaviour doesn't guarantee future results. This is a tool for analysis, not financial advice.

Aviso legal
As informações e publicações não se destinam a ser, e não constituem, conselhos ou recomendações financeiras, de investimento, comerciais ou de outro tipo fornecidos ou endossados pela TradingView. Leia mais nos Termos de Uso.
Aviso legal
As informações e publicações não se destinam a ser, e não constituem, conselhos ou recomendações financeiras, de investimento, comerciais ou de outro tipo fornecidos ou endossados pela TradingView. Leia mais nos Termos de Uso.