OPEN-SOURCE SCRIPT
RSI Multi Levels Pro (JPT)
🔹 OVERVIEW
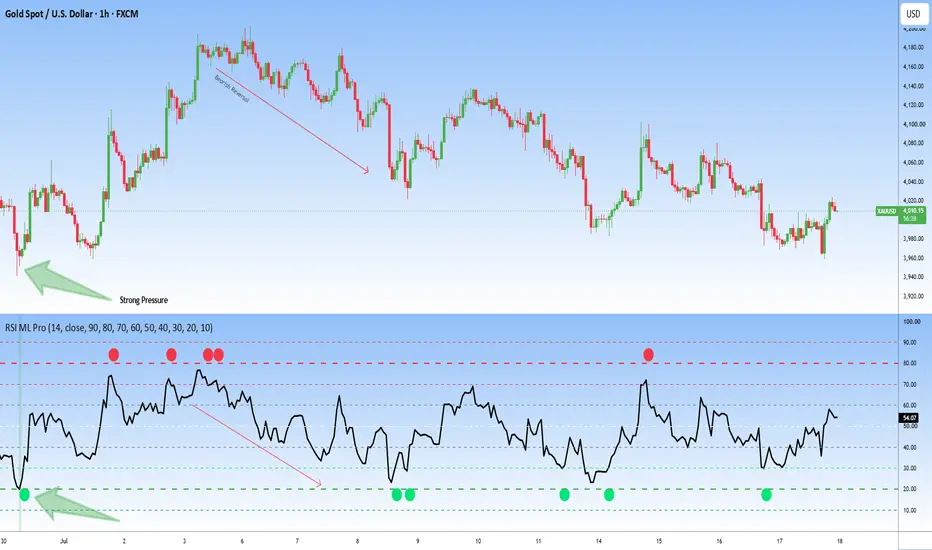
RSI Multi Levels Pro (JPT) is an enhanced Relative Strength Index (RSI) indicator that expands the traditional 70/30 approach by introducing multiple configurable RSI levels to help traders observe momentum shifts and potential reversal areas.
Instead of relying on a single overbought or oversold threshold, the indicator displays several RSI zones, allowing users to monitor how momentum develops as price moves through different strength levels.
The indicator also highlights potential exhaustion areas using optional visual markers when RSI reaches user-defined extreme level
🔹 HOW IT WORKS
The indicator calculates the standard RSI using a configurable period and plots it against multiple horizontal reference levels.
As RSI moves through these levels, traders can observe changes in market momentum and identify areas where price may begin slowing, reversing, or continuing its current move.
Optional markers are displayed when RSI reaches predefined upper or lower threshold values, helping users quickly identify extreme momentum conditions.
🔹 MULTI-LEVEL RSI STRUCTURE
Unlike a traditional RSI with only two reference levels, RSI ML Pro provides multiple zones including:
// RSI Levels
lvl90 = input.int(90, "Level 90")
lvl80 = input.int(80, "Level 80")
lvl70 = input.int(70, "Level 70")
lvl60 = input.int(60, "Level 60")
lvl50 = input.int(50, "Level 50")
lvl40 = input.int(40, "Level 40")
lvl30 = input.int(30, "Level 30")
lvl20 = input.int(20, "Level 20")
lvl10 = input.int(10, "Level 10")
These levels can help distinguish between moderate momentum and more extreme market conditions.
🔹 VISUAL FEATURES
• Standard RSI Line
• Configurable Multi-Level Reference Lines
• Upper Momentum Markers
• Lower Momentum Markers
• Customizable Colors
• Adjustable RSI Length
• Clean and Lightweight Display
• Compatible with Dark and Light Chart Themes
🔹 INDICATOR INPUTS
The indicator includes several customization options:
RSI Length
Adjust the RSI calculation period.
Reference Levels
Configure upper and lower RSI levels to match your trading style.
Signal Markers
Enable or disable momentum markers.
Colors
Customize the appearance of the RSI line, levels, and markers.
🔹 HOW TO USE
A common workflow is:
Observe the overall RSI trend.
Monitor how RSI reacts around the configured reference levels.
Watch for momentum markers when RSI reaches extreme values.
Combine RSI observations with your own price action or market structure analysis before making trading decisions.
🔹 SUITABLE MARKETS
RSI ML Pro can be used on:
• Forex
• Cryptocurrency
• Stocks
• Indices
• Commodities
• Gold
The indicator is designed to work across multiple timeframes depending on the user's trading approach.
🔹 COMBINING WITH OTHER TOOLS
Many traders choose to combine RSI ML Pro with other forms of technical analysis such as:
• Trend Analysis
• Support and Resistance
• Moving Averages
• Market Structure
• Volume Analysis
• Supply and Demand Zones
Using multiple forms of analysis may provide additional market context.
🔹NOTES
RSI measures momentum and should not be interpreted as a standalone buy or sell signal. Strong trends can remain in higher or lower RSI regions for extended periods.
This indicator is intended as a technical analysis tool and should be used alongside appropriate risk management and independent market analysis.
RSI Multi Levels Pro (JPT) is an enhanced Relative Strength Index (RSI) indicator that expands the traditional 70/30 approach by introducing multiple configurable RSI levels to help traders observe momentum shifts and potential reversal areas.
Instead of relying on a single overbought or oversold threshold, the indicator displays several RSI zones, allowing users to monitor how momentum develops as price moves through different strength levels.
The indicator also highlights potential exhaustion areas using optional visual markers when RSI reaches user-defined extreme level
🔹 HOW IT WORKS
The indicator calculates the standard RSI using a configurable period and plots it against multiple horizontal reference levels.
As RSI moves through these levels, traders can observe changes in market momentum and identify areas where price may begin slowing, reversing, or continuing its current move.
Optional markers are displayed when RSI reaches predefined upper or lower threshold values, helping users quickly identify extreme momentum conditions.
🔹 MULTI-LEVEL RSI STRUCTURE
Unlike a traditional RSI with only two reference levels, RSI ML Pro provides multiple zones including:
// RSI Levels
lvl90 = input.int(90, "Level 90")
lvl80 = input.int(80, "Level 80")
lvl70 = input.int(70, "Level 70")
lvl60 = input.int(60, "Level 60")
lvl50 = input.int(50, "Level 50")
lvl40 = input.int(40, "Level 40")
lvl30 = input.int(30, "Level 30")
lvl20 = input.int(20, "Level 20")
lvl10 = input.int(10, "Level 10")
These levels can help distinguish between moderate momentum and more extreme market conditions.
🔹 VISUAL FEATURES
• Standard RSI Line
• Configurable Multi-Level Reference Lines
• Upper Momentum Markers
• Lower Momentum Markers
• Customizable Colors
• Adjustable RSI Length
• Clean and Lightweight Display
• Compatible with Dark and Light Chart Themes
🔹 INDICATOR INPUTS
The indicator includes several customization options:
RSI Length
Adjust the RSI calculation period.
Reference Levels
Configure upper and lower RSI levels to match your trading style.
Signal Markers
Enable or disable momentum markers.
Colors
Customize the appearance of the RSI line, levels, and markers.
🔹 HOW TO USE
A common workflow is:
Observe the overall RSI trend.
Monitor how RSI reacts around the configured reference levels.
Watch for momentum markers when RSI reaches extreme values.
Combine RSI observations with your own price action or market structure analysis before making trading decisions.
🔹 SUITABLE MARKETS
RSI ML Pro can be used on:
• Forex
• Cryptocurrency
• Stocks
• Indices
• Commodities
• Gold
The indicator is designed to work across multiple timeframes depending on the user's trading approach.
🔹 COMBINING WITH OTHER TOOLS
Many traders choose to combine RSI ML Pro with other forms of technical analysis such as:
• Trend Analysis
• Support and Resistance
• Moving Averages
• Market Structure
• Volume Analysis
• Supply and Demand Zones
Using multiple forms of analysis may provide additional market context.
🔹NOTES
RSI measures momentum and should not be interpreted as a standalone buy or sell signal. Strong trends can remain in higher or lower RSI regions for extended periods.
This indicator is intended as a technical analysis tool and should be used alongside appropriate risk management and independent market analysis.
Script de código aberto
Em verdadeiro espírito do TradingView, o criador deste script o tornou de código aberto, para que os traders possam revisar e verificar sua funcionalidade. Parabéns ao autor! Embora você possa usá-lo gratuitamente, lembre-se de que a republicação do código está sujeita às nossas Regras da Casa.

📈 FREE TELEGRAM CHANNEL
🥇 Free Daily Forex, Gold & BTC Trade Signals
📚 Daily Trading Lessons & Technical Analysis
Learn, improve, and follow the market with us — completely FREE.
📲 Join Now: t.me/JosProTrader_050
🥇 Free Daily Forex, Gold & BTC Trade Signals
📚 Daily Trading Lessons & Technical Analysis
Learn, improve, and follow the market with us — completely FREE.
📲 Join Now: t.me/JosProTrader_050
Aviso legal
As informações e publicações não se destinam a ser, e não constituem, conselhos ou recomendações financeiras, de investimento, comerciais ou de outro tipo fornecidos ou endossados pela TradingView. Leia mais nos Termos de Uso.
Script de código aberto
Em verdadeiro espírito do TradingView, o criador deste script o tornou de código aberto, para que os traders possam revisar e verificar sua funcionalidade. Parabéns ao autor! Embora você possa usá-lo gratuitamente, lembre-se de que a republicação do código está sujeita às nossas Regras da Casa.
📈 FREE TELEGRAM CHANNEL
🥇 Free Daily Forex, Gold & BTC Trade Signals
📚 Daily Trading Lessons & Technical Analysis
Learn, improve, and follow the market with us — completely FREE.
📲 Join Now: t.me/JosProTrader_050
🥇 Free Daily Forex, Gold & BTC Trade Signals
📚 Daily Trading Lessons & Technical Analysis
Learn, improve, and follow the market with us — completely FREE.
📲 Join Now: t.me/JosProTrader_050
Aviso legal
As informações e publicações não se destinam a ser, e não constituem, conselhos ou recomendações financeiras, de investimento, comerciais ou de outro tipo fornecidos ou endossados pela TradingView. Leia mais nos Termos de Uso.