Renko Volume Tracker
Introduction
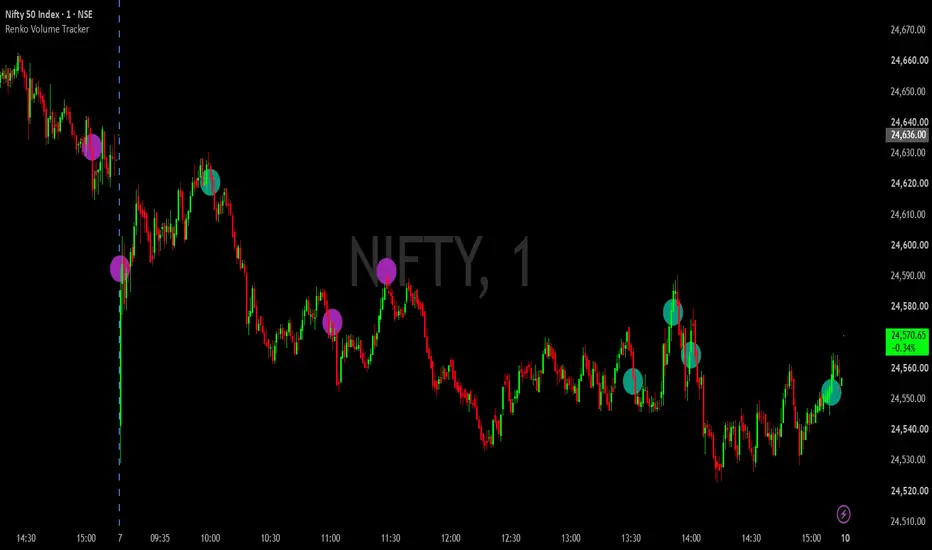
The Renko Volume Tracker is an overlay indicator designed to bridge the gap between time-based volume and price-action-based movement. While standard volume indicators analyze activity within fixed time intervals (like a 5-minute or 1-hour candle), this script dynamically groups time-based candles into "chunks" dictated by the formation of Renko bricks. By doing so, it highlights the exact time-based candle that experienced the highest volume during a specific, measurable price movement.
This indicator is designed to be applied to a standard candlestick chart while it calculates Renko price action in the background.
How It Works
Renko charts eliminate the element of time, focusing purely on price movement. A new Renko brick is only formed when the price moves by a predefined amount.
Background Renko Calculation: The script uses TradingView's ticker.renko function to track Renko brick formations in the background. Users can choose between an ATR-based box size or a Traditional fixed box size.
Volume Chunking: The script introduces a "Chunk Window" defined by 'N' number of Renko bricks (default is 3). It monitors the underlying time-based candles as these N bricks are being formed.
Pinpointing Volume Nodes: As the candles print, the script tracks the volume of each one. Once the defined number of Renko bricks (the chunk) is completed, the script drops a permanent circular label on the exact candlestick that had the highest volume within that period.
Visual Output
Teal Circles: Plotted at the low of the high-volume candle during a Renko uptrend.
Purple Circles: Plotted at the high of the high-volume candle during a Renko downtrend.
Tooltips: Hovering over any circular label will display the exact volume traded during that specific candlestick.
How to Use This Indicator
This tool is highly effective for identifying significant volume nodes and potential institutional footprints within price trends:
Dynamic Support & Resistance: The high-volume candles identified by the indicator often act as strong support and resistance levels. A high-volume candle during an uptrend (teal circle) represents a heavy area of buying interest; subsequent pullbacks to this price level may offer bounce opportunities.
Trend Exhaustion: If a high-volume node appears at the extreme top of an extended move, it may signal a climax or absorption, warning of a potential reversal.
Filtering Time Noise: Because the "chunking" is based on actual price travel (Renko) rather than arbitrary time limits, the volume nodes identified are inherently tied to meaningful price displacement rather than sideways chop.
Settings & Inputs
Box Size Method: Choose between ATR (dynamic, based on market volatility) or Traditional (fixed price amount).
Renko ATR Period / Traditional Box Size: Defines the parameters for the size of a single Renko brick.
Chunk Window (N Bricks): The number of Renko bricks required to complete a "chunk." A lower number plots more frequently, while a higher number identifies macro high-volume nodes over larger price moves.
Colors: Fully customizable pivot colors for up and down trends.
(Note: Ensure your chart data provides sufficient volume information for your selected ticker to get accurate readings).
The Renko Volume Tracker is an overlay indicator designed to bridge the gap between time-based volume and price-action-based movement. While standard volume indicators analyze activity within fixed time intervals (like a 5-minute or 1-hour candle), this script dynamically groups time-based candles into "chunks" dictated by the formation of Renko bricks. By doing so, it highlights the exact time-based candle that experienced the highest volume during a specific, measurable price movement.
This indicator is designed to be applied to a standard candlestick chart while it calculates Renko price action in the background.
How It Works
Renko charts eliminate the element of time, focusing purely on price movement. A new Renko brick is only formed when the price moves by a predefined amount.
Background Renko Calculation: The script uses TradingView's ticker.renko function to track Renko brick formations in the background. Users can choose between an ATR-based box size or a Traditional fixed box size.
Volume Chunking: The script introduces a "Chunk Window" defined by 'N' number of Renko bricks (default is 3). It monitors the underlying time-based candles as these N bricks are being formed.
Pinpointing Volume Nodes: As the candles print, the script tracks the volume of each one. Once the defined number of Renko bricks (the chunk) is completed, the script drops a permanent circular label on the exact candlestick that had the highest volume within that period.
Visual Output
Teal Circles: Plotted at the low of the high-volume candle during a Renko uptrend.
Purple Circles: Plotted at the high of the high-volume candle during a Renko downtrend.
Tooltips: Hovering over any circular label will display the exact volume traded during that specific candlestick.
How to Use This Indicator
This tool is highly effective for identifying significant volume nodes and potential institutional footprints within price trends:
Dynamic Support & Resistance: The high-volume candles identified by the indicator often act as strong support and resistance levels. A high-volume candle during an uptrend (teal circle) represents a heavy area of buying interest; subsequent pullbacks to this price level may offer bounce opportunities.
Trend Exhaustion: If a high-volume node appears at the extreme top of an extended move, it may signal a climax or absorption, warning of a potential reversal.
Filtering Time Noise: Because the "chunking" is based on actual price travel (Renko) rather than arbitrary time limits, the volume nodes identified are inherently tied to meaningful price displacement rather than sideways chop.
Settings & Inputs
Box Size Method: Choose between ATR (dynamic, based on market volatility) or Traditional (fixed price amount).
Renko ATR Period / Traditional Box Size: Defines the parameters for the size of a single Renko brick.
Chunk Window (N Bricks): The number of Renko bricks required to complete a "chunk." A lower number plots more frequently, while a higher number identifies macro high-volume nodes over larger price moves.
Colors: Fully customizable pivot colors for up and down trends.
(Note: Ensure your chart data provides sufficient volume information for your selected ticker to get accurate readings).

Aviso legal
As informações e publicações não se destinam a ser, e não constituem, conselhos ou recomendações financeiras, de investimento, comerciais ou de outro tipo fornecidos ou endossados pela TradingView. Leia mais nos Termos de Uso.
Aviso legal
As informações e publicações não se destinam a ser, e não constituem, conselhos ou recomendações financeiras, de investimento, comerciais ou de outro tipo fornecidos ou endossados pela TradingView. Leia mais nos Termos de Uso.