RSI+
Hello friends,
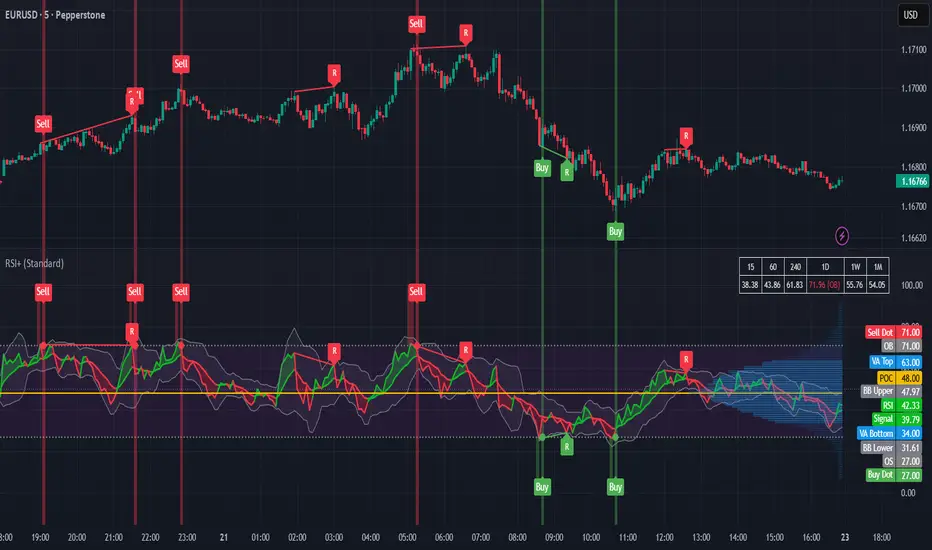
Meet RSI+, an enhanced and versatile version of the classic Relative Strength Index. It combines the familiar RSI oscillator with adaptive statistical profiling, signal analysis, divergence detection, multi-timeframe monitoring, and a flexible Buy/Sell signal engine.
Instead of relying solely on fixed RSI levels, RSI+ analyzes the actual distribution of RSI values to help identify where the oscillator is statistically concentrated and where its current reading stands relative to that distribution.
🛠️ How It Works
At its core, RSI+ calculates the standard Relative Strength Index and builds a Values Distribution Profile from its historical readings. The profile reveals how frequently RSI values occur, allowing the indicator to identify statistically dominant and extreme areas.
The Point of Control (POC) represents the RSI level with the highest concentration of values, while the Value Area highlights the range where RSI readings are most concentrated. These dynamic reference points can be used alongside the traditional RSI midline and Overbought/Oversold concepts.
On top of the RSI itself, the indicator provides a configurable Signal Line, optional Bollinger Bands, divergence detection, multi-timeframe monitoring, and a flexible signal framework. All of these components work together around the same RSI data, giving you a compact environment for analyzing momentum and oscillator behavior.
📊 RSI + Signal Line + Bollinger Bands
The RSI can be combined with a configurable Signal Line using different smoothing methods. Optional Bollinger Bands can be applied to the Signal Line, providing additional context around its current position and volatility: 📈 Divergences
RSI+ can identify both Regular and Hidden Bullish/Bearish Divergences using configurable pivot lookbacks. Divergence signals compare price swings with RSI swings to highlight situations where momentum and price action move differently: 📊 Values Distribution Profile
The Values Distribution Profile maps the historical distribution of RSI readings and identifies its statistically dominant areas. The Point of Control (POC) marks the most frequently occurring RSI level, while the Value Area shows where RSI values are concentrated.
The indicator can use this distribution to automatically adjust its Overbought/Oversold levels, allowing them to adapt to the observed behavior of the oscillator rather than relying exclusively on fixed values: 🎯 Buy/Sell Signals
RSI+ provides a flexible signal engine where Buy and Sell conditions can be constructed from crossovers involving RSI, Signal Line, Midline, POC, and other available reference levels.
Up to 6 independent Buy and 6 independent Sell signal slots can be configured, allowing several conditions to be monitored simultaneously. Strategy Mode can optionally prevent overlapping Buy/Sell signals.
Signals can be displayed using different visualization styles, including Labels, Dots, Stripes, or combined modes: ⏱️ HTF Screener
The integrated HTF Screener allows you to monitor RSI values and Overbought/Oversold states across up to 6 higher timeframes directly from the indicator: 🔔 Alerts
RSI+ includes alerts for RSI, Signal Line, Midline, Bollinger Bands, POC, Overbought/Oversold conditions, divergences, and Buy/Sell signals. The alert system can be customized to monitor only the events that matter to you, including a combined Any Selected Alert condition. 🔥 Key Features
I hope this toolkit becomes a valuable part of your trading workflow. If you have any feedback, ideas, or suggestions for future improvements, I'd be happy to hear them.
👋 Good luck and happy trading!
Meet RSI+, an enhanced and versatile version of the classic Relative Strength Index. It combines the familiar RSI oscillator with adaptive statistical profiling, signal analysis, divergence detection, multi-timeframe monitoring, and a flexible Buy/Sell signal engine.
Instead of relying solely on fixed RSI levels, RSI+ analyzes the actual distribution of RSI values to help identify where the oscillator is statistically concentrated and where its current reading stands relative to that distribution.
🛠️ How It Works
At its core, RSI+ calculates the standard Relative Strength Index and builds a Values Distribution Profile from its historical readings. The profile reveals how frequently RSI values occur, allowing the indicator to identify statistically dominant and extreme areas.
The Point of Control (POC) represents the RSI level with the highest concentration of values, while the Value Area highlights the range where RSI readings are most concentrated. These dynamic reference points can be used alongside the traditional RSI midline and Overbought/Oversold concepts.
On top of the RSI itself, the indicator provides a configurable Signal Line, optional Bollinger Bands, divergence detection, multi-timeframe monitoring, and a flexible signal framework. All of these components work together around the same RSI data, giving you a compact environment for analyzing momentum and oscillator behavior.
📊 RSI + Signal Line + Bollinger Bands
The RSI can be combined with a configurable Signal Line using different smoothing methods. Optional Bollinger Bands can be applied to the Signal Line, providing additional context around its current position and volatility:
RSI+ can identify both Regular and Hidden Bullish/Bearish Divergences using configurable pivot lookbacks. Divergence signals compare price swings with RSI swings to highlight situations where momentum and price action move differently:
The Values Distribution Profile maps the historical distribution of RSI readings and identifies its statistically dominant areas. The Point of Control (POC) marks the most frequently occurring RSI level, while the Value Area shows where RSI values are concentrated.
The indicator can use this distribution to automatically adjust its Overbought/Oversold levels, allowing them to adapt to the observed behavior of the oscillator rather than relying exclusively on fixed values:
RSI+ provides a flexible signal engine where Buy and Sell conditions can be constructed from crossovers involving RSI, Signal Line, Midline, POC, and other available reference levels.
Up to 6 independent Buy and 6 independent Sell signal slots can be configured, allowing several conditions to be monitored simultaneously. Strategy Mode can optionally prevent overlapping Buy/Sell signals.
Signals can be displayed using different visualization styles, including Labels, Dots, Stripes, or combined modes:
The integrated HTF Screener allows you to monitor RSI values and Overbought/Oversold states across up to 6 higher timeframes directly from the indicator:
RSI+ includes alerts for RSI, Signal Line, Midline, Bollinger Bands, POC, Overbought/Oversold conditions, divergences, and Buy/Sell signals. The alert system can be customized to monitor only the events that matter to you, including a combined Any Selected Alert condition.
- Classic RSI with enhanced statistical analysis
- Values Distribution Profile with Point of Control (POC) and Value Area
- Automatic Overbought/Oversold adjustment based on RSI value distribution
- Configurable Signal Line with selectable smoothing methods
- Optional Bollinger Bands around the Signal Line
- Regular and Hidden Bullish/Bearish Divergence detection
- Up to 6 independent Buy and 6 independent Sell signal slots
- Strategy Mode to prevent overlapping Buy/Sell signals
- Multiple signal visualization styles
- Signal Ribbon based on RSI and Signal Line direction
- HTF Screener for up to 6 higher timeframes
- Comprehensive and customizable alerts
I hope this toolkit becomes a valuable part of your trading workflow. If you have any feedback, ideas, or suggestions for future improvements, I'd be happy to hear them.
👋 Good luck and happy trading!
Disponível em Espaço Pago
Este indicador está disponível apenas para assinantes de Trading Toolkit. Assine para acessar este e outros scripts de everget.

👨🏻💻 Coding services -> Telegram: @alex_everget
🆓 List of my FREE indicators: bit.ly/2S7EPuN
💰 List of my PREMIUM indicators: bit.ly/33MA81f
Claim your $20 bonus just for joining Bybit!
bybit.com/invite?ref=56ZLQ0Z
🆓 List of my FREE indicators: bit.ly/2S7EPuN
💰 List of my PREMIUM indicators: bit.ly/33MA81f
Claim your $20 bonus just for joining Bybit!
bybit.com/invite?ref=56ZLQ0Z
Aviso legal
As informações e publicações não se destinam a ser, e não constituem, conselhos ou recomendações financeiras, de investimento, comerciais ou de outro tipo fornecidos ou endossados pela TradingView. Leia mais nos Termos de Uso.
Disponível em Espaço Pago
Este indicador está disponível apenas para assinantes de Trading Toolkit. Assine para acessar este e outros scripts de everget.
👨🏻💻 Coding services -> Telegram: @alex_everget
🆓 List of my FREE indicators: bit.ly/2S7EPuN
💰 List of my PREMIUM indicators: bit.ly/33MA81f
Claim your $20 bonus just for joining Bybit!
bybit.com/invite?ref=56ZLQ0Z
🆓 List of my FREE indicators: bit.ly/2S7EPuN
💰 List of my PREMIUM indicators: bit.ly/33MA81f
Claim your $20 bonus just for joining Bybit!
bybit.com/invite?ref=56ZLQ0Z
Aviso legal
As informações e publicações não se destinam a ser, e não constituem, conselhos ou recomendações financeiras, de investimento, comerciais ou de outro tipo fornecidos ou endossados pela TradingView. Leia mais nos Termos de Uso.