OPEN-SOURCE SCRIPT
Smart Money Volume [JoeyWave]
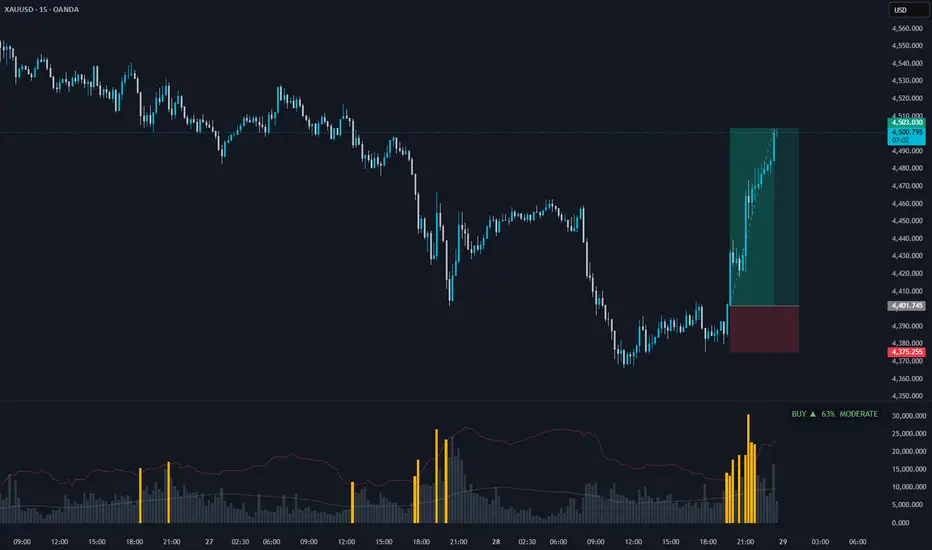
Smart Money Volume highlights statistically abnormal volume bars and quantifies real-time buy/sell pressure using two well-established methods from quantitative finance.
═══════════════════════════════
WHAT IT DOES
═══════════════════════════════
• Volume Panel — amber bars mark statistical outliers detected via Tukey's IQR method
• Pressure HUD (top-right) — shows current dominant side (BUY / SELL), pressure magnitude (%), and strength (WEAK / MODERATE / STRONG)
═══════════════════════════════
METHODOLOGY
═══════════════════════════════
1. Outlier Detection — Tukey's Interquartile Range
threshold = Q3 + k × (Q3 − Q1)
Default k = 2.0 ("extreme outlier" by Tukey's standard). This is robust to skewed volume distributions where mean/std-based methods fail.
2. Buy/Sell Classification — Bulk Volume Classification (BVC)
Based on Easley, López de Prado, O'Hara (2012). Each bar's volume is split into buy/sell proportions using the normalized log-return:
buy_fraction ≈ Φ(log_return / σ)
where Φ is the standard normal CDF, approximated with a logistic function.
3. Aggregated Pressure
Weighted buy and sell volumes are summed over the lookback window (default 20 bars). Pressure = buy_volume / total_volume.
═══════════════════════════════
HOW TO READ
═══════════════════════════════
• Amber bars → unusual volume activity worth investigating
• HUD BUY ▲ → buyers dominant; check % for conviction
• HUD SELL ▼ → sellers dominant
• STRONG ≥ 65% → high conviction
• MODERATE ≥ 55% → moderate
• WEAK < 55% → indecisive, near equilibrium
═══════════════════════════════
HOW TO USE
═══════════════════════════════
• Confluence tool — confirm breakouts, reversals, or trend continuation when an outlier aligns with your setup
• Pressure HUD as a regime filter — only take long setups when HUD shows BUY MODERATE+, shorts when SELL MODERATE+
• Look for divergences — price making new highs while pressure flips to SELL is a classic exhaustion signal
═══════════════════════════════
SETTINGS
═══════════════════════════════
• IQR Lookback — bars used for percentile calculation (default 50)
• IQR Multiplier — 1.5 = standard outlier, 2.0 = extreme (default)
• BVC Sigma Window — return volatility window (default 50)
• Pressure Lookback — bars aggregated for the HUD (default 20)
═══════════════════════════════
REFERENCES
═══════════════════════════════
Easley, D., López de Prado, M., O'Hara, M. (2012) — "Flow Toxicity and Liquidity in a High Frequency World." Review of Financial Studies.
Tukey, J. W. (1977) — "Exploratory Data Analysis." Addison-Wesley.
═══════════════════════════════
Works on any symbol and timeframe with available volume data. Tested on FX (OANDA tick volume), futures, indices, and crypto.
Author: JoeyWave
═══════════════════════════════
WHAT IT DOES
═══════════════════════════════
• Volume Panel — amber bars mark statistical outliers detected via Tukey's IQR method
• Pressure HUD (top-right) — shows current dominant side (BUY / SELL), pressure magnitude (%), and strength (WEAK / MODERATE / STRONG)
═══════════════════════════════
METHODOLOGY
═══════════════════════════════
1. Outlier Detection — Tukey's Interquartile Range
threshold = Q3 + k × (Q3 − Q1)
Default k = 2.0 ("extreme outlier" by Tukey's standard). This is robust to skewed volume distributions where mean/std-based methods fail.
2. Buy/Sell Classification — Bulk Volume Classification (BVC)
Based on Easley, López de Prado, O'Hara (2012). Each bar's volume is split into buy/sell proportions using the normalized log-return:
buy_fraction ≈ Φ(log_return / σ)
where Φ is the standard normal CDF, approximated with a logistic function.
3. Aggregated Pressure
Weighted buy and sell volumes are summed over the lookback window (default 20 bars). Pressure = buy_volume / total_volume.
═══════════════════════════════
HOW TO READ
═══════════════════════════════
• Amber bars → unusual volume activity worth investigating
• HUD BUY ▲ → buyers dominant; check % for conviction
• HUD SELL ▼ → sellers dominant
• STRONG ≥ 65% → high conviction
• MODERATE ≥ 55% → moderate
• WEAK < 55% → indecisive, near equilibrium
═══════════════════════════════
HOW TO USE
═══════════════════════════════
• Confluence tool — confirm breakouts, reversals, or trend continuation when an outlier aligns with your setup
• Pressure HUD as a regime filter — only take long setups when HUD shows BUY MODERATE+, shorts when SELL MODERATE+
• Look for divergences — price making new highs while pressure flips to SELL is a classic exhaustion signal
═══════════════════════════════
SETTINGS
═══════════════════════════════
• IQR Lookback — bars used for percentile calculation (default 50)
• IQR Multiplier — 1.5 = standard outlier, 2.0 = extreme (default)
• BVC Sigma Window — return volatility window (default 50)
• Pressure Lookback — bars aggregated for the HUD (default 20)
═══════════════════════════════
REFERENCES
═══════════════════════════════
Easley, D., López de Prado, M., O'Hara, M. (2012) — "Flow Toxicity and Liquidity in a High Frequency World." Review of Financial Studies.
Tukey, J. W. (1977) — "Exploratory Data Analysis." Addison-Wesley.
═══════════════════════════════
Works on any symbol and timeframe with available volume data. Tested on FX (OANDA tick volume), futures, indices, and crypto.
Author: JoeyWave
Script de código aberto
Em verdadeiro espírito do TradingView, o criador deste script o tornou de código aberto, para que os traders possam revisar e verificar sua funcionalidade. Parabéns ao autor! Embora você possa usá-lo gratuitamente, lembre-se de que a republicação do código está sujeita às nossas Regras da Casa.

Aviso legal
As informações e publicações não se destinam a ser, e não constituem, conselhos ou recomendações financeiras, de investimento, comerciais ou de outro tipo fornecidos ou endossados pela TradingView. Leia mais nos Termos de Uso.
Script de código aberto
Em verdadeiro espírito do TradingView, o criador deste script o tornou de código aberto, para que os traders possam revisar e verificar sua funcionalidade. Parabéns ao autor! Embora você possa usá-lo gratuitamente, lembre-se de que a republicação do código está sujeita às nossas Regras da Casa.
Aviso legal
As informações e publicações não se destinam a ser, e não constituem, conselhos ou recomendações financeiras, de investimento, comerciais ou de outro tipo fornecidos ou endossados pela TradingView. Leia mais nos Termos de Uso.