Atualizado
Trendline Breakouts Targets Pro [MarkitTick]
Get this and other exclusive indicators in MarkitTick
This indicator is part of MarkitTick's Paid Space. Subscribe for $43.75/month to use it on your charts along with the author's other exclusive indicators. You pay right on TradingView and get access straight away.
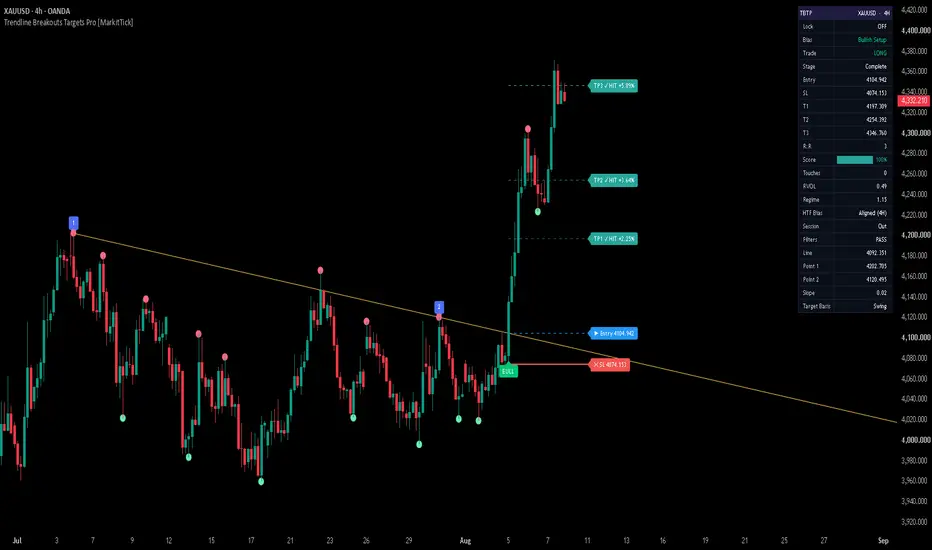
Explore MarkitTick💡 The Trendline Breakouts Targets Pro is a comprehensive and advanced technical analysis framework designed to automate the process of trendline projection and trade management. By allowing traders to define specific temporal anchor points, the algorithm calculates precise trajectories and actively monitors price action for structural breakouts. It removes the ambiguity often associated with manual charting by establishing strict mathematical rules for trendlines, while offering a robust suite of validation filters and dynamic profit-taking mechanisms. This tool bridges the gap between static chart drawings and active, real-time algorithmic execution monitoring.
This is the professional version of the free indicator Trend Break Targets
✨ Originality and Utility
This script distinguishes itself from standard drawing tools by transforming a static concept into a reactive, multi-stage trade management system.
🔬 Methodology and Concepts
● Algorithmic Trendline Construction
The foundational logic relies on the precise detection of local market extremes. The algorithm scans historical data surrounding the user-defined Start and End dates to locate mathematical Pivot Highs or Pivot Lows. Once these primary anchors are established, the script calculates the slope—the exact rate of price change over time—and projects a linear equation into the future to serve as the breakout threshold.
● Multi-Domain Validation Engine
A structural break of the trendline is necessary but not sufficient for a signal. The engine requires secondary confirmations:
● Fibonacci-Scaled Target Mechanics
The framework calculates an initial Base Distance, representing the vertical span between the breakout price and the nearest logical pivot point. Subsequent profit targets are derived via geometric multipliers:
🎨 Visual Guide

● Core Chart Elements
● Trade Management Zones
📖 How to Use

⚙️ Inputs and Settings
● Temporal Configuration
● Filter Toggles
● Aesthetic Customization
🔍 Deconstruction of the Underlying Scientific and Academic Framework
● Linear Interpolation in Time-Series Data
At its mathematical core, the indicator relies on linear extrapolation to project localized price action into future periods. By calculating the differential in price over the specific time elapsed between Point 1 and Point 2, the algorithm deduces a constant rate of change (the slope). This slope is incrementally multiplied by the progressing bar index to continuously update the exact dynamic threshold required for a valid breakout.
● Calculus-Based Local Extrema Detection
The proprietary pivot detection system acts as an algorithmic representation of local maxima and minima found in differential calculus. It utilizes a comparative scanning array to determine if a candidate data point holds the absolute highest or lowest value relative to a strictly defined, symmetrical subset of neighboring values. This isolates true structural shifts from standard market noise.
● Proportional Geometric Scaling
Target generation applies the mathematical principles of the Fibonacci sequence—specifically the 1.618 and 2.618 ratios—to financial time-series modeling. By calculating the initial Base Distance between the breakout threshold and the closest structural extreme, the script employs these golden ratios to systematically estimate future points of momentum exhaustion and liquidity resting areas.
● Multivariate Boolean Logic Matrices
The confirmation engine operates as a complex Boolean logic gate system. In order to switch the execution state from passive to triggered, it requires a simultaneous intersection of multiple independent variables. This logical AND operation effectively cross-references volume behavior, structural hierarchy, and momentum oscillators, functioning as a strict probabilistic filter designed to minimize Type I errors (false positives) in breakout trading.
● 🔓 vs 🔒 (Pro vs. Free)
● Logic & Signal Generation
• Free: Relies on localized, static price-action crossovers (close > trendline) to define a breakout. It uses isolated pivot calculations and Fibonacci constants (1.618, 2.618) to project targets statically without forward-looking validation.
• Pro: Introduces a robust Multi-Factor Confluence Engine. Breakout triggers are strictly gated behind mandatory, user-configurable boolean arrays including Volume confirmation (SMA crossover), momentum (MACD crosses, RSI thresholds), trend filters (SMA positioning), and structural validation (CHOCH and strict Swing Breaks). This severely minimizes false positives (whipsaws) and ensures high-probability market entries.
● Trade Management Architecture
• Free: Fire-and-forget logic. Once a line is broken, standard targets are drawn instantly without ongoing state tracking.
• Pro: Employs a sophisticated State-Machine architecture (tradeStage tracking). The algorithm tracks active positions dynamically through stages (Aiming for T1, Aiming for T2, etc.), progressively recalculating and adjusting active conditions. This enables dynamic progressive visuals where profit and loss boxes physically update on the chart chart based on the real-time lifecycle of the trade.
● Risk Management & Capital Preservation
• Free: Lacks native Stop-Loss (SL) computation. Focuses entirely on Take-Profit (TP) zones, leaving risk management up to the discretionary trader.
• Pro: Integrates a highly quantitative Risk Management Module. Calculates precise Stop-Loss levels natively tied to dynamic baseline distances (e.g., maintaining specific risk-to-reward ratios like setting SL distance at exactly 1/3 of the target distance). As the trade progresses through higher stages, the SL structure dynamically adjusts to lock in equity and manage downside risk systematically.
● Algorithmic Execution & Automation
• Free: A purely visual tool with no internal alert framework or payload generation.
• Pro: Built for automated execution. The Pro build features a strict JSON Alert Engine evaluating exclusively on barstate.isconfirmed. It dynamically constructs JSON payloads passing the ticker, timeframe, trade side, precise entry, dynamic TP, and progressive SL values directly to external webhooks, algorithmic bridges, or proprietary execution bots.
● Memory Management & Execution Efficiency
• Free: Standard historical buffer handling, suitable for everyday retail charting.
• Pro: Implements strict compile-time optimizations and max_bars_back overrides for high, low, and close arrays. This prevents buffer limit runtime errors when the indicator is scanning deep historical datasets for algorithmic backtesting, ensuring seamless performance across extensive quantitative studies.
⚠️ Disclaimer
All provided scripts and indicators are strictly for educational exploration and must not be interpreted as financial advice or a recommendation to execute trades. I expressly disclaim all liability for any financial losses or damages that may result, directly or indirectly, from the reliance on or application of these tools. Market participation carries inherent risk where past performance never guarantees future returns, leaving all investment decisions and due diligence solely at your own discretion.
This is the professional version of the free indicator Trend Break Targets
✨ Originality and Utility
This script distinguishes itself from standard drawing tools by transforming a static concept into a reactive, multi-stage trade management system.
- Automated Extrapolation: Traders simply input two specific dates, and the indicator mathematically plots the exact trendline based on confirmed historical extremes, ensuring absolute objectivity.
- Progressive Targeting Protocol: Instead of relying on fixed reward zones, the indicator recalculates its Stop Loss and Take Profit levels dynamically as the market successfully breaches consecutive target thresholds.
- Multi-Tiered Authentication: It prevents premature entries by requiring strict confluence. Users can mandate up to six independent technical confirmations—ranging from Volume surges to RSI thresholds—before a breakout is deemed valid.
- Comprehensive Risk Visualization: The script generates clean, translucent boxes directly on the chart, allowing traders to instantly visualize their exact risk-to-reward parameters without requiring external measurement tools.
🔬 Methodology and Concepts
● Algorithmic Trendline Construction
The foundational logic relies on the precise detection of local market extremes. The algorithm scans historical data surrounding the user-defined Start and End dates to locate mathematical Pivot Highs or Pivot Lows. Once these primary anchors are established, the script calculates the slope—the exact rate of price change over time—and projects a linear equation into the future to serve as the breakout threshold.
● Multi-Domain Validation Engine
A structural break of the trendline is necessary but not sufficient for a signal. The engine requires secondary confirmations:
- Volume SMA: Ensures the breakout candle demonstrates elevated participation by comparing its volume to a defined Simple Moving Average.
- Structural CHOCH: Validates that the broader market structure has shifted by confirming a break of the most recent swing high or low.
- Momentum Filtering: Utilizes the Relative Strength Index (RSI) and MACD crossovers to ensure sufficient momentum is backing the directional move.
● Fibonacci-Scaled Target Mechanics
The framework calculates an initial Base Distance, representing the vertical span between the breakout price and the nearest logical pivot point. Subsequent profit targets are derived via geometric multipliers:
- Target 1 reflects a standard 1:1 projection of the established Base Distance.
- Target 2 is mathematically derived using the 1.618 golden ratio extension.
- Target 3 maps extreme exhaustion points using the 2.618 sequence multiplier.
🎨 Visual Guide
● Core Chart Elements
- Anchor Point Labels (1 & 2): Clearly display the historical origin coordinates used to construct the primary trend trajectory.
- Dynamic Trendline: The central diagonal axis extending continuously from the anchor points across the right side of the chart.
- Swing Point Nodes: Highly visible circular plots that track recent Pivot Highs and Pivot Lows, giving traders immediate context on local market structure.
- Breakout Alerts: Distinct directional labels that populate exactly on the candle that breaches the line and satisfies all active confirmation filters.
● Trade Management Zones
- Profit Target Boxes: Translucent graphical regions that illustrate the active take-profit zones based on current trade progression.
- Stop Loss Boxes: Contrasting shaded areas displaying the active risk threshold, recalculating automatically as targets are reached.
- Embedded Value Markers: Exact numerical price quotes printed adjacent to the visual boxes to eliminate guesswork during order placement.
📖 How to Use
- Establish the Origin Coordinates: Access the primary configuration menu and set the Start Date (Point 1) and End Date (Point 2) corresponding to the structural highs or lows of the trend you are monitoring.
- Calibrate Validation Sensitivity: Toggle mandatory condition filters such as Volume Spikes, SMA positioning, or RSI limits to match the volatility of your chosen asset.
- Await Algorithmic Confirmation: Monitor the chart until the system prints a validated Breakout or Breakdown marker. This signifies that the slope has been breached with full technical confluence.
- Execute and Manage: Utilize the drawn Profit and Loss boxes to structure your orders. As price achieves Target 1, observe the automated shifting of the Stop Loss zone to secure capital, and adjust your trailing stops accordingly.
⚙️ Inputs and Settings
● Temporal Configuration
- Start Date / End Date: The precise timestamps defining the baseline anchors for trend projection.
- Pivot Left / Right Lengths: Dictates the strictness of structural extreme detection; higher values demand greater isolation for a candle to be categorized as a pivot.
- Fallback Lookback: A safety mechanism defining how many bars to scan for an extreme if a standard pivot is not immediately present.
- Target Extend Bars: Controls the horizontal visual length of the generated target and stop-loss boxes.
● Filter Toggles
- Require Volume Confirmation: Activates the volume SMA prerequisite.
- Require CHOCH / Swing Break: Enforces a fundamental shift in local market structure before signaling.
- Require MACD / SMA / RSI: Toggles standard momentum and moving average positioning filters.
● Aesthetic Customization
- Color Modules: Independent color selection for trendlines, breakout markers, target zones, and stop-loss regions.
- Display Overrides: Master switches to toggle visibility for secondary targets, all static targets simultaneously, or historical swing points to maintain a decluttered workspace.
🔍 Deconstruction of the Underlying Scientific and Academic Framework
● Linear Interpolation in Time-Series Data
At its mathematical core, the indicator relies on linear extrapolation to project localized price action into future periods. By calculating the differential in price over the specific time elapsed between Point 1 and Point 2, the algorithm deduces a constant rate of change (the slope). This slope is incrementally multiplied by the progressing bar index to continuously update the exact dynamic threshold required for a valid breakout.
● Calculus-Based Local Extrema Detection
The proprietary pivot detection system acts as an algorithmic representation of local maxima and minima found in differential calculus. It utilizes a comparative scanning array to determine if a candidate data point holds the absolute highest or lowest value relative to a strictly defined, symmetrical subset of neighboring values. This isolates true structural shifts from standard market noise.
● Proportional Geometric Scaling
Target generation applies the mathematical principles of the Fibonacci sequence—specifically the 1.618 and 2.618 ratios—to financial time-series modeling. By calculating the initial Base Distance between the breakout threshold and the closest structural extreme, the script employs these golden ratios to systematically estimate future points of momentum exhaustion and liquidity resting areas.
● Multivariate Boolean Logic Matrices
The confirmation engine operates as a complex Boolean logic gate system. In order to switch the execution state from passive to triggered, it requires a simultaneous intersection of multiple independent variables. This logical AND operation effectively cross-references volume behavior, structural hierarchy, and momentum oscillators, functioning as a strict probabilistic filter designed to minimize Type I errors (false positives) in breakout trading.
● 🔓 vs 🔒 (Pro vs. Free)
● Logic & Signal Generation
• Free: Relies on localized, static price-action crossovers (close > trendline) to define a breakout. It uses isolated pivot calculations and Fibonacci constants (1.618, 2.618) to project targets statically without forward-looking validation.
• Pro: Introduces a robust Multi-Factor Confluence Engine. Breakout triggers are strictly gated behind mandatory, user-configurable boolean arrays including Volume confirmation (SMA crossover), momentum (MACD crosses, RSI thresholds), trend filters (SMA positioning), and structural validation (CHOCH and strict Swing Breaks). This severely minimizes false positives (whipsaws) and ensures high-probability market entries.
● Trade Management Architecture
• Free: Fire-and-forget logic. Once a line is broken, standard targets are drawn instantly without ongoing state tracking.
• Pro: Employs a sophisticated State-Machine architecture (tradeStage tracking). The algorithm tracks active positions dynamically through stages (Aiming for T1, Aiming for T2, etc.), progressively recalculating and adjusting active conditions. This enables dynamic progressive visuals where profit and loss boxes physically update on the chart chart based on the real-time lifecycle of the trade.
● Risk Management & Capital Preservation
• Free: Lacks native Stop-Loss (SL) computation. Focuses entirely on Take-Profit (TP) zones, leaving risk management up to the discretionary trader.
• Pro: Integrates a highly quantitative Risk Management Module. Calculates precise Stop-Loss levels natively tied to dynamic baseline distances (e.g., maintaining specific risk-to-reward ratios like setting SL distance at exactly 1/3 of the target distance). As the trade progresses through higher stages, the SL structure dynamically adjusts to lock in equity and manage downside risk systematically.
● Algorithmic Execution & Automation
• Free: A purely visual tool with no internal alert framework or payload generation.
• Pro: Built for automated execution. The Pro build features a strict JSON Alert Engine evaluating exclusively on barstate.isconfirmed. It dynamically constructs JSON payloads passing the ticker, timeframe, trade side, precise entry, dynamic TP, and progressive SL values directly to external webhooks, algorithmic bridges, or proprietary execution bots.
● Memory Management & Execution Efficiency
• Free: Standard historical buffer handling, suitable for everyday retail charting.
• Pro: Implements strict compile-time optimizations and max_bars_back overrides for high, low, and close arrays. This prevents buffer limit runtime errors when the indicator is scanning deep historical datasets for algorithmic backtesting, ensuring seamless performance across extensive quantitative studies.
⚠️ Disclaimer
All provided scripts and indicators are strictly for educational exploration and must not be interpreted as financial advice or a recommendation to execute trades. I expressly disclaim all liability for any financial losses or damages that may result, directly or indirectly, from the reliance on or application of these tools. Market participation carries inherent risk where past performance never guarantees future returns, leaving all investment decisions and due diligence solely at your own discretion.
Notas de Lançamento
Optimizing indicator performance and execution speedNotas de Lançamento
This release evolves the indicator from a manually anchored breakout tool into a fully automated, confluence-driven trade engine. Trendline construction can now be derived automatically from validated market structure, with additional integrity checks that assess a line's slope profile, its age, and how many times price has genuinely respected it before any signal is permitted. Breakout validation has been rebuilt around a weighted confluence scoring framework, allowing each confirmation layer — volume behaviour, relative participation, candle quality, penetration depth, follow-through, retest behaviour, higher-timeframe bias, volatility regime, and session context — to be individually enabled, weighted, and combined into a single tunable conviction threshold rather than a rigid all-or-nothing gate. Trade management is now adaptive: stop placement supports multiple derivation modes, targets can align to nearby structure, a minimum risk-to-reward gate filters low-quality setups, and break-even progression is available after the first objective is reached. Finally, the release adds a live analytics dashboard with visual confluence metering and a complete event-driven alert and webhook layer that emits structured entry, target, and invalidation payloads with fully configurable action fields.Notas de Lançamento
Trendline Breakouts Targets Pro — Update SummaryNon-Repainting Signal Integrity
Swing detection, session state, volatility regime and fallback range references now resolve exclusively from fully confirmed data. Swing markers, anchor points and every level derived from them lock in place once printed and no longer shift as the live bar develops. What you saw when a signal appeared is what remains in history, which means backtest review and live trading now speak the same language.
Chart-Type Protection
The indicator now verifies that it is running on a standard chart type before doing anything else. On synthetic chart types the prices shown are not real transactable prices, so any entry, stop or target drawn from them would be untradeable. Instead of silently producing misleading levels, the script stops with a clear on-screen explanation.
Real-Time Target and Stop Tracking
Once a trade is active, target and stop-loss contact is now evaluated against the live bar rather than waiting for the previous bar to be referenced. Stage progression, trailing stop advancement and trade completion all register the moment price actually reaches the level, removing the lag that previously delayed visual updates on the chart.
Confirmed-Close Alert Delivery
All trade alerts — entry, each target and stop-loss — now dispatch only on confirmed bar close. Alerts are additionally stage-aware and mutually exclusive: a stop-loss event takes precedence over a target event on the same bar, and each target can only fire while the trade is actually working toward it. The result is one clean, ordered notification stream with no duplicate or contradictory messages.
Hardened Webhook Payloads
Custom action text entered in the alert settings is now sanitised before being written into the outgoing payload. Quotation marks or escape characters typed into those fields can no longer break the message structure, so third-party automation platforms receive a valid, parseable payload every time.
Flexible Anchor Date Matching
Manual Point 1 and Point 2 selections now resolve to the first bar at or after the chosen moment rather than requiring an exact timestamp match. Anchors now land reliably across all timeframes, session-gapped instruments and holiday-affected calendars instead of silently failing to register.
Higher Timeframe Safety Fallback
If the selected higher-timeframe bias source is set below the active chart timeframe, the indicator automatically falls back to the chart timeframe rather than producing an invalid request. The bias filter now stays functional regardless of how the chart timeframe is changed after setup.
Duplicate Anchor Detection
If both manual anchor points resolve to the same bar, the indicator now reports it explicitly rather than attempting to build a trendline from a single point. You are told immediately what to correct instead of being left with a missing or nonsensical line.
Stop Placement Guarantee
Structure-based stop losses are now guaranteed to sit on the protective side of the trendline. The stop can no longer be positioned at or beyond the entry reference, which eliminates the invalid risk readings and distorted risk-to-reward values that could previously appear in unusual structural conditions.
Live Trade Protection in Auto Mode
With Auto Trendline enabled, newly formed swing pairs no longer overwrite a trade that is already in progress. An active setup is allowed to run to its conclusion before the engine adopts the next qualifying trendline, so targets and stops are no longer wiped mid-trade.
Refinements
- Touch counting now registers each distinct approach to the trendline once rather than accumulating on every bar spent inside the tolerance band, making the minimum-touch requirement a true measure of validation.
- Pivot-based target derivation is now restricted to structure formed after the anchor point, preventing stale pre-setup levels from influencing target placement.
- The retest window now expires cleanly, so a pending breakout that never receives its retest is released instead of lingering.
- Optional filters are now fully inert when switched off — disabled confirmations no longer evaluate in the background or influence the readings shown on the dashboard.
- Target 2 and Target 3 zones now anchor to the same values reported everywhere else, eliminating minor boundary mismatches in the all-targets display.
- Anchor point labels now follow the configured label text colour instead of a fixed colour, so custom themes stay visually consistent.
- All numeric inputs now carry sensible upper limits, preventing extreme entries that could stall loading or produce unusable output.
- Substantial performance work throughout: the dashboard renders only when needed, the trendline updates in place rather than being rebuilt each bar, drawing-object usage was reduced significantly, and internal scanning routines now exit as soon as a result is determined. Loading is noticeably faster and far lighter on chart resources.
Notas de Lançamento
Trendline Breakouts Targets Pro — Update SummaryMajor Improvements
- Signals on the breakout bar — Breakouts are now confirmed and marked on the bar that actually closes through the trendline, removing the one-bar delay of the previous version. Entry, stop and targets are anchored to that same bar.
- New trade-level display — The shaded target and stop zones are replaced by clean Entry, Stop and Target lines, each with a price label at the right edge. Levels that land on the same price share one label instead of overlapping.
- Stop confirmed on close — The stop now registers only when a candle closes beyond it, not when a wick merely touches it, reducing premature stop-outs from intrabar spikes.
- Real-time target alerts — Target hits now alert the moment price reaches the level instead of waiting for the bar to close.
- Redesigned dashboard — A compact header with symbol and timeframe, alternating row shading, highlighted warning rows, and a dedicated Pass / Fail row for every filter you enable, so you can see exactly which condition is holding a setup back.
New Features
- Pine Screener columns — The indicator now feeds the Pine Screener with Direction, Bars Since Signal, Entry, Stop, TP1, TP2, TP3, Targets Hit and Trade Active, which you add from the screener's Manage columns menu. The columns show the same trade levels its alerts send. The Pine Screener is available on TradingView Premium and Ultimate plans only and calculates on the most recent 500 bars.
- Trail Stop modes — Choose how the stop behaves once targets are reached: stay where it was placed, move to breakeven after Target 1, or step up behind price after each target.
- Lock Signal — Freezes the current signal and its levels and blocks new ones, so an active trade plan cannot be replaced while you manage it.
- Partial close webhook actions — New Partial Close Long and Partial Close Short action words. A target that is not your last enabled one now sends a partial close, and only the final target or the stop sends a full close.
- Separate BUY and SELL alerts — The single breakout alert is now split into BUY Signal and SELL Signal, so long and short entries can be routed independently.
- Symbols without volume — Volume-based filters are now skipped on symbols that report no volume instead of blocking every signal, and the dashboard says so.
- Setting tooltips — Every setting now carries a short explanation of what it does.
Refinements
- Stop behaviour after targets — The stop no longer trails automatically by default. Select the step-up Trail Stop mode to keep the previous behaviour. Break-Even After T1 now applies to that mode only.
- Target chain — Target 3 now requires Target 2, and the trade ends at the last target you enabled. Disabled targets are sent as empty values in webhooks instead of a price.
- Manual trendline anchors — Point labels appear once the anchor swing is confirmed and no longer shift afterwards. A clear error now appears when End Date is earlier than Start Date, and the dashboard flags an anchor placed before the loaded chart history.
- Filters row accuracy — The dashboard Filters verdict now follows Confluence Score Mode when it is on.
- Clearer readings — R:R, Touches, RVOL and Regime are shown as values instead of progress bars. HTF Bias now shows its timeframe and reports when it is skipped.
- Level lines — Trade lines follow the live bar while the trade is open and stop extending once it closes.
- Breakout markers — Markers now read BULL and BEAR.
- Settings panel — Target 2 and Target 3 moved to Trade Tools, the target line extension moved to Visuals, and the colour scheme for targets, stop and dashboard header was refreshed. The custom-label and all-targets display modes and the Middle Right dashboard position were retired in favour of the new level display.
Performance
- Fewer drawing objects per trade and the trendline is redrawn only when it actually changes, for a lighter, smoother chart.
How to Use
- Entry, Stop and Target labels — Each shows the level and its price while pending. When a level is hit it switches to a HIT label with the move from entry as a percentage.
- Lock row — ACTIVE means the current signal is frozen and new signals are blocked.
- Filter rows — One row per enabled filter, reading Pass or Fail on the current bar.
- Target Basis / Stop Basis — Swing means the level is built from market structure; Fallback range means no qualifying swing was available.
- Line, Point 1, Point 2, Slope, Retest — The trendline's current value, its two anchors, its steepness, and whether a break is waiting for a retest.
- Highlighted rows — A shaded row warns that a setting was skipped or data is missing.
Settings Reset Notice
This update changes the settings panel, so your saved settings for this indicator will return to their defaults. Please re-enter them after updating. Settings affected include: Show Target 2, Show Target 3, Extend target line (bars), Position, Target 1 Color, Target 2 Color, Target 3 Color, Stop Loss Color, Dash Header, plus the new Lock Signal, Trail Stop, Partial Close Long Action, Partial Close Short Action, Entry Color and Dash Warning Row. Existing alerts should also be recreated.
Notas de Lançamento
Trendline Breakouts Targets Pro — Update SummaryMajor Improvements
- Rebuilt Higher-Timeframe Bias Filter — The HTF Bias Filter now follows the direction of the indicator's own most recent confirmed trendline breakout on the higher timeframe, using your current settings, instead of a generic moving-average reading. Your breakout is only accepted when the higher timeframe agrees with it. The separate moving-average length setting has been removed.
- Stable Swings and Anchors — Swing points and the Point 2 anchor now only lock in on confirmed bars, so the trendline, the anchor labels and the setup no longer shift while a live bar is still forming.
- Realistic Retest Entries — With Retest Confirmation on, the entry is now priced at the close of the bar that confirms the retest, and the reward-to-risk shown on the dashboard and in alerts is measured from that entry. A target can no longer be counted as hit on the same bar the retest entry opens.
- Trade Level Safety Check — A breakout is now rejected when its stop or targets would land on the wrong side of the entry, at an impossible price, or with a risk too small to trade, so every signal comes with usable levels.
- Fairer Confluence Score — A filter that does not have enough data yet (still warming up, no volume, no swing found yet) now sits out of the score instead of counting as a failure. When no enabled filter carries any weight, the breakout no longer passes automatically.
New Features
- Swing-Based Manual Anchor — In manual mode, Point 1 must now fall on a confirmed swing high or low. If the chosen date is not a swing, no trendline is drawn and the dashboard tells you to pick a swing date.
- Friendly Date Warnings — Choosing two dates on the same bar, or a Point 2 earlier than Point 1, no longer stops the indicator with an error. The dashboard shows a warning, no new setup is evaluated, and any open trade keeps being tracked.
- Standard Chart Notice — On Heikin Ashi, Renko and other synthetic chart types, the indicator now shows a clear on-chart notice asking you to switch to candles, instead of failing with an error.
- Auto-Corrected Limits — If a minimum slope or minimum volatility ratio is set above its maximum, the two are swapped automatically and the dashboard says so.
- Snap Swings Row — When Snap TP to Structure is on, the dashboard shows how many confirmed swings are available for snapping and flags when the stored list is full.
- Warnings Stay Visible — With the dashboard turned off, a compact panel still appears whenever there is something to fix or a filter is being skipped.
Refinements
- Session Filter on Daily Charts — On daily and higher timeframes the session filter is now skipped, passes every signal and sits out of the score, and the dashboard marks it as skipped.
- Min R:R Gate — The reward-to-risk gate is now judged on the original first target, before Snap TP to Structure moves it.
- Touch Counting — A touch of the trendline on the breakout bar itself no longer counts toward the required touches.
- Cleaner Dashboard — Rows for touches, relative volume, volatility regime, higher-timeframe bias and session now appear only when their setting is on. Pass and Fail results are now colour-coded, and the overall Filters result is coloured too.
- Helpful Tooltips — Hovering over several dashboard rows now explains how much history they need before they show a value, and notes when a symbol reports tick volume.
- Single-Target Label — When only one target is active, its label now reads Target instead of TP1.
- Tick-Accurate Levels — Entry, stop and target prices are now rounded to the symbol's tick size on the chart, the dashboard and in alerts.
- Webhook Accuracy — The entry alert now always carries the stop exactly as it stood at entry, and custom action words containing quotes or backslashes are now sent safely instead of being stripped.
- Clearer Settings Panel — Tooltips now explain when each filter is skipped or sits out of the confluence score, and decorative icons were removed from the Lock Signal setting.
Performance
- Filters that are switched off are no longer calculated, so the indicator does less work on every bar.
- The trendline and anchor labels are now drawn once on the latest bar, and the indicator keeps less price history in memory.
How to Use
- Point 1 Anchor row — Appears in manual mode when your start date is not on a swing high or low. Pick a start date that falls on a swing to draw the trendline.
- Date Pair row — Appears when the two dates are on the same bar or in the wrong order. No new setup is evaluated until it is fixed.
- Slope Limits and Regime Limits rows — Appear when a minimum was set above its maximum and the values were swapped for you.
- Snap Swings row — Shows how many swings Snap TP to Structure can use. A highlighted row means the list is full and the oldest swings are being dropped.
- Green and red results — On the dashboard, green means a filter passes and red means it fails.
- On-chart notice — A centred message means the chart type is not supported. Switch to candles.
Settings Reset Notice
Saved settings will return to their defaults after this update, so please re-enter your preferred values once you have updated.

💡 Proprietary indicators. Original research. Built by analysts who trade.
📢 Free Telegram: t.me/MarkitTick_Updates
👑 Premium: TradingView Marketplace
📘 Guides: markittick.com
📢 Free Telegram: t.me/MarkitTick_Updates
👑 Premium: TradingView Marketplace
📘 Guides: markittick.com
Aviso legal
As informações e publicações não se destinam a ser, e não constituem, conselhos ou recomendações financeiras, de investimento, comerciais ou de outro tipo fornecidos ou endossados pela TradingView. Leia mais nos Termos de Uso.
💡 Proprietary indicators. Original research. Built by analysts who trade.
📢 Free Telegram: t.me/MarkitTick_Updates
👑 Premium: TradingView Marketplace
📘 Guides: markittick.com
📢 Free Telegram: t.me/MarkitTick_Updates
👑 Premium: TradingView Marketplace
📘 Guides: markittick.com
Aviso legal
As informações e publicações não se destinam a ser, e não constituem, conselhos ou recomendações financeiras, de investimento, comerciais ou de outro tipo fornecidos ou endossados pela TradingView. Leia mais nos Termos de Uso.