10Y Rel CAGR - Growth vs Value (Total Return)
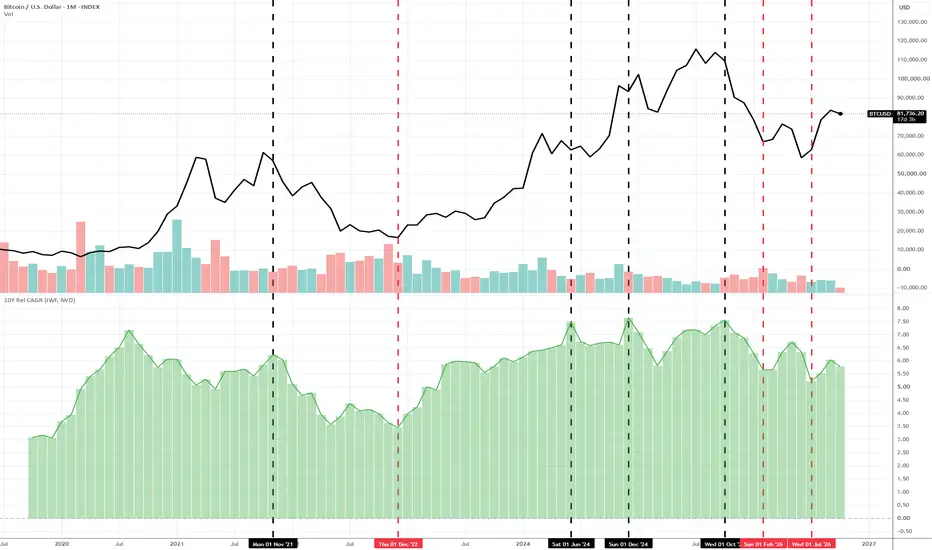
10-YEAR RELATIVE CAGR: GROWTH VS VALUE (TOTAL RETURN)
OVERVIEW
This indicator measures the rolling 10-year Compound Annual Growth Rate (CAGR) performance spread between Large Cap Growth and Large Cap Value.
Standard price charts frequently distort long-term comparisons because Value equities typically distribute substantially higher dividend yields than Growth equities. This script resolves that discrepancy by programmatically enforcing dividend adjustments directly in the underlying data feed, delivering an accurate rolling comparison of compound total returns over a 10-year investment horizon.
HOW TO USE THIS INDICATOR TO INVEST
1. IDENTIFYING SECULAR CYCLE ROTATIONS
Equities historically rotate between secular Growth regimes (low-rate, disinflationary, tech-driven expansions) and Value regimes (higher-rate, resource-driven, or multiple-compression cycles). Use this indicator to evaluate where the market sits within these multi-year macro waves:
* Historical Extremes: Extended peaks in the positive green zone highlight periods where Growth outperformance has stretched far above historical norms (resembling conditions in 1999–2000 or the mid-2020s AI run). These peaks warn that Growth valuations may face mean reversion.
* Troughs and Floors: Deep troughs in the red zone reveal periods where Value has dominated or where Growth has significantly underperformed, often setting up entry windows for high-beta and growth assets.
2. PORTFOLIO REBALANCING TRIGGERS
Long-term investors and asset allocators can use extreme readings to execute systematic rebalancing:
* Trimming Overextended Growth: When the 10-year annualized spread reaches historical extremes above the zero line, trim over-allocated Growth positions and reallocate capital into discounted Value, dividend-paying defensives, or small-cap value.
* Re-accumulating Growth: When the indicator reaches cycle lows or turns upward from negative territory, systematically rotate back into high-growth leaders.
3. CONFIRMING MACRO REGIME SHIFTS
Watch the momentum slope of the histogram columns. A rollover from cycle peaks—even while still above zero—often precedes broad index multiple compression and leadership rotation under the surface into unmagnificent, low-multiple equities.
RECOMMENDED TIMEFRAMES
* MONTHLY (1M) - STRONGLY RECOMMENDED
Calculates based on 120 monthly bars (10 calendar years). This is the optimal timeframe for macro investors, eliminating daily noise and presenting clean secular cycles.
* WEEKLY (1W)
Calculates based on 522 weekly bars. Useful for identifying tactical turns and rolling momentum changes several months before they register on monthly closes.
* DAILY (1D)
Calculates based on 2,520 daily bars. Requires an active TradingView subscription tier that supports sufficient historical daily data bars for 10-year calculations.
Note: Do not run this indicator on intraday charts (such as 1H, 15m, or 5m). Intraday data history cannot deliver 10 continuous calendar years of bars, and the script will intentionally output blank values.
HOW TO CONFIGURE SETTINGS
Open the indicator Settings window via the gear icon to adjust parameters:
* GROWTH TICKER
Default: AMEX:IWF (iShares Russell 1000 Growth ETF)
Alternative inputs:
* AMEX:SPYG (SPDR S&P 500 Growth ETF)
* AMEX:IVW (iShares S&P 500 Growth ETF)
* AMEX:MGK (Vanguard Mega Cap Growth ETF)
* AMEX:IWO (iShares Russell 2000 Growth ETF - for small-cap analysis)
* VALUE TICKER
Default: AMEX:IWD (iShares Russell 1000 Value ETF)
Alternative inputs:
* AMEX:SPYV (SPDR S&P 500 Value ETF)
* AMEX:IVE (iShares S&P 500 Value ETF)
* AMEX:MGV (Vanguard Mega Cap Value ETF)
* AMEX:IWN (iShares Russell 2000 Value ETF - for small-cap analysis)
* AUTOMATIC TOTAL RETURN ADJUSTMENT
The code natively applies dividend adjustment logic to both ticker inputs. You do not need to manually toggle the "ADJ" button on your main chart pane.
READING THE DISPLAY
* ZERO BASELINE (DASHED LINE)
Represents exact parity. At zero, Large Cap Growth and Large Cap Value generated identical compound annual total returns over the trailing 10-year window.
* POSITIVE VALUES (GREEN HISTOGRAM / LINE)
Growth outperformed Value over the trailing decade. A reading of +4.0% indicates that Growth generated a compound annual total return 4.0 percentage points higher than Value each year for the past 10 years.
* NEGATIVE VALUES (RED HISTOGRAM / LINE)
Value outperformed Growth over the trailing decade on a total-return, dividend-reinvested basis.
OVERVIEW
This indicator measures the rolling 10-year Compound Annual Growth Rate (CAGR) performance spread between Large Cap Growth and Large Cap Value.
Standard price charts frequently distort long-term comparisons because Value equities typically distribute substantially higher dividend yields than Growth equities. This script resolves that discrepancy by programmatically enforcing dividend adjustments directly in the underlying data feed, delivering an accurate rolling comparison of compound total returns over a 10-year investment horizon.
HOW TO USE THIS INDICATOR TO INVEST
1. IDENTIFYING SECULAR CYCLE ROTATIONS
Equities historically rotate between secular Growth regimes (low-rate, disinflationary, tech-driven expansions) and Value regimes (higher-rate, resource-driven, or multiple-compression cycles). Use this indicator to evaluate where the market sits within these multi-year macro waves:
* Historical Extremes: Extended peaks in the positive green zone highlight periods where Growth outperformance has stretched far above historical norms (resembling conditions in 1999–2000 or the mid-2020s AI run). These peaks warn that Growth valuations may face mean reversion.
* Troughs and Floors: Deep troughs in the red zone reveal periods where Value has dominated or where Growth has significantly underperformed, often setting up entry windows for high-beta and growth assets.
2. PORTFOLIO REBALANCING TRIGGERS
Long-term investors and asset allocators can use extreme readings to execute systematic rebalancing:
* Trimming Overextended Growth: When the 10-year annualized spread reaches historical extremes above the zero line, trim over-allocated Growth positions and reallocate capital into discounted Value, dividend-paying defensives, or small-cap value.
* Re-accumulating Growth: When the indicator reaches cycle lows or turns upward from negative territory, systematically rotate back into high-growth leaders.
3. CONFIRMING MACRO REGIME SHIFTS
Watch the momentum slope of the histogram columns. A rollover from cycle peaks—even while still above zero—often precedes broad index multiple compression and leadership rotation under the surface into unmagnificent, low-multiple equities.
RECOMMENDED TIMEFRAMES
* MONTHLY (1M) - STRONGLY RECOMMENDED
Calculates based on 120 monthly bars (10 calendar years). This is the optimal timeframe for macro investors, eliminating daily noise and presenting clean secular cycles.
* WEEKLY (1W)
Calculates based on 522 weekly bars. Useful for identifying tactical turns and rolling momentum changes several months before they register on monthly closes.
* DAILY (1D)
Calculates based on 2,520 daily bars. Requires an active TradingView subscription tier that supports sufficient historical daily data bars for 10-year calculations.
Note: Do not run this indicator on intraday charts (such as 1H, 15m, or 5m). Intraday data history cannot deliver 10 continuous calendar years of bars, and the script will intentionally output blank values.
HOW TO CONFIGURE SETTINGS
Open the indicator Settings window via the gear icon to adjust parameters:
* GROWTH TICKER
Default: AMEX:IWF (iShares Russell 1000 Growth ETF)
Alternative inputs:
* AMEX:SPYG (SPDR S&P 500 Growth ETF)
* AMEX:IVW (iShares S&P 500 Growth ETF)
* AMEX:MGK (Vanguard Mega Cap Growth ETF)
* AMEX:IWO (iShares Russell 2000 Growth ETF - for small-cap analysis)
* VALUE TICKER
Default: AMEX:IWD (iShares Russell 1000 Value ETF)
Alternative inputs:
* AMEX:SPYV (SPDR S&P 500 Value ETF)
* AMEX:IVE (iShares S&P 500 Value ETF)
* AMEX:MGV (Vanguard Mega Cap Value ETF)
* AMEX:IWN (iShares Russell 2000 Value ETF - for small-cap analysis)
* AUTOMATIC TOTAL RETURN ADJUSTMENT
The code natively applies dividend adjustment logic to both ticker inputs. You do not need to manually toggle the "ADJ" button on your main chart pane.
READING THE DISPLAY
* ZERO BASELINE (DASHED LINE)
Represents exact parity. At zero, Large Cap Growth and Large Cap Value generated identical compound annual total returns over the trailing 10-year window.
* POSITIVE VALUES (GREEN HISTOGRAM / LINE)
Growth outperformed Value over the trailing decade. A reading of +4.0% indicates that Growth generated a compound annual total return 4.0 percentage points higher than Value each year for the past 10 years.
* NEGATIVE VALUES (RED HISTOGRAM / LINE)
Value outperformed Growth over the trailing decade on a total-return, dividend-reinvested basis.

Aviso legal
As informações e publicações não se destinam a ser, e não constituem, conselhos ou recomendações financeiras, de investimento, comerciais ou de outro tipo fornecidos ou endossados pela TradingView. Leia mais nos Termos de Uso.
Aviso legal
As informações e publicações não se destinam a ser, e não constituem, conselhos ou recomendações financeiras, de investimento, comerciais ou de outro tipo fornecidos ou endossados pela TradingView. Leia mais nos Termos de Uso.