OPEN-SOURCE SCRIPT
Previous Day Breakout Indicator
Strategy Breakdown
1.Previous Day Levels: The strategy uses request.security to look up the previous day's high and low prices.
2.Entry Conditions: To trigger an entry, the strategy checks if the current 5-minute bar and the previous 5-minute bar have both closed beyond the previous day's level (either above the high or below the low). To ensure we only enter precisely on the second bar, we check that the bar 2 bars ago did not close beyond the level.
3.Risk Management: Once in a position, the strategy relies on strategy.exit, utilizing the profit and loss parameters which accept points/ticks.
4.Visuals: The previous day's high and low are plotted on your chart for easy visual reference.
I've tightened the logic in the editor to guarantee that the strategy only looks at the previous day's levels and that the breakout explicitly originates from inside the previous day's range.
The entry condition now strictly requires:
1.The candle 2 bars ago was inside the previous day's range (meaning the breakout is fresh).
2.The previous candle (Bar 1) broke out and closed beyond the Previous Day High/Low.
3.The current candle (Bar 2) also closed beyond the Previous Day High/Low.
The strategy doesn't look at any other levels, support/resistance, or indicators.
What I added:
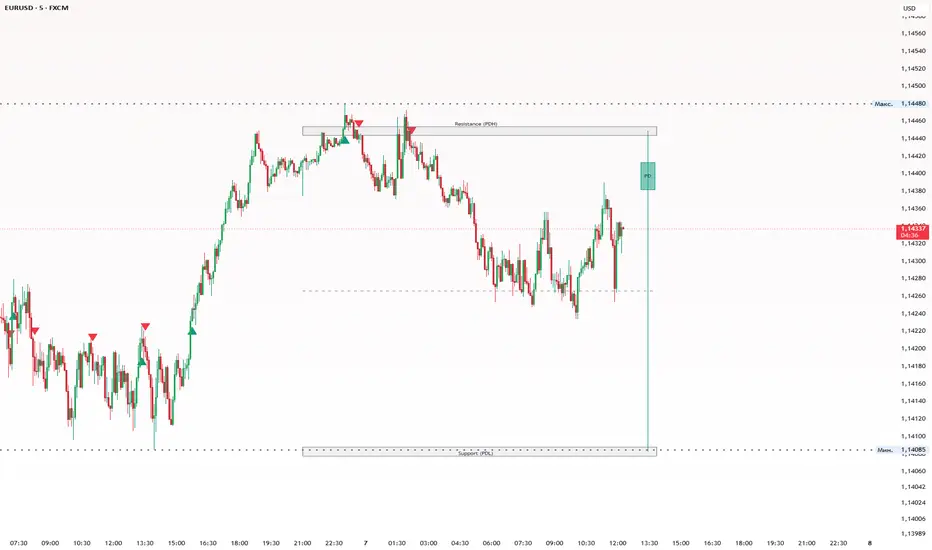
Projected Daily Candle: The script now constructs a visual representation of the Previous Day's candle (complete with the high/low wicks and the open/close body) and projects it to the right of your current price action.
It updates dynamically on the very last bar.
You can control exactly how far ahead it gets drawn via the "Candle Projection Offset (Bars)" input in the settings.
Continuous Levels: The Previous Day High and Low are continuously plotted as solid lines across the chart so you always know where those exact levels sit.
Entry Signals: Since this is now an indicator and not a strategy, I added plotshape() triangles to visualize the exact moments when your 2-bar breakout entry logic fires. Green triangles appear below the bar for Long setups, and red triangles appear above the bar for Short setups.
What's Changed:
1.Support & Resistance Zones: Instead of basic continuous lines, the Previous Day High and Low are now drawn as gray horizontal boxes spanning from the start of the current day extending out into the future, creating support and resistance "zones".
2.Text Labels: I added the Resistance (PDH) and Support (PDL) text labels directly above and below their respective zones, matching the image.
3.Midpoint Dashed Line: A dashed gray line now automatically calculates the exact center between the high and low (pdH + pdL) / 2 and runs horizontally through the entire daily range.
2.Candle Body Box: Instead of a thick line, the body of the projected candle is now constructed using a box with the text "PD" directly in the center, and the wick is a single vertical line running through it.
Now, the indicator will print a signal any time the price crosses and closes beyond either level for two consecutive bars, regardless of direction.
Specifically:
Long Signals (Green Triangle Up): Trigger if price breaks and holds above the Previous Day High OR if price breaks and holds above the Previous Day Low (e.g., crossing back up into the daily range).
Short Signals (Red Triangle Down): Trigger if price breaks and holds below the Previous Day Low OR if price breaks and holds below the Previous Day High (e.g., crossing back down into the daily range, as you highlighted with the red arrow in your image).
This effectively allows you to trade both the true breakouts and the fakeouts/reversions back inside the range! Check out the chart and let me know if those signals align perfectly with what you had in mind.
How it works now:
I added a new setting in the indicator's input menu called "Signal on Bar #". You can now choose exactly how many consecutive closes must happen beyond the line before the triangle signal prints.
Set to 1: The signal triggers immediately on the very first candle that closes outside the Previous Day High/Low.
Set to 2: (Your original request) The signal waits for two consecutive candles to close outside the level.
Set to 3 or 4: The script demands even more confirmation, waiting for 3 or 4 consecutive candles to close beyond the level without dipping back across it.
If the price dips back inside the range before your chosen number of bars completes, the count resets, preventing false signals. You can tweak this setting right from the gear icon to see how it filters the trades on your chart!
Script de código aberto
Em verdadeiro espírito do TradingView, o criador deste script o tornou de código aberto, para que os traders possam revisar e verificar sua funcionalidade. Parabéns ao autor! Embora você possa usá-lo gratuitamente, lembre-se de que a republicação do código está sujeita às nossas Regras da Casa.

Aviso legal
As informações e publicações não se destinam a ser, e não constituem, conselhos ou recomendações financeiras, de investimento, comerciais ou de outro tipo fornecidos ou endossados pela TradingView. Leia mais nos Termos de Uso.
Script de código aberto
Em verdadeiro espírito do TradingView, o criador deste script o tornou de código aberto, para que os traders possam revisar e verificar sua funcionalidade. Parabéns ao autor! Embora você possa usá-lo gratuitamente, lembre-se de que a republicação do código está sujeita às nossas Regras da Casa.
Aviso legal
As informações e publicações não se destinam a ser, e não constituem, conselhos ou recomendações financeiras, de investimento, comerciais ou de outro tipo fornecidos ou endossados pela TradingView. Leia mais nos Termos de Uso.