OPEN-SOURCE SCRIPT
Kelly Criterion Curve
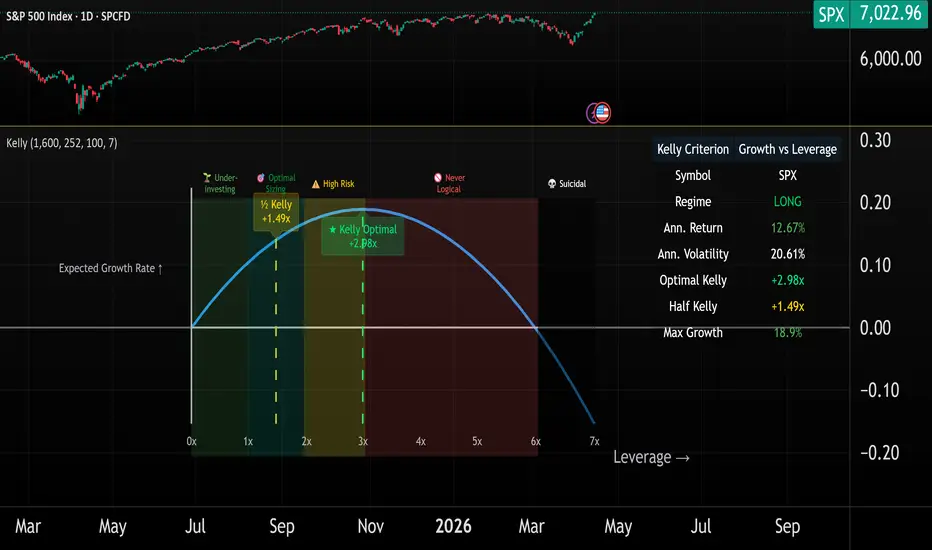
The Kelly Criterion Curve indicator gives you the leverage/return tradeoff by displaying a bell curve with growth and leverage. This indicator shows where you are on the risk curve depending your allocation/leverage used and the optimal leverage to use in any asset.
What Does It Show?
The indicator plots the Kelly growth function:
g(f) = μ·f - 0.5·σ²·f²
Where:
The curve peaks at the Optimal Kelly leverage (full Kelly) and then declines, showing that:
The curve is dynamically divided into zones based on your asset's return profile:
Position Markers
Settings for Kelly Calculation
How to Use
IMPORTANT
The indicator is based on past returns and volatility. It CANNOT predict:
If you use Optimal Kelly and suddenly there's a crash, you are toasted.
Remember leverage amplifies gains and losses
The Kelly Criterion was developed by John L. Kelly Jr. in 1956 for information theory and later adapted for gambling (card counting for example, pioneered by Edward O. Thorp), and investing.
Optimal Leverage:
f* = μ / σ²
Expected Growth Function:
g(f) = μ·f - 0.5·σ²·f²
This is a quadratic function that forms the bell curve you see on the chart.
This indicator pairs perfectly with my other indicators:
Kelly Optimal Leverage Indicator
Jensen's Inequality + Kelly Leverage
Multi-Leverage VAR/VaG Indicator
For deeper insights on Kelly Criterion and optimal leverage:
Read my article: Unlock the Power of Monte Carlo
Read these papers:
Alpha Generation and Risk Smoothing using Managed Volatility
Leverage for the Long Run - A Systematic Approach to Managing Risk and Magnifying Returns in Stocks
Trading with leverage involves substantial risk of loss.
The Kelly Criterion provides a theoretical framework - actual trading requires additional risk management, market analysis, and psychological discipline.
Some examples of using the Kelly Criterion Curve:
Russel 2000, last 500 days Kelly curve

Here's you can see that the optimal sizing over the last 500 days would have been around 1.7x leverage and that full Kelly is 3.4x leverage.
While Russel 2000 returned 16%, full Kelly would have returned 27.8%, and more that full Kelly (3.4x leverage) would lower the returns.
Berkshire Hathaway, last 1000 days Kelly curve

BRK stock optimal Kelly (full Kelly) is 2.5x for the last 1000 trading days. To reduce volatility, one could use 1/2 Kelly which is 1.25x leverage.
Bitcoin, last 2000 trading days Kelly curve

Very interestingly, the indicator tells us not to leverage Bitcoin. Even a 2x leverage can lead to ruin given its volatility, and in fact, in 2025 many traders got liquidated while leveraging Bitcoin by 2x.
Let me know if you have questions, suggestions and comments.
- Henrique Centieiro
What Does It Show?
The indicator plots the Kelly growth function:
g(f) = μ·f - 0.5·σ²·f²
Where:
- g(f) = Expected growth rate at leverage f
- μ = Annualized return
- σ = Annualized volatility
- f = Leverage multiplier
The curve peaks at the Optimal Kelly leverage (full Kelly) and then declines, showing that:
- Too little leverage = underutilized capital
- Too much leverage = volatility drag destroys returns
The curve is dynamically divided into zones based on your asset's return profile:
- Underinvesting (Green) - Too conservative, underutilized capital
- Optimal Sizing (Teal) - Sweet spot for position sizing
- High Risk (Yellow) - Diminishing returns, high volatility drag
- Never Logical (Red) - Risk outweighs reward
- Suicidal (Black) - Negative expected returns
Position Markers
- ★ Kelly Optimal (Green/Red) - Maximum long-term log growth leverage
- ½ Kelly (Yellow) - Conservative sizing (recommended most times)
Settings for Kelly Calculation
- Lookback Period - Historical data window for calculations (default: 252 = 1 year)
- Annual Trading Days - For annualization (default: 252)
- Use Log Returns - More accurate for compounding (recommended: ON)
- Curve Smoothness (20-200) - Number of points on curve (default: 100)
- Maximum Leverage Display (2-10x) - X-axis range
- Show Short Positions - Display negative leverage for short strategies. Note the chart is not fully optimized for shorts.
- Show Optimal Kelly Marker - Mark optimal leverage on curve
- Show Half Kelly Marker - Mark conservative leverage
How to Use
- Look at Optimal Kelly - This is the theoretical maximum for the period analyzed
- Use Half Kelly for conservative sizing
- Check which risk zone your position falls into
- If your leverage is in the High Risk zone → Consider reducing
- If you're in Never Logical or Suicidal → I wish you good luck because you will need a lot
- If you're in Underinvesting → You may be too conservative
IMPORTANT
The indicator is based on past returns and volatility. It CANNOT predict:
- Market crashes
- Regime changes
- Black swan events
If you use Optimal Kelly and suddenly there's a crash, you are toasted.
- Full Kelly maximizes long-term growth but can experience large drawdowns
- Most traders use ¼ to ½ Kelly for risk management
- You should almost never use full Kelly, unless you are extremely confident
Remember leverage amplifies gains and losses
- Notice how Max Growth isn't simply Ann. Return × Leverage
- The formula accounts for volatility drag (the cost of using leverage)
- Higher volatility = lower optimal leverage
The Kelly Criterion was developed by John L. Kelly Jr. in 1956 for information theory and later adapted for gambling (card counting for example, pioneered by Edward O. Thorp), and investing.
Optimal Leverage:
f* = μ / σ²
Expected Growth Function:
g(f) = μ·f - 0.5·σ²·f²
This is a quadratic function that forms the bell curve you see on the chart.
This indicator pairs perfectly with my other indicators:
Kelly Optimal Leverage Indicator
Jensen's Inequality + Kelly Leverage
Multi-Leverage VAR/VaG Indicator
For deeper insights on Kelly Criterion and optimal leverage:
Read my article: Unlock the Power of Monte Carlo
Read these papers:
Alpha Generation and Risk Smoothing using Managed Volatility
Leverage for the Long Run - A Systematic Approach to Managing Risk and Magnifying Returns in Stocks
Trading with leverage involves substantial risk of loss.
The Kelly Criterion provides a theoretical framework - actual trading requires additional risk management, market analysis, and psychological discipline.
Some examples of using the Kelly Criterion Curve:
Russel 2000, last 500 days Kelly curve
Here's you can see that the optimal sizing over the last 500 days would have been around 1.7x leverage and that full Kelly is 3.4x leverage.
While Russel 2000 returned 16%, full Kelly would have returned 27.8%, and more that full Kelly (3.4x leverage) would lower the returns.
Berkshire Hathaway, last 1000 days Kelly curve
BRK stock optimal Kelly (full Kelly) is 2.5x for the last 1000 trading days. To reduce volatility, one could use 1/2 Kelly which is 1.25x leverage.
Bitcoin, last 2000 trading days Kelly curve
Very interestingly, the indicator tells us not to leverage Bitcoin. Even a 2x leverage can lead to ruin given its volatility, and in fact, in 2025 many traders got liquidated while leveraging Bitcoin by 2x.
Let me know if you have questions, suggestions and comments.
- Henrique Centieiro
Script de código aberto
Em verdadeiro espírito do TradingView, o criador deste script o tornou de código aberto, para que os traders possam revisar e verificar sua funcionalidade. Parabéns ao autor! Embora você possa usá-lo gratuitamente, lembre-se de que a republicação do código está sujeita às nossas Regras da Casa.

Hedge Fund Manager at Maverick Capital | Wealth Educator | 20+ yrs investing | Stocks, ETFs & Crypto alerts | Join Henrique Wealth Academy for trade alerts & indicators → skool.com/be-limitless/
Aviso legal
As informações e publicações não se destinam a ser, e não constituem, conselhos ou recomendações financeiras, de investimento, comerciais ou de outro tipo fornecidos ou endossados pela TradingView. Leia mais nos Termos de Uso.
Script de código aberto
Em verdadeiro espírito do TradingView, o criador deste script o tornou de código aberto, para que os traders possam revisar e verificar sua funcionalidade. Parabéns ao autor! Embora você possa usá-lo gratuitamente, lembre-se de que a republicação do código está sujeita às nossas Regras da Casa.
Hedge Fund Manager at Maverick Capital | Wealth Educator | 20+ yrs investing | Stocks, ETFs & Crypto alerts | Join Henrique Wealth Academy for trade alerts & indicators → skool.com/be-limitless/
Aviso legal
As informações e publicações não se destinam a ser, e não constituem, conselhos ou recomendações financeiras, de investimento, comerciais ou de outro tipo fornecidos ou endossados pela TradingView. Leia mais nos Termos de Uso.