OPEN-SOURCE SCRIPT
Meridian Flow [WillyAlgoTrader]
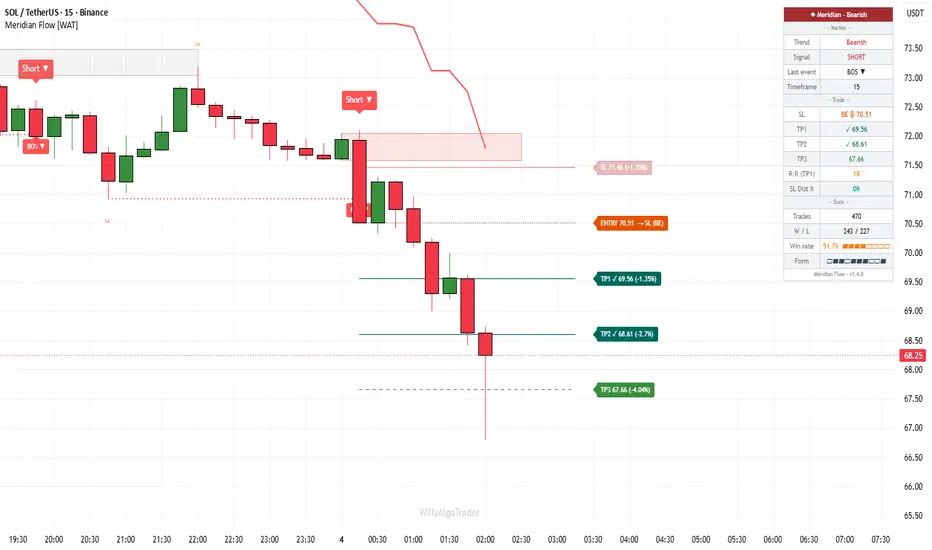
🧭 Meridian Flow is an overlay Smart-Money toolkit that reads market structure the way an institutional trader does — detecting confirmed swing points, classifying every break as a BOS (trend continuation) or a CHoCH (trend reversal), drawing the order block each break leaves behind, and then turning that signal into a complete trade plan with ATR-based stop-loss, three take-profits, automatic break-even, and a live performance dashboard — all on one chart, with zero manual drawing.
The core idea: most "SMC" tools just paint boxes and labels and leave you to figure out the rest. Meridian Flow closes the loop. It does not stop at "here is a break" — it answers where to enter, where the stop goes, where the targets are, when to move to break-even, and how the setup has performed. Structure detection, order-block tracking, a higher-timeframe bias filter, a full risk engine, a structure-anchored trend line, and a sectioned dashboard are wired into a single pipeline so each part feeds the next.
It works on any market and any timeframe — forex, crypto, stocks, indices, futures — because every component is built from price action and ATR, not from instrument-specific assumptions.
🧩 WHY THESE COMPONENTS WORK TOGETHER
A raw BOS/CHoCH labeler tells you structure broke, but not whether to trust the break, where the institutional zone is, or how to manage risk once you're in. An order-block tool draws zones but has no concept of trade management. A risk calculator needs an entry it can't generate on its own. Used separately, you're constantly stitching three or four tools together by hand.
Meridian Flow fuses them into one chain:
Confirmed swing detection → HH/HL/LH/LL classification → BOS / CHoCH break engine → HTF bias filter → Order-block creation + mitigation tracking → ATR risk model (SL / TP1-3 / break-even) → Structure-anchored ATR trend line → Live stats & form dashboard → Alerts
The swing engine finds confirmed pivots. Classification tells you whether each new swing extends or contradicts the prior one. The break engine reads the running structure state to decide BOS vs CHoCH — the same state then sets the direction of the trailing trend line, so the line and the labels never disagree. Each qualifying break spawns the order block that produced the move and tracks it until price mitigates it. The HTF filter vetoes breaks that fight the higher timeframe. The risk engine takes the surviving signal and immediately builds entry, stop, and three targets sized in ATR and R-multiples. The dashboard records the outcome and feeds it back to you as a win rate and a recent-form strip.
Without structure classification you can't separate continuations from reversals. Without the running-state logic, BOS and CHoCH blur together. Without order blocks you lose the institutional zone. Without the HTF filter you take every counter-trend poke. Without the risk model a signal is just an arrow. The combination is what turns "structure broke" into a managed, reviewable trade.
🔍 WHAT MAKES IT ORIGINAL
1️⃣ Confirmed swing engine with automatic HH / HL / LH / LL labeling.
Swings are found with symmetric pivots — equal left/right lookback (default Swing Length 13) — so a pivot is only confirmed once enough bars have closed on both sides. Each new high is labeled:
— isHH = (no previous high) OR (pivotHigh >= previousHigh)
— otherwise it is an LH
Each new low is labeled:
— isLL = (no previous low) OR (pivotLow <= previousLow)
— otherwise it is an HL
This gives you an objective, repeatable map of structure instead of subjective lines.
2️⃣ BOS vs CHoCH disambiguation via a running structure-state machine.
The indicator keeps an internal trend state (structTrend = +1 bull, −1 bear, 0 neutral). When a swing high breaks, it reads that state:
— bull break while structTrend >= 0 → BOS ▲ (continuation)
— bull break while structTrend < 0 → CHoCH ▲ (reversal up)
The mirror logic applies to bear breaks. This is why the same break can be a BOS in one context and a CHoCH in another — the label reflects the trend you were already in, not just the candle that broke.
3️⃣ Conflict suppression + warmup guard.
If a bull break and a bear break would register on the very same bar, the bar is flagged a conflict and both are suppressed — no contradictory signals. On top of that, no signal fires until the chart has warmed up:
— WARMUP_BARS = max(Swing Length × 2, 50)
Early-history noise, where pivots aren't yet reliable, is filtered out before a single arrow prints.
4️⃣ Order blocks tied to the break, with displacement detection and an arm→mitigate lifecycle.
When a break creates an OB, the engine scans back up to OB Lookback (default 30) bars for the last opposite candle (for a bullish OB: the last down candle, close < open) and prefers one that was followed by a displacement move out of its range. If no displacement is found, it falls back to the nearest opposite candle.
Every box then runs a lifecycle:
— Armed: price first closes beyond the zone (confirming the OB worked)
— Mitigated: price later returns into the zone (by wick or close, your choice), committed on bar close
Mitigated blocks fade to grey and freeze, or can be removed entirely. The box cap (Max Order Blocks, default 8) always drops mitigated zones first, so live zones stay on the chart longest.
5️⃣ Non-repainting higher-timeframe bias filter.
An EMA (default 50) is computed on a higher timeframe (default 60-minute) and read with a one-bar offset on confirmed values:
— Bullish bias when close >= HTF EMA
— Bearish bias when close <= HTF EMA
When the filter is on, longs are only allowed in a bullish HTF regime and shorts only in a bearish one. Because the HTF value is taken from the already-closed higher-timeframe bar, it does not repaint.
6️⃣ Preset-driven ATR risk model — entry, stop, and three targets in one shot.
Stop distance is volatility-scaled, and targets are placed as multiples of that risk (R):
— slDistance = ATR(SL length, default 13) × SL multiplier
— SL = entry ∓ slDistance
— TP1/TP2/TP3 = entry ± slDistance × (TP1/TP2/TP3 multiplier)
One click selects a full profile (SL ×ATR / TP1 / TP2 / TP3 in R):
— Conservative: 2.5 / 1R / 2R / 4R
— Balanced: 1.5 / 1R / 2R / 3R
— Aggressive: 1.0 / 1.5R / 2.5R / 4R
— Scalping: 0.8 / 0.8R / 1.5R / 2R
— Custom: set every multiplier by hand
Only one position at a time is tracked — no pyramiding, no overlapping clutter.
7️⃣ Break-even-after-TP1 with WIN-on-TP1 accounting.
When TP1 is first touched and break-even is enabled, the stop is moved to the entry price. From the next bar, any wick back to entry closes the trade at break-even — locking out the give-back loss. Crucially, a trade counts as a WIN the moment TP1 is touched, even if it later comes back to the break-even stop. This keeps the win-rate honest about partial profit-taking.
8️⃣ Structure-anchored ATR trend line (SuperTrend-style, but it flips on CHoCH).
A smoothed ATR band trails price, but its direction is not decided by its own crossover logic — it is slaved to the structure state:
— band = hl2 ∓ (ATR Trend Multiplier, default 5) × EMA(ATR(length 10), smoothing 5)
— Bull regime: line trails as max(previous line, lower band)
— Bear regime: line trails as min(previous line, upper band)
— The line flips only when structure flips (a CHoCH), marked with a circle
So your trailing line and your BOS/CHoCH labels always tell the same story.
9️⃣ Session stats engine — win rate gauge + recent-form strip.
The dashboard tallies closed trades, wins, losses, and win rate, rendered with a Unicode block gauge (▰▱). A separate Form strip shows the last 10 outcomes (▰ = win, ▱ = loss, newest on the right), so you can see whether the current settings are in or out of sync with the market at a glance.
🧠 HOW IT WORKS — bar by bar
Step 1 — Detect swings: symmetric pivots confirm a swing high or low and label it HH/HL/LH/LL.
Step 2 — Watch for a break: price closing (or wicking, your choice) beyond the last swing flags a raw break; same-bar conflicts are suppressed.
Step 3 — Classify the break: the running structure state turns the raw break into a BOS or a CHoCH and flips the trend state.
Step 4 — Filter by bias: if the HTF filter is on, the break must agree with the higher-timeframe EMA regime to qualify.
Step 5 — Spawn the order block: the engine finds the originating candle (preferring displacement) and draws the OB zone.
Step 6 — Open the trade: while flat, a qualifying break sets entry, ATR stop, and TP1/TP2/TP3 from the active preset.
Step 7 — Manage it: each bar checks for TP touches and stop hits; TP1 triggers break-even; SL or TP3 closes the trade and books the result.
Step 8 — Track zones: every open OB arms and then mitigates as price interacts with it.
Step 9 — Report: the dashboard updates trend, signal, levels, R:R, win rate, and recent form; alerts fire on close.
📖 HOW TO USE (beginner-friendly)
🎯 Quick start — get running in 5 steps:
1. Add Meridian Flow to any chart, any timeframe. Defaults already work.
2. Look at the dashboard (top-right). The colored header tells you the current trend: green = bullish, red = bearish, blue = neutral.
3. Wait for a Long ▲ or Short ▼ marker to print under/over a candle. That is a new trade signal.
4. Read the colored lines that appear: the dotted line is your entry, the solid red line is your stop-loss, the three dashed lines are TP1, TP2, TP3.
5. Use those exact levels in your broker. The dashboard shows the same numbers in text so you can copy them.
That is the whole loop: signal prints → take the levels → manage to the targets. Everything else below just helps you read and fine-tune it.
👁️ Reading the chart (what every element means):
— 🟢 Long ▲ / 🔴 Short ▼ markers = a trade just opened in that direction.
— BOS ▲/▼ = trend is continuing in the same direction.
— CHoCH ▲/▼ = trend may be reversing — the first sign of a turn.
— HH / HL = higher high / higher low (healthy uptrend). LL / LH = lower low / lower high (healthy downtrend).
— Colored boxes = order blocks (institutional zones). Bright = still active; faded grey = already mitigated (price came back to it).
— Dotted line = entry · solid red = stop-loss · dashed lines = TP1/TP2/TP3. A target turns solid teal with a ✓ once price reaches it.
— Trailing ATR line = quick visual trend; it flips (with a small circle) when structure reverses.
📊 Dashboard fields:
— Trend: current structure direction (Bullish / Bearish / Neutral).
— Signal: LONG, SHORT, or Wait (a new trade only opens when you're flat).
— Last event: the most recent BOS or CHoCH.
— Timeframe: the chart timeframe.
— SL / TP1 / TP2 / TP3: live levels of the open trade (✓ marks targets already hit; "BE @" means the stop moved to break-even).
— R:R (TP1): reward-to-risk to the first target.
— SL Dist %: how far the stop sits from entry as a percentage.
— Trades / W-L / Win rate: this-session performance with a gauge.
— Form: last 10 results, ▰ win · ▱ loss, newest on the right.
🔧 Tuning guide (fix common issues):
— Too many small/noisy signals: raise Swing Length (try 20-30) and set Break Confirmation to "Close".
— Signals feel late: lower Swing Length (5-10) and/or switch Break Confirmation to "Wick".
— Too many counter-trend trades: turn on the HTF Trend Filter.
— Stops too tight / too wide: change the Risk Preset, or use Custom and adjust SL ×ATR.
— Chart too busy: turn off OB labels and the mean line, reduce Max Order Blocks, or enable "Remove OB After Mitigation".
💡 Trading ideas:
— Reversal hunting: set Signal Mode to "CHoCH only" to trade structure turns; pair with an order-block retest for confirmation.
— Trend riding: set Signal Mode to "BOS only" with the HTF filter on to stack with the higher-timeframe direction.
— Zone entries: wait for a fresh OB, then enter on the mitigation tap back into the zone rather than chasing the break.
— Scalping: use the Scalping preset on low timeframes for tight stops and quick 1:1 to 1:2 targets.
— Risk-free runners: keep Break-Even After TP1 on so winners can't turn into losers.
⚙️ KEY SETTINGS REFERENCE
🏗️ Structure:
— Swing Length (default 13): pivot lookback. Lower = more, smaller swings; higher = cleaner.
— Break Confirmation (default Close): Close = fewer fakeouts; Wick = earlier, riskier.
— Signal Mode (default BOS + CHoCH): which events fire trades — CHoCH only / BOS only / both.
— Show HH/HL/LH/LL (default on) · Show BOS / CHoCH (default on).
📦 Order Blocks:
— Show Order Blocks (default on) · Create OB On (default BOS + CHoCH).
— Mitigation Trigger (default Wick): Wick = earlier; Close = stricter.
— Remove OB After Mitigation (default off) · OB Lookback (default 30) · Max Order Blocks (default 8).
— OB Box Transparency (default 85) · Show 50% Mean Line (default off) · Show OB Labels (default off).
🔍 Filters:
— HTF Trend Filter (default off) · HTF Timeframe (default 60) · HTF EMA Length (default 50).
🛡️ Risk Management:
— Risk Preset (default Balanced): Conservative / Balanced / Aggressive / Scalping / Custom.
— ATR Length (SL) (default 13) · SL ×ATR / TP1 / TP2 / TP3 multipliers (Custom mode).
— Show SL/TP Lines (default on) · Show SL/TP Labels (default on) · Show % Distance (default on).
— Break-Even After TP1 (default on) · Entry / SL / TP Line Style.
🎨 Visual:
— Theme (default Auto) · Show Buy/Sell Signals (default on) · Label Font Size (default Small).
— Show ATR Trend Line (default on) · ATR Trend Length (default 10) · Multiplier (default 5.0) · Smoothing (default 5).
— Show Watermark (default on).
📊 Dashboard:
— Show Dashboard (default on) · Position (default Top Right) · toggles for Market / Trade / Stats sections.
🔔 Alerts:
— Webhook JSON Format (default off) · Alert on SL Hit (default on) · Alert on TP / Break-Even (default off) · Alert on OB Mitigation (default off).
🔔 ALERTS
— 🟢 LONG / 🔴 SHORT — entry with ticker, timeframe, price, SL, TP1/TP2/TP3 and R:R.
— 🛑 SL HIT / 🛡️ BE STOP-OUT — stop or break-even stop-out, with entry and stop price.
— 🛡️ BREAK-EVEN — stop moved to entry after TP1.
— 🎯 TP1 / TP2 / TP3 HIT — each target as it is touched.
— 📦 OB MITIGATION — price returns into a bull or bear order block.
All alerts support plain text and JSON webhook output, and fire on bar close (once per bar close).
⚠️ IMPORTANT NOTES
— 🚫 No repainting. Swings use symmetric (equal left/right) pivots, so a pivot is confirmed only after the lookback bars close — the actual swing sits in the past by the Swing Length; the indicator draws forward from that confirmed bar. Breaks, hits, and OB mitigation all commit on bar close (barstate.isconfirmed), the HTF bias reads the already-closed higher-timeframe bar, and alerts fire once per bar close. This is delayed confirmation, not repainting of future values.
— 📐 Confirmation delay is inherent: signals appear after the bar that triggers them closes. This is the cost of avoiding fakeouts.
— ⚖️ Stats are session-based: win rate and the form strip reset when the script reloads or any input changes. They reflect the visible history with current settings, not a guaranteed forward result.
— 📊 "SL Dist %" is the stop distance as a percentage of entry — it is not a position-sizing or account-risk figure. Size your positions with your own risk rules.
— 🛠️ This is a market-structure analysis and trade-planning tool, not an automated trading bot. It detects structure, draws zones, builds stop/target levels, and tracks outcomes — trade decisions remain yours.
— 🌐 Works on all markets and all timeframes. Past performance does not guarantee future results.
— 🆓 Meridian Flow is free to use. Feedback and suggestions are welcome in the comments.
The core idea: most "SMC" tools just paint boxes and labels and leave you to figure out the rest. Meridian Flow closes the loop. It does not stop at "here is a break" — it answers where to enter, where the stop goes, where the targets are, when to move to break-even, and how the setup has performed. Structure detection, order-block tracking, a higher-timeframe bias filter, a full risk engine, a structure-anchored trend line, and a sectioned dashboard are wired into a single pipeline so each part feeds the next.
It works on any market and any timeframe — forex, crypto, stocks, indices, futures — because every component is built from price action and ATR, not from instrument-specific assumptions.
🧩 WHY THESE COMPONENTS WORK TOGETHER
A raw BOS/CHoCH labeler tells you structure broke, but not whether to trust the break, where the institutional zone is, or how to manage risk once you're in. An order-block tool draws zones but has no concept of trade management. A risk calculator needs an entry it can't generate on its own. Used separately, you're constantly stitching three or four tools together by hand.
Meridian Flow fuses them into one chain:
Confirmed swing detection → HH/HL/LH/LL classification → BOS / CHoCH break engine → HTF bias filter → Order-block creation + mitigation tracking → ATR risk model (SL / TP1-3 / break-even) → Structure-anchored ATR trend line → Live stats & form dashboard → Alerts
The swing engine finds confirmed pivots. Classification tells you whether each new swing extends or contradicts the prior one. The break engine reads the running structure state to decide BOS vs CHoCH — the same state then sets the direction of the trailing trend line, so the line and the labels never disagree. Each qualifying break spawns the order block that produced the move and tracks it until price mitigates it. The HTF filter vetoes breaks that fight the higher timeframe. The risk engine takes the surviving signal and immediately builds entry, stop, and three targets sized in ATR and R-multiples. The dashboard records the outcome and feeds it back to you as a win rate and a recent-form strip.
Without structure classification you can't separate continuations from reversals. Without the running-state logic, BOS and CHoCH blur together. Without order blocks you lose the institutional zone. Without the HTF filter you take every counter-trend poke. Without the risk model a signal is just an arrow. The combination is what turns "structure broke" into a managed, reviewable trade.
🔍 WHAT MAKES IT ORIGINAL
1️⃣ Confirmed swing engine with automatic HH / HL / LH / LL labeling.
Swings are found with symmetric pivots — equal left/right lookback (default Swing Length 13) — so a pivot is only confirmed once enough bars have closed on both sides. Each new high is labeled:
— isHH = (no previous high) OR (pivotHigh >= previousHigh)
— otherwise it is an LH
Each new low is labeled:
— isLL = (no previous low) OR (pivotLow <= previousLow)
— otherwise it is an HL
This gives you an objective, repeatable map of structure instead of subjective lines.
2️⃣ BOS vs CHoCH disambiguation via a running structure-state machine.
The indicator keeps an internal trend state (structTrend = +1 bull, −1 bear, 0 neutral). When a swing high breaks, it reads that state:
— bull break while structTrend >= 0 → BOS ▲ (continuation)
— bull break while structTrend < 0 → CHoCH ▲ (reversal up)
The mirror logic applies to bear breaks. This is why the same break can be a BOS in one context and a CHoCH in another — the label reflects the trend you were already in, not just the candle that broke.
3️⃣ Conflict suppression + warmup guard.
If a bull break and a bear break would register on the very same bar, the bar is flagged a conflict and both are suppressed — no contradictory signals. On top of that, no signal fires until the chart has warmed up:
— WARMUP_BARS = max(Swing Length × 2, 50)
Early-history noise, where pivots aren't yet reliable, is filtered out before a single arrow prints.
4️⃣ Order blocks tied to the break, with displacement detection and an arm→mitigate lifecycle.
When a break creates an OB, the engine scans back up to OB Lookback (default 30) bars for the last opposite candle (for a bullish OB: the last down candle, close < open) and prefers one that was followed by a displacement move out of its range. If no displacement is found, it falls back to the nearest opposite candle.
Every box then runs a lifecycle:
— Armed: price first closes beyond the zone (confirming the OB worked)
— Mitigated: price later returns into the zone (by wick or close, your choice), committed on bar close
Mitigated blocks fade to grey and freeze, or can be removed entirely. The box cap (Max Order Blocks, default 8) always drops mitigated zones first, so live zones stay on the chart longest.
5️⃣ Non-repainting higher-timeframe bias filter.
An EMA (default 50) is computed on a higher timeframe (default 60-minute) and read with a one-bar offset on confirmed values:
— Bullish bias when close >= HTF EMA
— Bearish bias when close <= HTF EMA
When the filter is on, longs are only allowed in a bullish HTF regime and shorts only in a bearish one. Because the HTF value is taken from the already-closed higher-timeframe bar, it does not repaint.
6️⃣ Preset-driven ATR risk model — entry, stop, and three targets in one shot.
Stop distance is volatility-scaled, and targets are placed as multiples of that risk (R):
— slDistance = ATR(SL length, default 13) × SL multiplier
— SL = entry ∓ slDistance
— TP1/TP2/TP3 = entry ± slDistance × (TP1/TP2/TP3 multiplier)
One click selects a full profile (SL ×ATR / TP1 / TP2 / TP3 in R):
— Conservative: 2.5 / 1R / 2R / 4R
— Balanced: 1.5 / 1R / 2R / 3R
— Aggressive: 1.0 / 1.5R / 2.5R / 4R
— Scalping: 0.8 / 0.8R / 1.5R / 2R
— Custom: set every multiplier by hand
Only one position at a time is tracked — no pyramiding, no overlapping clutter.
7️⃣ Break-even-after-TP1 with WIN-on-TP1 accounting.
When TP1 is first touched and break-even is enabled, the stop is moved to the entry price. From the next bar, any wick back to entry closes the trade at break-even — locking out the give-back loss. Crucially, a trade counts as a WIN the moment TP1 is touched, even if it later comes back to the break-even stop. This keeps the win-rate honest about partial profit-taking.
8️⃣ Structure-anchored ATR trend line (SuperTrend-style, but it flips on CHoCH).
A smoothed ATR band trails price, but its direction is not decided by its own crossover logic — it is slaved to the structure state:
— band = hl2 ∓ (ATR Trend Multiplier, default 5) × EMA(ATR(length 10), smoothing 5)
— Bull regime: line trails as max(previous line, lower band)
— Bear regime: line trails as min(previous line, upper band)
— The line flips only when structure flips (a CHoCH), marked with a circle
So your trailing line and your BOS/CHoCH labels always tell the same story.
9️⃣ Session stats engine — win rate gauge + recent-form strip.
The dashboard tallies closed trades, wins, losses, and win rate, rendered with a Unicode block gauge (▰▱). A separate Form strip shows the last 10 outcomes (▰ = win, ▱ = loss, newest on the right), so you can see whether the current settings are in or out of sync with the market at a glance.
🧠 HOW IT WORKS — bar by bar
Step 1 — Detect swings: symmetric pivots confirm a swing high or low and label it HH/HL/LH/LL.
Step 2 — Watch for a break: price closing (or wicking, your choice) beyond the last swing flags a raw break; same-bar conflicts are suppressed.
Step 3 — Classify the break: the running structure state turns the raw break into a BOS or a CHoCH and flips the trend state.
Step 4 — Filter by bias: if the HTF filter is on, the break must agree with the higher-timeframe EMA regime to qualify.
Step 5 — Spawn the order block: the engine finds the originating candle (preferring displacement) and draws the OB zone.
Step 6 — Open the trade: while flat, a qualifying break sets entry, ATR stop, and TP1/TP2/TP3 from the active preset.
Step 7 — Manage it: each bar checks for TP touches and stop hits; TP1 triggers break-even; SL or TP3 closes the trade and books the result.
Step 8 — Track zones: every open OB arms and then mitigates as price interacts with it.
Step 9 — Report: the dashboard updates trend, signal, levels, R:R, win rate, and recent form; alerts fire on close.
📖 HOW TO USE (beginner-friendly)
🎯 Quick start — get running in 5 steps:
1. Add Meridian Flow to any chart, any timeframe. Defaults already work.
2. Look at the dashboard (top-right). The colored header tells you the current trend: green = bullish, red = bearish, blue = neutral.
3. Wait for a Long ▲ or Short ▼ marker to print under/over a candle. That is a new trade signal.
4. Read the colored lines that appear: the dotted line is your entry, the solid red line is your stop-loss, the three dashed lines are TP1, TP2, TP3.
5. Use those exact levels in your broker. The dashboard shows the same numbers in text so you can copy them.
That is the whole loop: signal prints → take the levels → manage to the targets. Everything else below just helps you read and fine-tune it.
👁️ Reading the chart (what every element means):
— 🟢 Long ▲ / 🔴 Short ▼ markers = a trade just opened in that direction.
— BOS ▲/▼ = trend is continuing in the same direction.
— CHoCH ▲/▼ = trend may be reversing — the first sign of a turn.
— HH / HL = higher high / higher low (healthy uptrend). LL / LH = lower low / lower high (healthy downtrend).
— Colored boxes = order blocks (institutional zones). Bright = still active; faded grey = already mitigated (price came back to it).
— Dotted line = entry · solid red = stop-loss · dashed lines = TP1/TP2/TP3. A target turns solid teal with a ✓ once price reaches it.
— Trailing ATR line = quick visual trend; it flips (with a small circle) when structure reverses.
📊 Dashboard fields:
— Trend: current structure direction (Bullish / Bearish / Neutral).
— Signal: LONG, SHORT, or Wait (a new trade only opens when you're flat).
— Last event: the most recent BOS or CHoCH.
— Timeframe: the chart timeframe.
— SL / TP1 / TP2 / TP3: live levels of the open trade (✓ marks targets already hit; "BE @" means the stop moved to break-even).
— R:R (TP1): reward-to-risk to the first target.
— SL Dist %: how far the stop sits from entry as a percentage.
— Trades / W-L / Win rate: this-session performance with a gauge.
— Form: last 10 results, ▰ win · ▱ loss, newest on the right.
🔧 Tuning guide (fix common issues):
— Too many small/noisy signals: raise Swing Length (try 20-30) and set Break Confirmation to "Close".
— Signals feel late: lower Swing Length (5-10) and/or switch Break Confirmation to "Wick".
— Too many counter-trend trades: turn on the HTF Trend Filter.
— Stops too tight / too wide: change the Risk Preset, or use Custom and adjust SL ×ATR.
— Chart too busy: turn off OB labels and the mean line, reduce Max Order Blocks, or enable "Remove OB After Mitigation".
💡 Trading ideas:
— Reversal hunting: set Signal Mode to "CHoCH only" to trade structure turns; pair with an order-block retest for confirmation.
— Trend riding: set Signal Mode to "BOS only" with the HTF filter on to stack with the higher-timeframe direction.
— Zone entries: wait for a fresh OB, then enter on the mitigation tap back into the zone rather than chasing the break.
— Scalping: use the Scalping preset on low timeframes for tight stops and quick 1:1 to 1:2 targets.
— Risk-free runners: keep Break-Even After TP1 on so winners can't turn into losers.
⚙️ KEY SETTINGS REFERENCE
🏗️ Structure:
— Swing Length (default 13): pivot lookback. Lower = more, smaller swings; higher = cleaner.
— Break Confirmation (default Close): Close = fewer fakeouts; Wick = earlier, riskier.
— Signal Mode (default BOS + CHoCH): which events fire trades — CHoCH only / BOS only / both.
— Show HH/HL/LH/LL (default on) · Show BOS / CHoCH (default on).
📦 Order Blocks:
— Show Order Blocks (default on) · Create OB On (default BOS + CHoCH).
— Mitigation Trigger (default Wick): Wick = earlier; Close = stricter.
— Remove OB After Mitigation (default off) · OB Lookback (default 30) · Max Order Blocks (default 8).
— OB Box Transparency (default 85) · Show 50% Mean Line (default off) · Show OB Labels (default off).
🔍 Filters:
— HTF Trend Filter (default off) · HTF Timeframe (default 60) · HTF EMA Length (default 50).
🛡️ Risk Management:
— Risk Preset (default Balanced): Conservative / Balanced / Aggressive / Scalping / Custom.
— ATR Length (SL) (default 13) · SL ×ATR / TP1 / TP2 / TP3 multipliers (Custom mode).
— Show SL/TP Lines (default on) · Show SL/TP Labels (default on) · Show % Distance (default on).
— Break-Even After TP1 (default on) · Entry / SL / TP Line Style.
🎨 Visual:
— Theme (default Auto) · Show Buy/Sell Signals (default on) · Label Font Size (default Small).
— Show ATR Trend Line (default on) · ATR Trend Length (default 10) · Multiplier (default 5.0) · Smoothing (default 5).
— Show Watermark (default on).
📊 Dashboard:
— Show Dashboard (default on) · Position (default Top Right) · toggles for Market / Trade / Stats sections.
🔔 Alerts:
— Webhook JSON Format (default off) · Alert on SL Hit (default on) · Alert on TP / Break-Even (default off) · Alert on OB Mitigation (default off).
🔔 ALERTS
— 🟢 LONG / 🔴 SHORT — entry with ticker, timeframe, price, SL, TP1/TP2/TP3 and R:R.
— 🛑 SL HIT / 🛡️ BE STOP-OUT — stop or break-even stop-out, with entry and stop price.
— 🛡️ BREAK-EVEN — stop moved to entry after TP1.
— 🎯 TP1 / TP2 / TP3 HIT — each target as it is touched.
— 📦 OB MITIGATION — price returns into a bull or bear order block.
All alerts support plain text and JSON webhook output, and fire on bar close (once per bar close).
⚠️ IMPORTANT NOTES
— 🚫 No repainting. Swings use symmetric (equal left/right) pivots, so a pivot is confirmed only after the lookback bars close — the actual swing sits in the past by the Swing Length; the indicator draws forward from that confirmed bar. Breaks, hits, and OB mitigation all commit on bar close (barstate.isconfirmed), the HTF bias reads the already-closed higher-timeframe bar, and alerts fire once per bar close. This is delayed confirmation, not repainting of future values.
— 📐 Confirmation delay is inherent: signals appear after the bar that triggers them closes. This is the cost of avoiding fakeouts.
— ⚖️ Stats are session-based: win rate and the form strip reset when the script reloads or any input changes. They reflect the visible history with current settings, not a guaranteed forward result.
— 📊 "SL Dist %" is the stop distance as a percentage of entry — it is not a position-sizing or account-risk figure. Size your positions with your own risk rules.
— 🛠️ This is a market-structure analysis and trade-planning tool, not an automated trading bot. It detects structure, draws zones, builds stop/target levels, and tracks outcomes — trade decisions remain yours.
— 🌐 Works on all markets and all timeframes. Past performance does not guarantee future results.
— 🆓 Meridian Flow is free to use. Feedback and suggestions are welcome in the comments.
Script de código aberto
Em verdadeiro espírito do TradingView, o criador deste script o tornou de código aberto, para que os traders possam revisar e verificar sua funcionalidade. Parabéns ao autor! Embora você possa usá-lo gratuitamente, lembre-se de que a republicação do código está sujeita às nossas Regras da Casa.

10 years in trading. For all inquiries, contact me on my Telegram channel: t.me/WillyAlgoTrader or Instagram: @willytraderbtc
Aviso legal
As informações e publicações não se destinam a ser, e não constituem, conselhos ou recomendações financeiras, de investimento, comerciais ou de outro tipo fornecidos ou endossados pela TradingView. Leia mais nos Termos de Uso.
Script de código aberto
Em verdadeiro espírito do TradingView, o criador deste script o tornou de código aberto, para que os traders possam revisar e verificar sua funcionalidade. Parabéns ao autor! Embora você possa usá-lo gratuitamente, lembre-se de que a republicação do código está sujeita às nossas Regras da Casa.
10 years in trading. For all inquiries, contact me on my Telegram channel: t.me/WillyAlgoTrader or Instagram: @willytraderbtc
Aviso legal
As informações e publicações não se destinam a ser, e não constituem, conselhos ou recomendações financeiras, de investimento, comerciais ou de outro tipo fornecidos ou endossados pela TradingView. Leia mais nos Termos de Uso.