Atualizado
RSI T-Bands
Overview
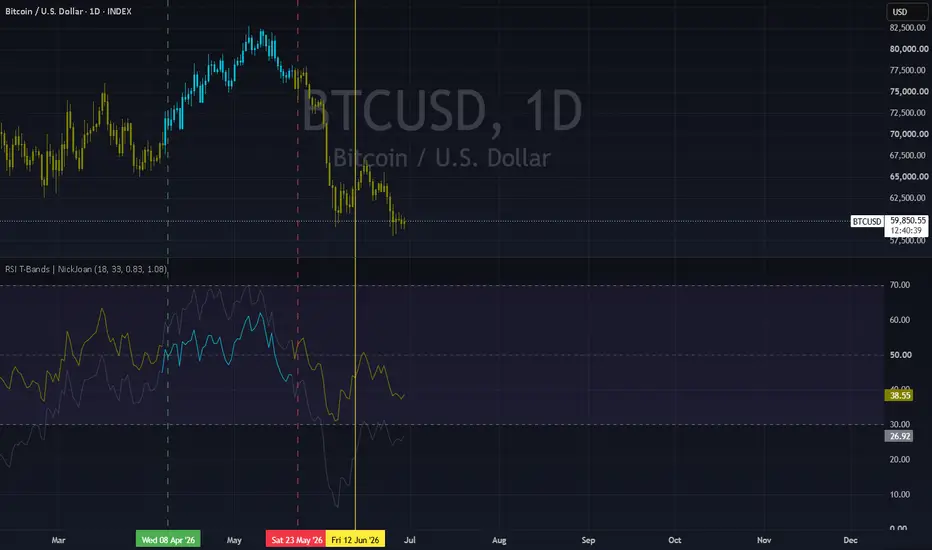
RSI T-Bands is a trend-following indicator that wraps RSI with upper and lower bands built from standard deviation. Instead of treating RSI as a simple overbought/oversold oscillator, it uses the position of these bands relative to the 50 midline to define a bullish or bearish trend state. Bands expand and contract with RSI volatility, making the indicator adaptive to changing momentum conditions.
• Bullish state: begins when the lower RSI band moves above 50.
• Bearish state: begins when the upper RSI band moves below 50
How to use
Candle coloring reflects the current trend state (green = bullish, red = bearish).
The upper and lower RSI bands act as dynamic thresholds around RSI.
The dashed 50 midline is the trend decision boundary.
Alerts
The script includes two alert conditions:
RSI T-Bands Bullish: triggers when the trend state flips from bearish to bullish.
RSI T-Bands Bearish: triggers when the trend state flips from bullish to bearish.
RSI T-Bands is a trend-following indicator that wraps RSI with upper and lower bands built from standard deviation. Instead of treating RSI as a simple overbought/oversold oscillator, it uses the position of these bands relative to the 50 midline to define a bullish or bearish trend state. Bands expand and contract with RSI volatility, making the indicator adaptive to changing momentum conditions.
• Bullish state: begins when the lower RSI band moves above 50.
• Bearish state: begins when the upper RSI band moves below 50
How to use
Candle coloring reflects the current trend state (green = bullish, red = bearish).
The upper and lower RSI bands act as dynamic thresholds around RSI.
The dashed 50 midline is the trend decision boundary.
Alerts
The script includes two alert conditions:
RSI T-Bands Bullish: triggers when the trend state flips from bearish to bullish.
RSI T-Bands Bearish: triggers when the trend state flips from bullish to bearish.
Notas de Lançamento
Added separate upper and lower standard deviation multipliers.Notas de Lançamento
Changed bar coloring.
Aviso legal
As informações e publicações não se destinam a ser, e não constituem, conselhos ou recomendações financeiras, de investimento, comerciais ou de outro tipo fornecidos ou endossados pela TradingView. Leia mais nos Termos de Uso.
Aviso legal
As informações e publicações não se destinam a ser, e não constituem, conselhos ou recomendações financeiras, de investimento, comerciais ou de outro tipo fornecidos ou endossados pela TradingView. Leia mais nos Termos de Uso.