Atualizado
Net Volume (BV-SV) Per Bar / Rolling Toggle (V6) - TP
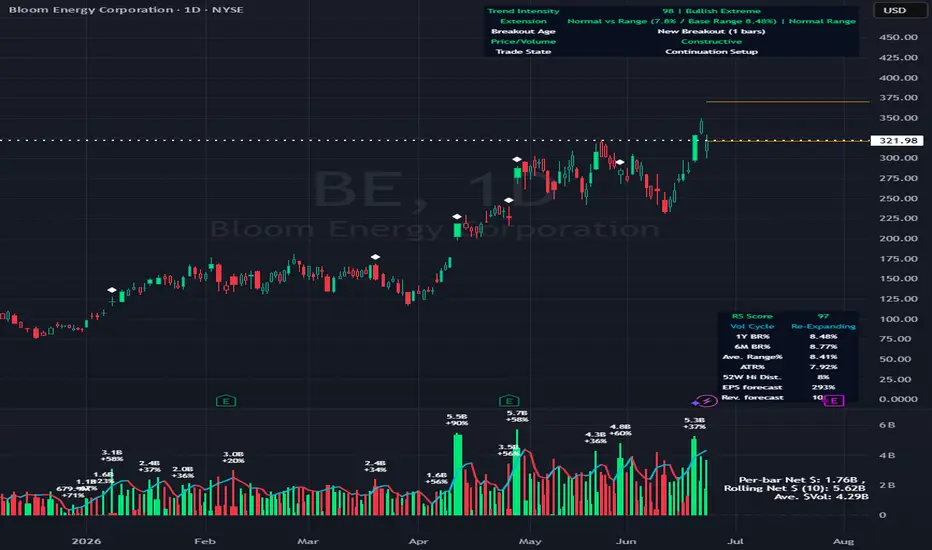
## Net Volume (BV-SV) – Per Bar / Rolling Toggle
This indicator estimates whether a bar (candle) had **more buying pressure or selling pressure**, using only the candle’s **high, low, and close** plus the bar’s **volume**.
It plots:
* **Per-bar Net Volume** (raw, bar-by-bar pressure)
* **Rolling Net Volume** (pressure summed over your chosen lookback, e.g., 20 bars)
* Or **Both**, depending on your Plot Mode.
A **zero line** is included as the “balance point”:
* Above zero = net buying pressure
* Below zero = net selling pressure
---
## How the calculation works (simple explanation)
TradingView does not provide true “buy volume vs sell volume” from the tape for stocks, so this script uses a common estimate:
* If the candle **closes near the high**, it assumes more of the day’s volume was “buying pressure.”
* If the candle **closes near the low**, it assumes more was “selling pressure.”
* If the candle **closes near the middle**, it assumes buying and selling were more balanced.
### Estimated volumes
* **BV (Buy Volume estimate)** = portion of volume attributed to buyers
* **SV (Sell Volume estimate)** = portion of volume attributed to sellers
### Net Volume
* **Net Volume = BV − SV**
* Positive = net buying pressure
* Negative = net selling pressure
### Rolling Net (optional)
Rolling Net simply **adds up Net Volume** over the last *N* bars (lookback):
* Helps you see the *bigger picture* and reduce noise.
---
## How to use it (practical)
### 1) Per-bar Net (most “raw” view)
Use this when you want to see **immediate pressure** each bar.
* **Green / positive** bars/line = buyers controlled that bar
* **Red / negative** bars/line = sellers controlled that bar
* Frequent flips are normal in choppy markets
**Good for:**
* spotting sudden demand/supply spikes
* confirming breakout candles (net turning strongly positive)
* confirming breakdown candles (net turning strongly negative)
### 2) Rolling Net (smoother, trend/flow view)
Use this when you want to know whether the last *N* bars overall show **accumulation or distribution**.
* Staying above zero = buyers dominating over the lookback
* Staying below zero = sellers dominating over the lookback
* Crossing zero = possible shift in control (buyers↔sellers) over that window
**Good for:**
* trend confirmation
* filtering trades (avoid longs when rolling net is deeply negative, etc.)
* spotting transitions after consolidation
### 3) Both (best for confirmation)
Use Both when you want:
* the **rolling line** for overall bias
* the **per-bar line** for timing entries/exits
Example logic:
* Rolling Net above 0 + Per-bar Net flips positive → stronger long confirmation
* Rolling Net below 0 + Per-bar Net flips negative → stronger short/sell confirmation
---
## Inputs / Settings
* **Plot Mode**
* Per-bar Net: raw net volume each bar
* Rolling Net (Σ): summed net over your lookback
* Both: show both lines together
* **Rolling Lookback**
* Default 20 bars (change based on your timeframe)
* **Line Style / Color Options**
* You can color by buy/sell state or pick manual colors and line styles
* **Last-bar Callout**
* Shows the latest values (BV, SV, Net, and/or Rolling Net)
---
## Important notes (limitations)
* This is an **estimate**, not true exchange “buy volume vs sell volume.”
* It works best as a **confirmation tool** alongside price action, trend, and key levels.
* In sideways markets, zero crossings can happen often (whipsaw is normal).
This indicator estimates whether a bar (candle) had **more buying pressure or selling pressure**, using only the candle’s **high, low, and close** plus the bar’s **volume**.
It plots:
* **Per-bar Net Volume** (raw, bar-by-bar pressure)
* **Rolling Net Volume** (pressure summed over your chosen lookback, e.g., 20 bars)
* Or **Both**, depending on your Plot Mode.
A **zero line** is included as the “balance point”:
* Above zero = net buying pressure
* Below zero = net selling pressure
---
## How the calculation works (simple explanation)
TradingView does not provide true “buy volume vs sell volume” from the tape for stocks, so this script uses a common estimate:
* If the candle **closes near the high**, it assumes more of the day’s volume was “buying pressure.”
* If the candle **closes near the low**, it assumes more was “selling pressure.”
* If the candle **closes near the middle**, it assumes buying and selling were more balanced.
### Estimated volumes
* **BV (Buy Volume estimate)** = portion of volume attributed to buyers
* **SV (Sell Volume estimate)** = portion of volume attributed to sellers
### Net Volume
* **Net Volume = BV − SV**
* Positive = net buying pressure
* Negative = net selling pressure
### Rolling Net (optional)
Rolling Net simply **adds up Net Volume** over the last *N* bars (lookback):
* Helps you see the *bigger picture* and reduce noise.
---
## How to use it (practical)
### 1) Per-bar Net (most “raw” view)
Use this when you want to see **immediate pressure** each bar.
* **Green / positive** bars/line = buyers controlled that bar
* **Red / negative** bars/line = sellers controlled that bar
* Frequent flips are normal in choppy markets
**Good for:**
* spotting sudden demand/supply spikes
* confirming breakout candles (net turning strongly positive)
* confirming breakdown candles (net turning strongly negative)
### 2) Rolling Net (smoother, trend/flow view)
Use this when you want to know whether the last *N* bars overall show **accumulation or distribution**.
* Staying above zero = buyers dominating over the lookback
* Staying below zero = sellers dominating over the lookback
* Crossing zero = possible shift in control (buyers↔sellers) over that window
**Good for:**
* trend confirmation
* filtering trades (avoid longs when rolling net is deeply negative, etc.)
* spotting transitions after consolidation
### 3) Both (best for confirmation)
Use Both when you want:
* the **rolling line** for overall bias
* the **per-bar line** for timing entries/exits
Example logic:
* Rolling Net above 0 + Per-bar Net flips positive → stronger long confirmation
* Rolling Net below 0 + Per-bar Net flips negative → stronger short/sell confirmation
---
## Inputs / Settings
* **Plot Mode**
* Per-bar Net: raw net volume each bar
* Rolling Net (Σ): summed net over your lookback
* Both: show both lines together
* **Rolling Lookback**
* Default 20 bars (change based on your timeframe)
* **Line Style / Color Options**
* You can color by buy/sell state or pick manual colors and line styles
* **Last-bar Callout**
* Shows the latest values (BV, SV, Net, and/or Rolling Net)
---
## Important notes (limitations)
* This is an **estimate**, not true exchange “buy volume vs sell volume.”
* It works best as a **confirmation tool** alongside price action, trend, and key levels.
* In sideways markets, zero crossings can happen often (whipsaw is normal).
Notas de Lançamento
Screenshot updated: Per-bar Net Volume is now plotted as a histogram for easier spotting of volume contraction, while the Rolling Net Volume shows the overall buy/sell bias.Notas de Lançamento
Enhanced the last-bar callout to display a clean 2-column readout: Net $ Volume alongside Net Volume (BV−SV). The rolling line now pairs Rolling Net $ (Σ over lookback) with Rolling Net Volume (Σ over the same lookback), keeping the BV/SV logic and lookback fully consistent.Notas de Lançamento
Added a new toggle “Per-bar One-Side (plot |Net|)” that lets you display the per-bar Net $ Volume on a single side of the zero line (using absolute value) for cleaner, apples-to-apples bar comparison. The color still reflects the true buy/sell bias (green for net buying, red for net selling), and the Rolling Net $ Volume plot remains unchanged.Notas de Lançamento
Enhanced the indicator with cleaner visualization controls and added Total Dollar Volume context. You can now (1) force the per-bar Net $ Volume to plot one-sided using |Net|, (2) set the Net $ Volume display to Columns by default, (3) overlay Total $ Volume (Turnover) in the same pane with a Histogram default, colored green/red based on candle direction (close vs open), and (4) add a Total $ Volume moving average (default 10) with dynamic slope coloring (cyan when rising, red when falling). Plot visibility is still controlled via Plot Mode (Per-bar / Rolling / Both).Notas de Lançamento
**Update Log — Net $ Volume / Total $ Volume Enhancements**This update adds new Total $ Volume tools while keeping the original Per-bar Net $ Volume and Rolling Net $ Volume logic intact.
**What’s New**
Added **Peak Total $ Volume Labels**
The script can now mark bars with unusually high Total $ Volume using two detection methods:
1. **Highest $Vol Over Lookback**
Marks the bar if it has the highest Total $ Volume within the selected lookback period.
2. **Extreme $Vol vs Average $Vol**
Marks the bar if the current Total $ Volume is above the selected multiplier of its Average $ Volume.
Default threshold is set to **1.5x**.
Added **Peak Label Display**
Peak Total $ Volume bars now show a text label above the bar with:
* Total $ Volume value
* Percent increase compared to Average $ Volume
Example label:
26.3M
+231%
Added **Average $ Volume Label Reading**
The last-bar label now includes **Ave. $Vol**, based on the selected Total $ Volume moving average.
Added **Separate Display Toggles**
Per-bar Net $ Volume and Rolling Net $ Volume now have separate display controls.
* Per-bar Net $ Volume is ON by default
* Rolling Net $ Volume line is OFF by default
* Rolling Net $ Volume reading still appears in the last-bar label even when the line is hidden
**Improved Label Information**
The last-bar label now displays:
* Per-bar Net $
* Rolling Net $
* Ave. $Vol
This gives a cleaner view of both current bar pressure and rolling pressure without requiring all lines to be plotted on the chart.
**Notes**
Total $ Volume is calculated using volume multiplied by the selected price basis.
Net $ Volume estimates buying and selling pressure based on where the candle closes within its high-low range.
This update is intended to help users better identify high-participation bars and compare them with net buying or selling pressure.

Aviso legal
As informações e publicações não se destinam a ser, e não constituem, conselhos ou recomendações financeiras, de investimento, comerciais ou de outro tipo fornecidos ou endossados pela TradingView. Leia mais nos Termos de Uso.
Aviso legal
As informações e publicações não se destinam a ser, e não constituem, conselhos ou recomendações financeiras, de investimento, comerciais ou de outro tipo fornecidos ou endossados pela TradingView. Leia mais nos Termos de Uso.