Breakout & Retest Buy Sell Signals with TP & SL [LunqFX]
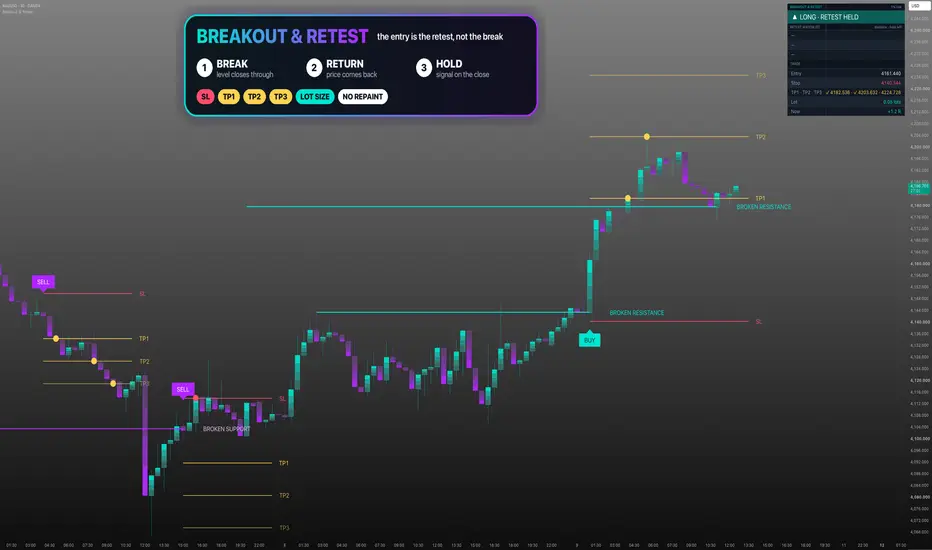
Breakout & Retest prints buy and sell signals when price breaks a support or resistance level and the retest holds — with the stop loss, three take-profit targets and the lot size for your account. Works on forex, gold (XAUUSD), indices and crypto.
A breakout is not the entry. Breaks fail all the time, and buying the breakout candle means buying its most extended price. The trade most price-action traders actually take is the retest: price breaks a level, comes back to it, and the level holds from the other side — old resistance acting as support, old support as resistance. This script is built around that second step. The broken level is drawn as one solid line, named for what it has become — broken resistance or broken support; when price comes back and the level holds on a closed candle, the trade is printed with its stop, three targets and the lot size already measured.
❶ LEVELS
Every confirmed swing high and swing low becomes a level. A new swing that lands within the retest zone of an existing level does not create a duplicate — it adds a touch to that level, so a level tested several times is recognised as one level. The number of levels tracked is limited, the oldest leaving first, so the chart stays clean.
❷ THE BREAK
A level is broken when a candle closes beyond it by at least a small ATR buffer — a close an inch through does not count. The broken level becomes a solid line in the break's colour, labelled BROKEN RESISTANCE or BROKEN SUPPORT, and stays on the chart while the retest is awaited. An optional filter lets only strong breaks lead to signals — a breakout candle with a body of at least one ATR, or volume well above its recent average.
❸ THE RETEST
From the second bar after the break, and only in the direction of the trend — buys while price is above a 200-period EMA, sells while it is below (this filter can be switched off) — a retest needs three things on one closed candle: price comes back into the retest zone, the candle closes back on the breakout's side of the level, and it closes in the breakout's direction. When the retest holds, the level stays on the chart with its trade. If price closes back through the level first, or never returns within the allowed number of bars, the level is removed — the chart keeps only what was traded.
❹ THE PLAN
Entry — the close of the retest candle. Stop — beyond the retest's wick and the level itself, plus an ATR buffer, never tighter than one ATR by default, so a single noisy candle does not end the trade. A retest whose stop would be wider than the maximum is skipped. Targets — TP1, TP2 and TP3 at 1R, 2R and 3R of that stop by default, each adjustable. Lot size — your balance times your risk percentage, divided by what the stop costs per lot, converted from the symbol's currency into your account currency: lots for forex, gold and silver, contracts for futures, units for everything else.
On the chart the plan is kept minimal: a BUY or SELL label on the signal candle and short lines at the stop and the three targets, each named in its colour. Reached levels get a dot on the candle where they were hit. Entry, stop, targets and lot size are listed in the panel. The stop is checked first: when one candle touches both the stop and a target, it is recorded as stopped.
HOW TO USE IT
1 — Set your balance, risk percentage and account currency first. 2 — Watch the retest watchlist in the panel. It lists the latest breaks still waiting for a retest, how far price is from each zone in ATR and how many bars are left — that is where the next entry can come from. 3 — Use the breakout alert to know which chart to open, and the signal alert for the plan itself. 4 — Turn on "Strong breaks only" on fast or noisy markets.
HOW IT WORKS
Levels come from swing pivots confirmed a fixed number of bars after they form, so a level never appears in hindsight. Each level is held in a small store with its price, its touches, its age and its state — waiting, broken up, broken down. On every closed bar the store is walked once: touches are counted, breaks are recorded with whether they were strong, retests are checked against their window and failed breaks are removed. A held retest becomes the plan, and the plan is followed bar by bar until the stop or TP3.
LIMITATIONS
▸ Levels come from confirmed swings, which appear a few bars after the swing itself. A level that formed very recently is not yet tracked. ▸ In tight ranges price can break and return through the same level repeatedly; most of these are removed as failed breaks, but not all. ▸ Fast breakouts that never come back produce no signal by design — the tool trades the retest, not the break. ▸ The trend filter is a moving average: it reacts late at turning points, so the first retests after a reversal can be skipped. ▸ Targets are fixed multiples of the stop and do not look at the next level. ▸ On symbols without volume data, the strong-break filter uses the candle body only. ▸ The lot size is an estimate from TradingView's symbol data. Broker contract sizes, spreads and lot steps are not known to the script — check it before trading. ▸ The dots on reached levels describe individual plans. They are not collected into a win rate, and nothing here is a statement about future results.
WHY IT IS ORIGINAL
Breakout and retest tools usually mark the two events and leave the trade to you. This script treats them as one sequence with explicit rules for each step — what counts as a break, how long a retest may take, what counts as a hold, when a break has failed — takes only retests in the direction of the trend, and turns a held retest into a complete, sized plan that it follows to the end.
It is not a version of my other scripts. Support and Resistance Hold Rate measures how often levels hold; it does not trade their breaks. Trade Planner trades pullbacks to a moving average. This script trades the break and retest of horizontal levels.
SETTINGS
▸ Levels — swing length, levels tracked, retest zone, break buffer, bars allowed for the retest. ▸ Levels — also the trend filter (on/off, EMA length) and the strong-breaks-only filter. ▸ Trade plan — stop buffer, minimum and maximum stop, TP1–TP3 in R, balance, risk %, account currency, units per lot. ▸ Visuals — glow candles in turquoise and violet (one shade deeper on a light chart), unbroken levels on or off, signal and level text size, plans kept on the chart, panel position.
ALERTS — buy and sell (the message carries entry, stop, three targets and the lot size), breakout (a level broke — watch for the retest), targets reached, stop reached. Create them as "Any alert() function call", or use the classic alert conditions.
NON-REPAINTING — levels come from confirmed pivots, and every break, retest, signal, target and stop is decided on a closed bar. A printed signal never moves.
This indicator is an educational tool. It is not financial advice and does not predict price. Always confirm with your own analysis and manage your risk.
A breakout is not the entry. Breaks fail all the time, and buying the breakout candle means buying its most extended price. The trade most price-action traders actually take is the retest: price breaks a level, comes back to it, and the level holds from the other side — old resistance acting as support, old support as resistance. This script is built around that second step. The broken level is drawn as one solid line, named for what it has become — broken resistance or broken support; when price comes back and the level holds on a closed candle, the trade is printed with its stop, three targets and the lot size already measured.
❶ LEVELS
Every confirmed swing high and swing low becomes a level. A new swing that lands within the retest zone of an existing level does not create a duplicate — it adds a touch to that level, so a level tested several times is recognised as one level. The number of levels tracked is limited, the oldest leaving first, so the chart stays clean.
❷ THE BREAK
A level is broken when a candle closes beyond it by at least a small ATR buffer — a close an inch through does not count. The broken level becomes a solid line in the break's colour, labelled BROKEN RESISTANCE or BROKEN SUPPORT, and stays on the chart while the retest is awaited. An optional filter lets only strong breaks lead to signals — a breakout candle with a body of at least one ATR, or volume well above its recent average.
❸ THE RETEST
From the second bar after the break, and only in the direction of the trend — buys while price is above a 200-period EMA, sells while it is below (this filter can be switched off) — a retest needs three things on one closed candle: price comes back into the retest zone, the candle closes back on the breakout's side of the level, and it closes in the breakout's direction. When the retest holds, the level stays on the chart with its trade. If price closes back through the level first, or never returns within the allowed number of bars, the level is removed — the chart keeps only what was traded.
❹ THE PLAN
Entry — the close of the retest candle. Stop — beyond the retest's wick and the level itself, plus an ATR buffer, never tighter than one ATR by default, so a single noisy candle does not end the trade. A retest whose stop would be wider than the maximum is skipped. Targets — TP1, TP2 and TP3 at 1R, 2R and 3R of that stop by default, each adjustable. Lot size — your balance times your risk percentage, divided by what the stop costs per lot, converted from the symbol's currency into your account currency: lots for forex, gold and silver, contracts for futures, units for everything else.
On the chart the plan is kept minimal: a BUY or SELL label on the signal candle and short lines at the stop and the three targets, each named in its colour. Reached levels get a dot on the candle where they were hit. Entry, stop, targets and lot size are listed in the panel. The stop is checked first: when one candle touches both the stop and a target, it is recorded as stopped.
HOW TO USE IT
1 — Set your balance, risk percentage and account currency first. 2 — Watch the retest watchlist in the panel. It lists the latest breaks still waiting for a retest, how far price is from each zone in ATR and how many bars are left — that is where the next entry can come from. 3 — Use the breakout alert to know which chart to open, and the signal alert for the plan itself. 4 — Turn on "Strong breaks only" on fast or noisy markets.
HOW IT WORKS
Levels come from swing pivots confirmed a fixed number of bars after they form, so a level never appears in hindsight. Each level is held in a small store with its price, its touches, its age and its state — waiting, broken up, broken down. On every closed bar the store is walked once: touches are counted, breaks are recorded with whether they were strong, retests are checked against their window and failed breaks are removed. A held retest becomes the plan, and the plan is followed bar by bar until the stop or TP3.
LIMITATIONS
▸ Levels come from confirmed swings, which appear a few bars after the swing itself. A level that formed very recently is not yet tracked. ▸ In tight ranges price can break and return through the same level repeatedly; most of these are removed as failed breaks, but not all. ▸ Fast breakouts that never come back produce no signal by design — the tool trades the retest, not the break. ▸ The trend filter is a moving average: it reacts late at turning points, so the first retests after a reversal can be skipped. ▸ Targets are fixed multiples of the stop and do not look at the next level. ▸ On symbols without volume data, the strong-break filter uses the candle body only. ▸ The lot size is an estimate from TradingView's symbol data. Broker contract sizes, spreads and lot steps are not known to the script — check it before trading. ▸ The dots on reached levels describe individual plans. They are not collected into a win rate, and nothing here is a statement about future results.
WHY IT IS ORIGINAL
Breakout and retest tools usually mark the two events and leave the trade to you. This script treats them as one sequence with explicit rules for each step — what counts as a break, how long a retest may take, what counts as a hold, when a break has failed — takes only retests in the direction of the trend, and turns a held retest into a complete, sized plan that it follows to the end.
It is not a version of my other scripts. Support and Resistance Hold Rate measures how often levels hold; it does not trade their breaks. Trade Planner trades pullbacks to a moving average. This script trades the break and retest of horizontal levels.
SETTINGS
▸ Levels — swing length, levels tracked, retest zone, break buffer, bars allowed for the retest. ▸ Levels — also the trend filter (on/off, EMA length) and the strong-breaks-only filter. ▸ Trade plan — stop buffer, minimum and maximum stop, TP1–TP3 in R, balance, risk %, account currency, units per lot. ▸ Visuals — glow candles in turquoise and violet (one shade deeper on a light chart), unbroken levels on or off, signal and level text size, plans kept on the chart, panel position.
ALERTS — buy and sell (the message carries entry, stop, three targets and the lot size), breakout (a level broke — watch for the retest), targets reached, stop reached. Create them as "Any alert() function call", or use the classic alert conditions.
NON-REPAINTING — levels come from confirmed pivots, and every break, retest, signal, target and stop is decided on a closed bar. A printed signal never moves.
This indicator is an educational tool. It is not financial advice and does not predict price. Always confirm with your own analysis and manage your risk.

Trade setups with clear entry, stop, target and risk logic. Built for traders who want structure, not guessing.
💬 t.me/lunqfx
🌐 lunqfx.com/premium
💬 t.me/lunqfx
🌐 lunqfx.com/premium
Aviso legal
As informações e publicações não se destinam a ser, e não constituem, conselhos ou recomendações financeiras, de investimento, comerciais ou de outro tipo fornecidos ou endossados pela TradingView. Leia mais nos Termos de Uso.
Trade setups with clear entry, stop, target and risk logic. Built for traders who want structure, not guessing.
💬 t.me/lunqfx
🌐 lunqfx.com/premium
💬 t.me/lunqfx
🌐 lunqfx.com/premium
Aviso legal
As informações e publicações não se destinam a ser, e não constituem, conselhos ou recomendações financeiras, de investimento, comerciais ou de outro tipo fornecidos ou endossados pela TradingView. Leia mais nos Termos de Uso.