OPEN-SOURCE SCRIPT
Volume vs MA20 Multiple
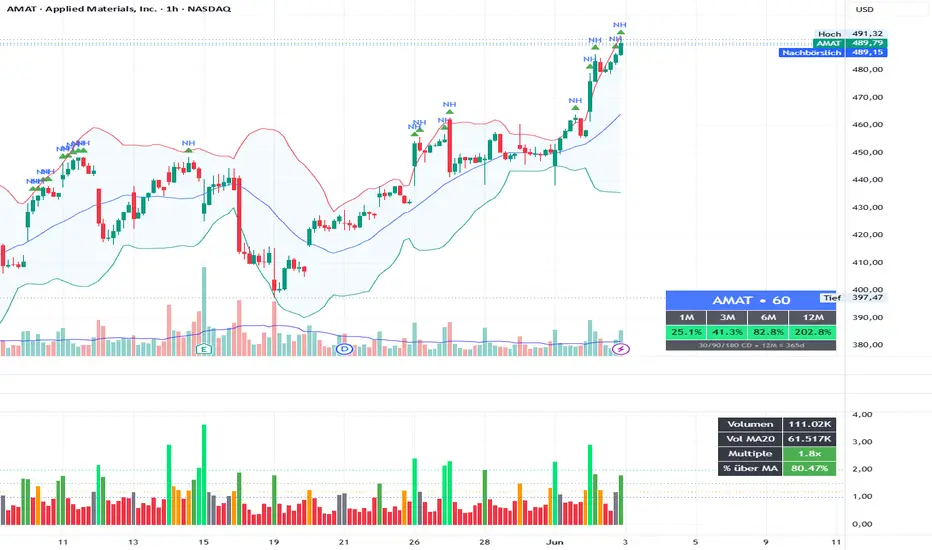
Volume vs MA20 Multiple
This indicator shows how the current candle’s volume compares to its moving average volume.
Instead of only displaying raw volume, it calculates a volume multiple relative to the selected volume moving average, for example:
The default setting uses a 20-period volume moving average, which means:
This makes it easier to judge whether a breakout, reversal, or pullback move is supported by meaningful volume.
How I use it
For breakout trades, I usually want to see price breaking above a key level while volume is clearly above average.
Typical interpretation:
The indicator can display both the multiple and the percentage above the moving average, making it useful for quickly validating whether a price move has real participation behind it.
This indicator is not a standalone buy or sell signal. It is intended to be used together with price action, support/resistance, trend structure, and risk management.
This indicator shows how the current candle’s volume compares to its moving average volume.
Instead of only displaying raw volume, it calculates a volume multiple relative to the selected volume moving average, for example:
- 1.0x = current volume equals the volume moving average
- 1.2x = current volume is 20% above average
- 1.5x = current volume is 50% above average
- 2.0x = current volume is twice the average volume
The default setting uses a 20-period volume moving average, which means:
- on the 1H chart, it compares the current hourly volume to the average of the last 20 hourly candles
- on the daily chart, it compares the current daily volume to the average of the last 20 daily candles
- on any timeframe, it automatically adapts to the selected chart timeframe
This makes it easier to judge whether a breakout, reversal, or pullback move is supported by meaningful volume.
How I use it
For breakout trades, I usually want to see price breaking above a key level while volume is clearly above average.
Typical interpretation:
- Below 1.0x: weak / below-average volume
- Around 1.0x: normal volume
- 1.2x – 1.5x: increased volume, potential confirmation
- 1.5x – 2.0x: strong volume confirmation
- Above 2.0x: very strong participation
The indicator can display both the multiple and the percentage above the moving average, making it useful for quickly validating whether a price move has real participation behind it.
- Best used for
- Breakout confirmation
- Pullback entries
- Reversal setups
- Intraday momentum analysis
- Comparing volume strength across different timeframes
This indicator is not a standalone buy or sell signal. It is intended to be used together with price action, support/resistance, trend structure, and risk management.
Script de código aberto
Em verdadeiro espírito do TradingView, o criador deste script o tornou de código aberto, para que os traders possam revisar e verificar sua funcionalidade. Parabéns ao autor! Embora você possa usá-lo gratuitamente, lembre-se de que a republicação do código está sujeita às nossas Regras da Casa.

Aviso legal
As informações e publicações não se destinam a ser, e não constituem, conselhos ou recomendações financeiras, de investimento, comerciais ou de outro tipo fornecidos ou endossados pela TradingView. Leia mais nos Termos de Uso.
Script de código aberto
Em verdadeiro espírito do TradingView, o criador deste script o tornou de código aberto, para que os traders possam revisar e verificar sua funcionalidade. Parabéns ao autor! Embora você possa usá-lo gratuitamente, lembre-se de que a republicação do código está sujeita às nossas Regras da Casa.
Aviso legal
As informações e publicações não se destinam a ser, e não constituem, conselhos ou recomendações financeiras, de investimento, comerciais ou de outro tipo fornecidos ou endossados pela TradingView. Leia mais nos Termos de Uso.