GreenStar Positioning Heads-Up Display: ATR Ext, RelVol, RelStr
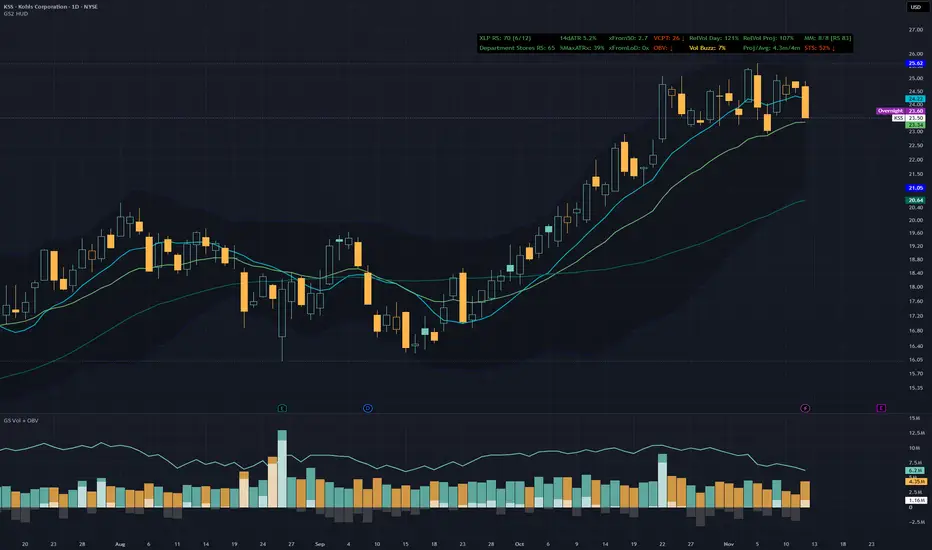
GreenStar Positioning Heads-Up Display (GS2 HUD)
Overlay table for position entry and monitoring. One color-coded HUD covering:
Optional MA lines and Bollinger Bands on the price chart. Hidden plots for TradingView alerts.
Underlying concepts
ATR 14d% is ATR as a percent of price (default 14). Used by Jeff Sun and similar ATR% / extension workflows to compare stretch and distance across names. Also the denominator for xFromMA and xFromLoD.
xFromMA is percent gain from a reference MA divided by ATR%:
Pine Script®
Dollar distance from a 50-day MA does not compare a $15 name to a $400 name. A 3x reading means price is three average daily ranges above the MA. Default reference MA period is 50 (cell label shows xFrom50).
%MaxATRx is current xFromMA as a percent of the highest xFromMA over the lookback (default 120 daily bars ~ 2 quarters). Same formula as the GreenStar ATR & Trend Strength Screener. 100 = at that peak; below 100 = pulled back from peak; above 100 = new extension high.
xFromLoD is distance from the session low in ATR multiples:
Pine Script®
STS (Short Term Strength) measures where the stock's strength vs SPY sits in its own recent history. Ratio = close / SPY close. Score = percentile of that ratio over the last N bars (default 25). STS: 85% means today's ratio beats 85% of the last 25 readings. Not IBD RS and not the MM [RS] bracket. Concept adapted from Jeff Sun's Relative Strength Histogram / RS_STS method.
VCPT scores how contracted recent price action is relative to Average Daily Range % (ADR%). Lower = tighter. Closing-spread and high-low swing over a short lookback are each divided by ADR%, averaged, then normalized 0-100 against a longer baseline. Matches the screener VCPT column. Adapted from the open-source VCP Tightness Score (ADR-adjusted) concept.
Sector / industry relative strength maps the symbol to a sector ETF and industry proxy, then ranks RS vs SPY. Sector also shows rank among 12 sectors.
RelVol Day is cumulative volume from session open to now vs the average cumulative volume at the same clock time (ta.relativeVolume, cumulative). Matches TradingView's Relative Volume at Time indicator in cumulative mode, and the screener's RelVol At Time column.
RelVol Proj / Proj/Avg project the current bar's volume to bar close and compare to a volume MA (default 50).
Vol Buzz is current-bar volume vs its volume MA:
Pine Script®
OBV shows On-Balance Volume direction vs a lookback.
MA stop distances (optional) show how far price sits from each configured MA in percent and ATR multiples, with a thin block glyph in that MA's line color.
Minervini x/8 (MM) applies eight Stage 2 trend-structure rules: price vs key MAs, MA slope and alignment, distance from 52-week extremes, and a weighted price-momentum composite. 8/8 means all eight are true. The [RS xx] bracket next to MM is that momentum composite (not IBD RS, not STS).
Layout modes
Wide + same position (default: Main HUD and RS Block both Top Right): one combined table.
Volume ON (left -> right):
Pine Script®
Volume OFF: RelVol/VolBuzz/Proj columns drop; MM/STS move left; OBV stays under VCPT.
Wide + separate positions: Sector/Industry in their own table; main HUD keeps ATR, extension, VCPT, STS, MM, volume, and optional MA section.
Stacked: single-column vertical list (joined or separate Sector/Industry).
MA Distance and Volume sections can be toggled off to shrink the HUD.
Display sections
Core
MM: 8/8 [RS 90]: Minervini score plus momentum composite in brackets
14dATR: 14-period ATR as % of price (optional dollar ATR)
xFrom50: Extension from reference MA in ATRx (default period 50)
%MaxATRx: Current xFrom / highest over lookback (default 120); pairs under xFrom
xFromLoD: ATR multiples from session low
STS & VCPT
STS: 85% up: Short Term Strength percentile vs SPY + direction vs prior bar
VCPT: 8 down: Tightness score + direction (down = tightening)
VCPT colors: <=10 / <=25 / >25 use HUD Success / Warning / Failure text colors (same as Vol Buzz)
Volume (optional)
RelVol Day: Same-clock cumulative volume pace
RelVol Proj: Projected bar vol vs volume MA (%)
Proj/Avg: Projected / average volume (shares)
Vol Buzz: Current bar vs volume MA (%)
OBV: Direction vs lookback
MA Distance (optional)
Block glyph: thin marker in MA line color (narrow column)
% / gain: MA distance from price and gain from MA (status-colored like ATRx)
ATRx: Same distance in ATR multiples
Sector / Industry
Sector ETF RS vs SPY plus rank among 12 sectors
Industry group RS vs SPY
Color defaults
MM: Green 8/8, Yellow 6-7/8, Red <=5/8
ATR%: Green in configured band (default 5-9%), Yellow band +/- buffer, Red outside
xFromMA: Green <=3.5x, Yellow 3.5-6x, Red >6x
%MaxATRx: Green <=40%, Yellow 40-65%, Red >65%
xFromLoD: Green <50% ATR (0.5x), Yellow <70% ATR (0.7x), Red >=70% ATR
STS: Green >=90%, Yellow 65-89%, Red <65%
VCPT: Success <=10, Warning <=25, Failure >25 (same text colors as Vol Buzz)
Sector RS / Industry RS: Green >=60, Yellow 40-59, Red <40 (rank x/12 is text only)
RelVol Day / Proj: Green >=100%, Yellow >=75%, Red <75%
Vol Buzz: Green >=30%, Yellow -15% to 30%, Red <-15%
Alerts
Hidden plots (display.none, not shown in Style) expose values to TradingView's alert dialog:
Visible MA lines: MA 1, MA 2, MA 3 (Style tab)
Reference MA, ATR $, ATR %, xFromMA, %MaxATRx, xFromLoD
Per-MA ATR %, MA distance %, MA ATRx
STS %, Stock/SPY Ratio, Sector RS, Industry RS
Example: price crossing below MA 2, STS % crossing above 90, xFromMA crossing above 6.
Settings
Layout & Position: Wide/Stacked, Main HUD vs RS Block corners (join/separate), text size, MA/Volume toggles, spacer rows
Minervini Method: Optional failure-detail toggles for warning/fail scores
ATR & Extension: Reference MA, ATR% band, extension thresholds, %MaxATRx lookback (default 120), LoD thresholds, optional ATR $
Moving Averages: Periods/types (default 10 SMA / 21 EMA / 50 SMA), optional MA lines and Bollinger Bands (BB2 on by default for 21 EMA)
Ideal Stop % / ATR Multiple Distance: Color bands for optional MA Distance section
Volume & OBV: Volume MA length, RelVol Day lookback, Vol Buzz thresholds
Sector & Industry: RS rank period
STS & VCP: STS lookback and color floors (default green >=90 / yellow >=65); VCP lookback, ADR length, baseline, and Success/Warning/Failure thresholds (<=10 / <=25 / >25)
Appearance: Single black background for all cells; status text colors
Limitations
Table-based display; values update on the last bar. STS uses request.security(SPY) and follows the chart timeframe. Sector/industry mapping depends on TradingView symbol metadata. Hidden alert plots do not appear on the price pane. Past readings do not predict future price action.
Credits
Minervini trend-template criteria adapted from Minervini Trend Template by yogy.frestarahmawan (Mozilla Public License 2.0).
STS concept adapted from Jeff Sun (jfsrev) Relative Strength Histogram / RS_STS methodology (Stock/SPY ratio percentile vs its own lookback).
VCPT adapted from the open-source VCP Tightness Score (ADR-adjusted) approach (closing and price spreads relative to ADR%, normalized 0-100).
RelVol Day: TradingView ta.relativeVolume built-in, cumulative mode.
Vol Buzz / Avg Vol formulas follow Jeff Sun Swing Data style volume metrics.
Update notes
2026-11-12: Publish readiness; %MaxATRx lookback 120; MA block markers
Indicator title set to GreenStar Positioning Heads-Up Display (shorttitle GS2 HUD). Alert plot titles aligned with HUD labels (xFromMA, Reference MA, MA ATRx). %MaxATRx default lookback set to 120 daily bars (~ 2 quarters), matching the screener. MA Distance uses a narrow block glyph in MA line color instead of solid bgcolor swatches. Label text uses ATRx status color. Wide layout docs updated to the current column order.
2026-08-13: MA block line-color markers
Replaced solid MA bgcolor swatch cells with thin block markers in MA line color; forced narrow column width so the glyph sits next to the MA label.
2026-08-11: xFromLoD color bands
xFromLoD defaults: green < 0.5x ATR (50%), yellow < 0.7x (70%), red >= 0.7x (was <=2x / <=4x).
2026-08-11: %MaxATRx cell; per-MA ATR% hidden
%MaxATRx is its own cell under xFrom (<=40 green / <=65 yellow / >65 red). Same formula as screener. Per-MA ATR% display cells commented out to free the pair slot: calc/plots kept.
2026-08-09: xFromMA thresholds
Default extension bands: green <=3.5x, yellow 3.5-6x, red >6x (was <=5 / 5-7 / >7).
2026-08-08: Layout + VCP/STS thresholds
Sector/Industry join or separate via Main vs RS Block position. STS/VCPT pair with MM on the main grid. STS defaults: green >=90, yellow 65-89, red <65. VCPT uses HUD Success/Warning/Failure text colors like Vol Buzz.
2026-08-06: Alert plots
Added hidden plots for reference MA, ATR/extension, MA distances, and relative-strength series so those values appear in the TradingView alert dialog.
2026-07-26: Minervini momentum lookbacks (daily)
MM [RS xx] bracket and rule 8 use daily quarter lookbacks 63/126/189/252 (was 13/26/39/52). Matches ATR & Trend Strength Screener. Scores may drop by 1 where only short-term momentum passed.
Thanks to jphlong for pointing this out.
2026-07-26: STS and VCPT
Added Short Term Strength (STS) vs SPY and VCPT tightness score with direction arrows. Configurable thresholds under STS & VCP.
Disclaimer
Context and monitoring tool only. Not a signal, not financial advice. No entry or exit triggers. Past metric values do not predict future price action.
Overlay table for position entry and monitoring. One color-coded HUD covering:
- ATR%: volatility as a percent of price
- xFromMA: extension from a reference MA in ATR multiples
- %MaxATRx: current extension vs its lookback peak
- xFromLoD: distance from session low in ATR multiples
- STS: Short Term Strength vs SPY
- VCPT: VCP tightness score
- Sector / industry relative strength
- Volume pace: RelVol Day, RelVol Proj, Vol Buzz, OBV
- Optional MA stop distances
- MM: Minervini trend template
Optional MA lines and Bollinger Bands on the price chart. Hidden plots for TradingView alerts.
Underlying concepts
ATR 14d% is ATR as a percent of price (default 14). Used by Jeff Sun and similar ATR% / extension workflows to compare stretch and distance across names. Also the denominator for xFromMA and xFromLoD.
xFromMA is percent gain from a reference MA divided by ATR%:
Dollar distance from a 50-day MA does not compare a $15 name to a $400 name. A 3x reading means price is three average daily ranges above the MA. Default reference MA period is 50 (cell label shows xFrom50).
%MaxATRx is current xFromMA as a percent of the highest xFromMA over the lookback (default 120 daily bars ~ 2 quarters). Same formula as the GreenStar ATR & Trend Strength Screener. 100 = at that peak; below 100 = pulled back from peak; above 100 = new extension high.
xFromLoD is distance from the session low in ATR multiples:
STS (Short Term Strength) measures where the stock's strength vs SPY sits in its own recent history. Ratio = close / SPY close. Score = percentile of that ratio over the last N bars (default 25). STS: 85% means today's ratio beats 85% of the last 25 readings. Not IBD RS and not the MM [RS] bracket. Concept adapted from Jeff Sun's Relative Strength Histogram / RS_STS method.
VCPT scores how contracted recent price action is relative to Average Daily Range % (ADR%). Lower = tighter. Closing-spread and high-low swing over a short lookback are each divided by ADR%, averaged, then normalized 0-100 against a longer baseline. Matches the screener VCPT column. Adapted from the open-source VCP Tightness Score (ADR-adjusted) concept.
Sector / industry relative strength maps the symbol to a sector ETF and industry proxy, then ranks RS vs SPY. Sector also shows rank among 12 sectors.
RelVol Day is cumulative volume from session open to now vs the average cumulative volume at the same clock time (ta.relativeVolume, cumulative). Matches TradingView's Relative Volume at Time indicator in cumulative mode, and the screener's RelVol At Time column.
RelVol Proj / Proj/Avg project the current bar's volume to bar close and compare to a volume MA (default 50).
Vol Buzz is current-bar volume vs its volume MA:
OBV shows On-Balance Volume direction vs a lookback.
MA stop distances (optional) show how far price sits from each configured MA in percent and ATR multiples, with a thin block glyph in that MA's line color.
Minervini x/8 (MM) applies eight Stage 2 trend-structure rules: price vs key MAs, MA slope and alignment, distance from 52-week extremes, and a weighted price-momentum composite. 8/8 means all eight are true. The [RS xx] bracket next to MM is that momentum composite (not IBD RS, not STS).
Layout modes
Wide + same position (default: Main HUD and RS Block both Top Right): one combined table.
Volume ON (left -> right):
Volume OFF: RelVol/VolBuzz/Proj columns drop; MM/STS move left; OBV stays under VCPT.
Wide + separate positions: Sector/Industry in their own table; main HUD keeps ATR, extension, VCPT, STS, MM, volume, and optional MA section.
Stacked: single-column vertical list (joined or separate Sector/Industry).
MA Distance and Volume sections can be toggled off to shrink the HUD.
Display sections
Core
MM: 8/8 [RS 90]: Minervini score plus momentum composite in brackets
14dATR: 14-period ATR as % of price (optional dollar ATR)
xFrom50: Extension from reference MA in ATRx (default period 50)
%MaxATRx: Current xFrom / highest over lookback (default 120); pairs under xFrom
xFromLoD: ATR multiples from session low
STS & VCPT
STS: 85% up: Short Term Strength percentile vs SPY + direction vs prior bar
VCPT: 8 down: Tightness score + direction (down = tightening)
VCPT colors: <=10 / <=25 / >25 use HUD Success / Warning / Failure text colors (same as Vol Buzz)
Volume (optional)
RelVol Day: Same-clock cumulative volume pace
RelVol Proj: Projected bar vol vs volume MA (%)
Proj/Avg: Projected / average volume (shares)
Vol Buzz: Current bar vs volume MA (%)
OBV: Direction vs lookback
MA Distance (optional)
Block glyph: thin marker in MA line color (narrow column)
% / gain: MA distance from price and gain from MA (status-colored like ATRx)
ATRx: Same distance in ATR multiples
Sector / Industry
Sector ETF RS vs SPY plus rank among 12 sectors
Industry group RS vs SPY
Color defaults
MM: Green 8/8, Yellow 6-7/8, Red <=5/8
ATR%: Green in configured band (default 5-9%), Yellow band +/- buffer, Red outside
xFromMA: Green <=3.5x, Yellow 3.5-6x, Red >6x
%MaxATRx: Green <=40%, Yellow 40-65%, Red >65%
xFromLoD: Green <50% ATR (0.5x), Yellow <70% ATR (0.7x), Red >=70% ATR
STS: Green >=90%, Yellow 65-89%, Red <65%
VCPT: Success <=10, Warning <=25, Failure >25 (same text colors as Vol Buzz)
Sector RS / Industry RS: Green >=60, Yellow 40-59, Red <40 (rank x/12 is text only)
RelVol Day / Proj: Green >=100%, Yellow >=75%, Red <75%
Vol Buzz: Green >=30%, Yellow -15% to 30%, Red <-15%
Alerts
Hidden plots (display.none, not shown in Style) expose values to TradingView's alert dialog:
Visible MA lines: MA 1, MA 2, MA 3 (Style tab)
Reference MA, ATR $, ATR %, xFromMA, %MaxATRx, xFromLoD
Per-MA ATR %, MA distance %, MA ATRx
STS %, Stock/SPY Ratio, Sector RS, Industry RS
Example: price crossing below MA 2, STS % crossing above 90, xFromMA crossing above 6.
Settings
Layout & Position: Wide/Stacked, Main HUD vs RS Block corners (join/separate), text size, MA/Volume toggles, spacer rows
Minervini Method: Optional failure-detail toggles for warning/fail scores
ATR & Extension: Reference MA, ATR% band, extension thresholds, %MaxATRx lookback (default 120), LoD thresholds, optional ATR $
Moving Averages: Periods/types (default 10 SMA / 21 EMA / 50 SMA), optional MA lines and Bollinger Bands (BB2 on by default for 21 EMA)
Ideal Stop % / ATR Multiple Distance: Color bands for optional MA Distance section
Volume & OBV: Volume MA length, RelVol Day lookback, Vol Buzz thresholds
Sector & Industry: RS rank period
STS & VCP: STS lookback and color floors (default green >=90 / yellow >=65); VCP lookback, ADR length, baseline, and Success/Warning/Failure thresholds (<=10 / <=25 / >25)
Appearance: Single black background for all cells; status text colors
Limitations
Table-based display; values update on the last bar. STS uses request.security(SPY) and follows the chart timeframe. Sector/industry mapping depends on TradingView symbol metadata. Hidden alert plots do not appear on the price pane. Past readings do not predict future price action.
Credits
Minervini trend-template criteria adapted from Minervini Trend Template by yogy.frestarahmawan (Mozilla Public License 2.0).
STS concept adapted from Jeff Sun (jfsrev) Relative Strength Histogram / RS_STS methodology (Stock/SPY ratio percentile vs its own lookback).
VCPT adapted from the open-source VCP Tightness Score (ADR-adjusted) approach (closing and price spreads relative to ADR%, normalized 0-100).
RelVol Day: TradingView ta.relativeVolume built-in, cumulative mode.
Vol Buzz / Avg Vol formulas follow Jeff Sun Swing Data style volume metrics.
Update notes
2026-11-12: Publish readiness; %MaxATRx lookback 120; MA block markers
Indicator title set to GreenStar Positioning Heads-Up Display (shorttitle GS2 HUD). Alert plot titles aligned with HUD labels (xFromMA, Reference MA, MA ATRx). %MaxATRx default lookback set to 120 daily bars (~ 2 quarters), matching the screener. MA Distance uses a narrow block glyph in MA line color instead of solid bgcolor swatches. Label text uses ATRx status color. Wide layout docs updated to the current column order.
2026-08-13: MA block line-color markers
Replaced solid MA bgcolor swatch cells with thin block markers in MA line color; forced narrow column width so the glyph sits next to the MA label.
2026-08-11: xFromLoD color bands
xFromLoD defaults: green < 0.5x ATR (50%), yellow < 0.7x (70%), red >= 0.7x (was <=2x / <=4x).
2026-08-11: %MaxATRx cell; per-MA ATR% hidden
%MaxATRx is its own cell under xFrom (<=40 green / <=65 yellow / >65 red). Same formula as screener. Per-MA ATR% display cells commented out to free the pair slot: calc/plots kept.
2026-08-09: xFromMA thresholds
Default extension bands: green <=3.5x, yellow 3.5-6x, red >6x (was <=5 / 5-7 / >7).
2026-08-08: Layout + VCP/STS thresholds
Sector/Industry join or separate via Main vs RS Block position. STS/VCPT pair with MM on the main grid. STS defaults: green >=90, yellow 65-89, red <65. VCPT uses HUD Success/Warning/Failure text colors like Vol Buzz.
2026-08-06: Alert plots
Added hidden plots for reference MA, ATR/extension, MA distances, and relative-strength series so those values appear in the TradingView alert dialog.
2026-07-26: Minervini momentum lookbacks (daily)
MM [RS xx] bracket and rule 8 use daily quarter lookbacks 63/126/189/252 (was 13/26/39/52). Matches ATR & Trend Strength Screener. Scores may drop by 1 where only short-term momentum passed.
Thanks to jphlong for pointing this out.
2026-07-26: STS and VCPT
Added Short Term Strength (STS) vs SPY and VCPT tightness score with direction arrows. Configurable thresholds under STS & VCP.
Disclaimer
Context and monitoring tool only. Not a signal, not financial advice. No entry or exit triggers. Past metric values do not predict future price action.

Aviso legal
As informações e publicações não se destinam a ser, e não constituem, conselhos ou recomendações financeiras, de investimento, comerciais ou de outro tipo fornecidos ou endossados pela TradingView. Leia mais nos Termos de Uso.
Aviso legal
As informações e publicações não se destinam a ser, e não constituem, conselhos ou recomendações financeiras, de investimento, comerciais ou de outro tipo fornecidos ou endossados pela TradingView. Leia mais nos Termos de Uso.