OPEN-SOURCE SCRIPT
Sessions & VP with prev session VP & daily/weekly opens
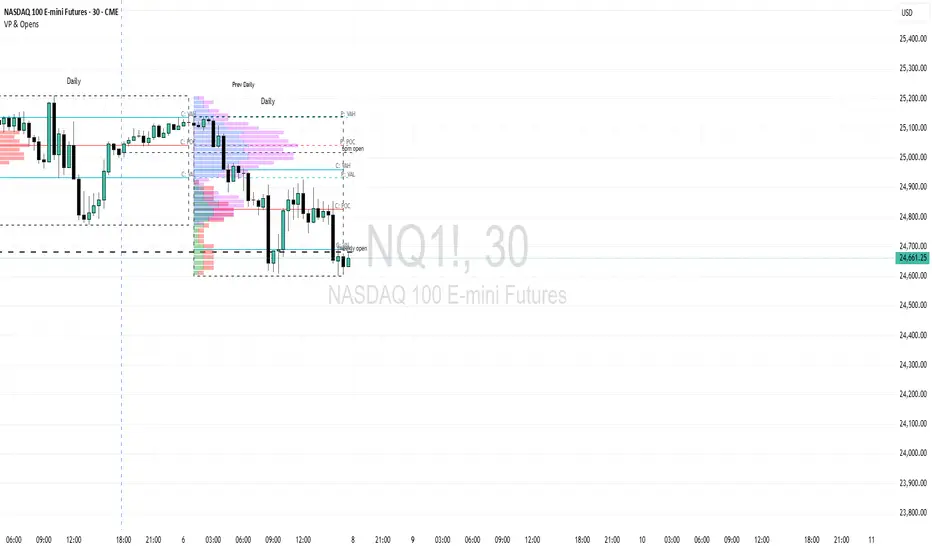
This indicator combines two fully independent volume profile pipelines into a single overlay — one tracking the current session in real time, and one tracking the previous session — along with optional forex session boxes and daily/weekly open levels.
Both volume profiles are built from lower-timeframe intraday bar data (request.security_lower_tf), meaning each profile reflects the true distribution of volume across the session's price range rather than a single-bar approximation. The session range is divided into equal price bins, and each bin's volume is split into bullish and bearish components using a proportional wick/body weighting method. The Point of Control (POC), Value Area High (VAH), and Value Area Low (VAL) are calculated using standard Market Profile methodology.
The previous session VP is displayed as an overlay across the current session's bar range, making it easy to compare where the prior session's volume clustered against current price action without cluttering historical candles.
WHAT IT SHOWS
Current session: a live-updating volume profile drawn across the current session as it builds, with POC, VAH, VAL, and an optional session box.
Previous session overlay: the most recently completed session's volume profile, drawn across the current session's bar range. Levels are prefixed with "P:" to distinguish them from current session levels (prefixed "C:").
Forex session boxes: optional high/low range boxes for the Tokyo, London, and New York sessions. These show the range only — no volume profile is calculated for forex sessions.
Open levels: a 6 PM ET daily open line and a 6 PM Sunday weekly open line, both extending forward from the open price. These mark the start of the futures trading day and trading week respectively, which are commonly used reference levels in US equity index and futures trading.
HOW THE VOLUME PROFILE IS CALCULATED
Each session's price range (high to low) is divided into a user-defined number of equal bins. For every intraday bar within the session, volume is distributed across the bins it touches. Volume is further split into bullish (up-close) and bearish (down-close) by weighting the body and wick portions of each bar separately. This approach gives a more accurate picture of buyer and seller activity at each price level than simply assigning all of a bar's volume to a single bin.
The POC is the bin with the highest total volume. The Value Area expands outward from the POC, adding the next highest adjacent bin on either side, until cumulative volume reaches the user-defined percentage (default 70%).
Three display modes control how the histogram bars are rendered:
- Mode 1: bullish volume only, extending right from the session left edge
- Mode 2: bullish and bearish stacked left-to-right (standard side-by-side view)
- Mode 3: bullish extending right and bearish extending left from the session edge (mirrored)
SETTINGS
--- Current Session ---
Session Type — the period the current session covers. Options: Tokyo, London, New York, Daily, Weekly, Monthly, Quarterly, Yearly.
Show Volume Profile — toggle the histogram bars on/off.
Show POC — toggle the Point of Control line.
Show VAH and VAL — toggle the Value Area boundary lines.
Show Value Area Box — draws a filled rectangle covering the Value Area range.
Show Live Zone — when on, the current session profile updates in real time on every bar. When off, profiles are only drawn for completed sessions.
Show Session Box — draws a dashed outline box around the full session range.
Show Session Label — displays the session type name at the top of the session.
Resolution (default 30, min 5) — number of equal price bins. More bins gives finer detail. Note that each bin uses up to 2 boxes (one green, one red). With 30 bins and both current and previous sessions visible, up to 120 boxes are used, well within TradingView's 500-box limit.
Value Area % (default 70) — percentage of total session volume that defines the Value Area.
Bar Mode — controls the histogram layout. Mode 1 (bulls only), Mode 2 (side-by-side), Mode 3 (mirrored).
Profile Data — Volume uses standard bar volume. Open Interest uses the change in open interest (futures only).
Smooth Volume — applies a 5-period EMA to volume before building the profile.
--- Current Session Appearance ---
Up Volume color — fill color for bullish bins.
Down Volume color — fill color for bearish bins.
Value Area Box color — fill color for the Value Area Box if enabled.
POC, VAH, VAL — line color and thickness for each level.
Box — session box outline color and thickness.
--- Current Level Labels ---
Show Level Labels — toggles the POC/VAH/VAL text labels on/off.
POC Label, VAH Label, VAL Label — customise the text shown next to each level. Current session labels are prefixed "C:".
Label Size — tiny, small, normal, or large.
Label Text color.
--- Previous Session ---
All settings mirror the Current Session group above, with the following differences:
Show Overlay — when on, the previous session's volume profile is drawn across the current session's bar range. When off, no previous session profile is shown.
Previous session level labels are prefixed "P:" to distinguish them from current session levels.
--- Forex Sessions ---
Show Forex Session Boxes — when on, draws high/low range boxes for the Tokyo (midnight-9 UTC), London (7-16 UTC), and New York (13-22 UTC) sessions as each one closes. No volume profile is calculated for these — range only.
--- Open Levels ---
6 PM Daily Open — draws a horizontal line at the open price of the 6 PM ET bar, which marks the start of the US futures trading day. Line color, thickness, and style (solid, dotted, dashed) are configurable. Label toggle included.
Weekly Open (6 PM Sunday) — same as above but fires only on the Sunday 6 PM ET bar, marking the weekly futures open. Independently configurable color, thickness, style, and label.
IMPORTANT NOTES
- Best used on intraday timeframes (1m to 4H) so that lower-timeframe data is available to build accurate profiles. On daily or higher timeframes the profile will use only one bar per session and will be approximate.
- The previous session overlay requires at least two completed sessions of history before it appears.
- The current and previous session types are set independently and can be different (e.g. current = Daily, previous = Weekly).
- Open levels use America/New_York timezone regardless of chart timezone settings.
- Forex session boxes use UTC-based session detection. Results may vary on symbols with non-standard trading hours.
Credits: LeviathanCapital for the excellent market sessions and volume profiles indicator on which this is based
Both volume profiles are built from lower-timeframe intraday bar data (request.security_lower_tf), meaning each profile reflects the true distribution of volume across the session's price range rather than a single-bar approximation. The session range is divided into equal price bins, and each bin's volume is split into bullish and bearish components using a proportional wick/body weighting method. The Point of Control (POC), Value Area High (VAH), and Value Area Low (VAL) are calculated using standard Market Profile methodology.
The previous session VP is displayed as an overlay across the current session's bar range, making it easy to compare where the prior session's volume clustered against current price action without cluttering historical candles.
WHAT IT SHOWS
Current session: a live-updating volume profile drawn across the current session as it builds, with POC, VAH, VAL, and an optional session box.
Previous session overlay: the most recently completed session's volume profile, drawn across the current session's bar range. Levels are prefixed with "P:" to distinguish them from current session levels (prefixed "C:").
Forex session boxes: optional high/low range boxes for the Tokyo, London, and New York sessions. These show the range only — no volume profile is calculated for forex sessions.
Open levels: a 6 PM ET daily open line and a 6 PM Sunday weekly open line, both extending forward from the open price. These mark the start of the futures trading day and trading week respectively, which are commonly used reference levels in US equity index and futures trading.
HOW THE VOLUME PROFILE IS CALCULATED
Each session's price range (high to low) is divided into a user-defined number of equal bins. For every intraday bar within the session, volume is distributed across the bins it touches. Volume is further split into bullish (up-close) and bearish (down-close) by weighting the body and wick portions of each bar separately. This approach gives a more accurate picture of buyer and seller activity at each price level than simply assigning all of a bar's volume to a single bin.
The POC is the bin with the highest total volume. The Value Area expands outward from the POC, adding the next highest adjacent bin on either side, until cumulative volume reaches the user-defined percentage (default 70%).
Three display modes control how the histogram bars are rendered:
- Mode 1: bullish volume only, extending right from the session left edge
- Mode 2: bullish and bearish stacked left-to-right (standard side-by-side view)
- Mode 3: bullish extending right and bearish extending left from the session edge (mirrored)
SETTINGS
--- Current Session ---
Session Type — the period the current session covers. Options: Tokyo, London, New York, Daily, Weekly, Monthly, Quarterly, Yearly.
Show Volume Profile — toggle the histogram bars on/off.
Show POC — toggle the Point of Control line.
Show VAH and VAL — toggle the Value Area boundary lines.
Show Value Area Box — draws a filled rectangle covering the Value Area range.
Show Live Zone — when on, the current session profile updates in real time on every bar. When off, profiles are only drawn for completed sessions.
Show Session Box — draws a dashed outline box around the full session range.
Show Session Label — displays the session type name at the top of the session.
Resolution (default 30, min 5) — number of equal price bins. More bins gives finer detail. Note that each bin uses up to 2 boxes (one green, one red). With 30 bins and both current and previous sessions visible, up to 120 boxes are used, well within TradingView's 500-box limit.
Value Area % (default 70) — percentage of total session volume that defines the Value Area.
Bar Mode — controls the histogram layout. Mode 1 (bulls only), Mode 2 (side-by-side), Mode 3 (mirrored).
Profile Data — Volume uses standard bar volume. Open Interest uses the change in open interest (futures only).
Smooth Volume — applies a 5-period EMA to volume before building the profile.
--- Current Session Appearance ---
Up Volume color — fill color for bullish bins.
Down Volume color — fill color for bearish bins.
Value Area Box color — fill color for the Value Area Box if enabled.
POC, VAH, VAL — line color and thickness for each level.
Box — session box outline color and thickness.
--- Current Level Labels ---
Show Level Labels — toggles the POC/VAH/VAL text labels on/off.
POC Label, VAH Label, VAL Label — customise the text shown next to each level. Current session labels are prefixed "C:".
Label Size — tiny, small, normal, or large.
Label Text color.
--- Previous Session ---
All settings mirror the Current Session group above, with the following differences:
Show Overlay — when on, the previous session's volume profile is drawn across the current session's bar range. When off, no previous session profile is shown.
Previous session level labels are prefixed "P:" to distinguish them from current session levels.
--- Forex Sessions ---
Show Forex Session Boxes — when on, draws high/low range boxes for the Tokyo (midnight-9 UTC), London (7-16 UTC), and New York (13-22 UTC) sessions as each one closes. No volume profile is calculated for these — range only.
--- Open Levels ---
6 PM Daily Open — draws a horizontal line at the open price of the 6 PM ET bar, which marks the start of the US futures trading day. Line color, thickness, and style (solid, dotted, dashed) are configurable. Label toggle included.
Weekly Open (6 PM Sunday) — same as above but fires only on the Sunday 6 PM ET bar, marking the weekly futures open. Independently configurable color, thickness, style, and label.
IMPORTANT NOTES
- Best used on intraday timeframes (1m to 4H) so that lower-timeframe data is available to build accurate profiles. On daily or higher timeframes the profile will use only one bar per session and will be approximate.
- The previous session overlay requires at least two completed sessions of history before it appears.
- The current and previous session types are set independently and can be different (e.g. current = Daily, previous = Weekly).
- Open levels use America/New_York timezone regardless of chart timezone settings.
- Forex session boxes use UTC-based session detection. Results may vary on symbols with non-standard trading hours.
Credits: LeviathanCapital for the excellent market sessions and volume profiles indicator on which this is based
Script de código aberto
Em verdadeiro espírito do TradingView, o criador deste script o tornou de código aberto, para que os traders possam revisar e verificar sua funcionalidade. Parabéns ao autor! Embora você possa usá-lo gratuitamente, lembre-se de que a republicação do código está sujeita às nossas Regras da Casa.

Aviso legal
As informações e publicações não se destinam a ser, e não constituem, conselhos ou recomendações financeiras, de investimento, comerciais ou de outro tipo fornecidos ou endossados pela TradingView. Leia mais nos Termos de Uso.
Script de código aberto
Em verdadeiro espírito do TradingView, o criador deste script o tornou de código aberto, para que os traders possam revisar e verificar sua funcionalidade. Parabéns ao autor! Embora você possa usá-lo gratuitamente, lembre-se de que a republicação do código está sujeita às nossas Regras da Casa.
Aviso legal
As informações e publicações não se destinam a ser, e não constituem, conselhos ou recomendações financeiras, de investimento, comerciais ou de outro tipo fornecidos ou endossados pela TradingView. Leia mais nos Termos de Uso.