[DAOL] Range Pressure
⏺️ What is it?
[DAOL] Range Pressure identifies narrowing price ranges and measures whether recent closing prices cluster near the upper or lower edge.
It combines two observations:
🔹 Compression — the current range width compared with its historical average
🔹 Edge Occupancy — how many recent closes fall inside the upper or lower edge zone
“Pressure” refers to closing-price location. It does not measure actual buying/selling pressure, order flow, or institutional activity.
⏺️ Indicator นี้คืออะไร?
[DAOL] Range Pressure คือเครื่องมือดูว่า กรอบราคาแคบลงหรือยัง และราคาปิดกระจุกอยู่ใกล้ขอบฝั่งไหน
วิเคราะห์จาก 2 องค์ประกอบ:
🔹 Compression — ความกว้างกรอบปัจจุบันเทียบกับค่าเฉลี่ยย้อนหลัง
🔹 Edge Occupancy — จำนวนราคาปิดล่าสุดที่อยู่ในโซนขอบบนหรือขอบล่าง
คำว่า “Pressure” หมายถึงตำแหน่งการกระจุกของราคาปิด ไม่ใช่การวัดแรงซื้อขายจริง Order Flow หรือการซื้อขายของสถาบัน
⏺️ Why use Range Pressure?
🔹 Identifies when the recent price range is narrower than usual
🔹 Shows whether closes cluster near one edge or remain distributed between the edges
🔹 Displays the measurements behind each classification
🔹 Adds context before analyzing a potential breakout
A compressed range does not guarantee an upcoming breakout. Upper-edge clustering does not guarantee an upward move, and lower-edge clustering does not guarantee a downward move.
⏺️ ทำไมต้องใช้?
🔹 ช่วยสังเกตว่ากรอบราคาล่าสุดแคบกว่าปกติหรือไม่
🔹 แสดงว่าราคาปิดกระจุกใกล้ขอบใด หรือยังไม่กระจุกฝั่งใดชัดเจน
🔹 มีตัวเลขประกอบ เพื่อให้เข้าใจเหตุผลของแต่ละสถานะ
🔹 ใช้เป็นบริบทก่อนวิเคราะห์การทะลุกรอบ
กรอบแคบไม่ได้รับประกันว่าจะเกิด Breakout และการกระจุกใกล้ขอบบนหรือขอบล่างไม่ได้รับประกันทิศทางที่จะตามมา
⏺️ Who should use it?
🔹 Traders monitoring consolidation and potential range breakouts
🔹 Day traders and swing traders comparing current range width with historical conditions
🔹 Technical analysts combining price location with volatility analysis
🔹 Users who prefer price-based analysis without a volume requirement
⏺️ เหมาะกับใคร?
🔹 Trader ที่ติดตามช่วงพักตัวและการทะลุกรอบ
🔹 Day trader และ Swing trader ที่ต้องการเทียบความกว้างกรอบกับสภาวะย้อนหลัง
🔹 นักวิเคราะห์ที่ใช้ตำแหน่งราคาร่วมกับการวิเคราะห์ความผันผวน
🔹 ผู้ใช้ที่ต้องการวิเคราะห์จากราคา โดยไม่ต้องใช้ Volume
⏺️ How does it work?
Build a range using the highest high and lowest low of the latest 10 bars.
Calculate its width: Highest High − Lowest Low.
Compare this width with the average of the preceding 50 rolling 10-bar range widths.
Classify the range as compressed when its width is no more than 70% of that average.
Inspect the latest 5 closes against the upper and lower 25% zones of the same current range.
The current range width is excluded from its historical baseline.
All sampled closes are assessed against one current range—not separate historical ranges.
⏺️ ทำงานอย่างไร?
สร้างกรอบจาก High สูงสุดและ Low ต่ำสุดของ 10 แท่งล่าสุด
คำนวณความกว้างกรอบ: High สูงสุด − Low ต่ำสุด
เทียบกับค่าเฉลี่ยความกว้างกรอบ 10 แท่งย้อนหลังจำนวน 50 ค่า
ถือว่าบีบแคบเมื่อความกว้างปัจจุบันไม่เกิน 70% ของค่าเฉลี่ย
ตรวจราคาปิด 5 แท่งล่าสุดว่าอยู่ในโซนบนสุดหรือล่างสุด 25% ของกรอบปัจจุบันกี่แท่ง
ค่าเฉลี่ยอ้างอิงไม่รวมความกว้างกรอบปัจจุบัน
ราคาปิดทั้ง 5 ค่าใช้กรอบปัจจุบันเดียวกันในการประเมิน ไม่ได้ใช้กรอบย้อนหลังคนละกรอบ
⏺️ How to read the colors
🟢 Green — the range is compressed, and enough recent closes cluster near the upper edge
🔴 Red — the range is compressed, and enough recent closes cluster near the lower edge
🟡 Gold — the range is compressed, but neither edge meets the occupancy threshold
⚪ Gray — the range is not compressed, or valid data/confirmation is unavailable
By default, edge dominance requires at least 4 out of 5 closes in the corresponding zone.
Gold means neither edge meets the threshold. It does not necessarily mean closes are concentrated at the exact center.
⏺️ อ่านสีอย่างไร?
🟢 เขียว — กรอบบีบแคบ และราคาปิดกระจุกใกล้ขอบบนครบตามเกณฑ์
🔴 แดง — กรอบบีบแคบ และราคาปิดกระจุกใกล้ขอบล่างครบตามเกณฑ์
🟡 ทอง — กรอบบีบแคบ แต่ไม่มีขอบฝั่งใดผ่านเกณฑ์การกระจุก
⚪ เทา — กรอบยังไม่บีบแคบ หรือข้อมูล/การยืนยันยังไม่พร้อม
ค่าเริ่มต้นกำหนดให้มีราคาปิดอย่างน้อย 4 จาก 5 แท่งอยู่ในโซนขอบเดียวกัน
สีทองหมายถึงยังไม่มีฝั่งใดผ่านเกณฑ์ ไม่ได้หมายความว่าราคาปิดต้องกระจุกตรงกลางกรอบเสมอไป
⏺️ Understanding the measurements
Width / Baseline (%) = Current Range Width ÷ Average Prior Range Width × 100
🔹 60% — the current range is 60% as wide as its historical average
🔹 100% — the current range equals its historical average
🔹 Above 100% — the current range is wider than its historical average
Upper / Lower Edge Closes (%) = Closes Inside That Edge Zone ÷ Sampled Closes × 100
For example, a range of 100–104 has an upper 25% zone of 103–104. If 4 of the latest 5 closes fall inside that zone, upper-edge occupancy is 80%.
That 80% describes observed closes. It is not an 80% probability of an upward breakout.
⏺️ ตัวเลขหมายถึงอะไร?
Width / Baseline (%) = ความกว้างกรอบปัจจุบัน ÷ ค่าเฉลี่ยความกว้างกรอบย้อนหลัง × 100
🔹 60% — กรอบปัจจุบันกว้างเท่ากับ 60% ของค่าเฉลี่ย
🔹 100% — กรอบปัจจุบันกว้างเท่ากับค่าเฉลี่ย
🔹 มากกว่า 100% — กรอบปัจจุบันกว้างกว่าค่าเฉลี่ย
Upper / Lower Edge Closes (%) = จำนวนราคาปิดในโซนขอบนั้น ÷ จำนวนราคาปิดที่ตรวจ × 100
ตัวอย่าง: กรอบอยู่ที่ 100–104 โซนขอบบน 25% คือ 103–104 หากราคาปิด 4 จาก 5 แท่งอยู่ในโซนนี้ ค่า Upper Edge Closes จะเท่ากับ 80%
ตัวเลข 80% นี้เป็นสัดส่วนราคาปิดที่ตรวจพบ ไม่ใช่โอกาสทะลุขึ้น 80%
⏺️ How to use
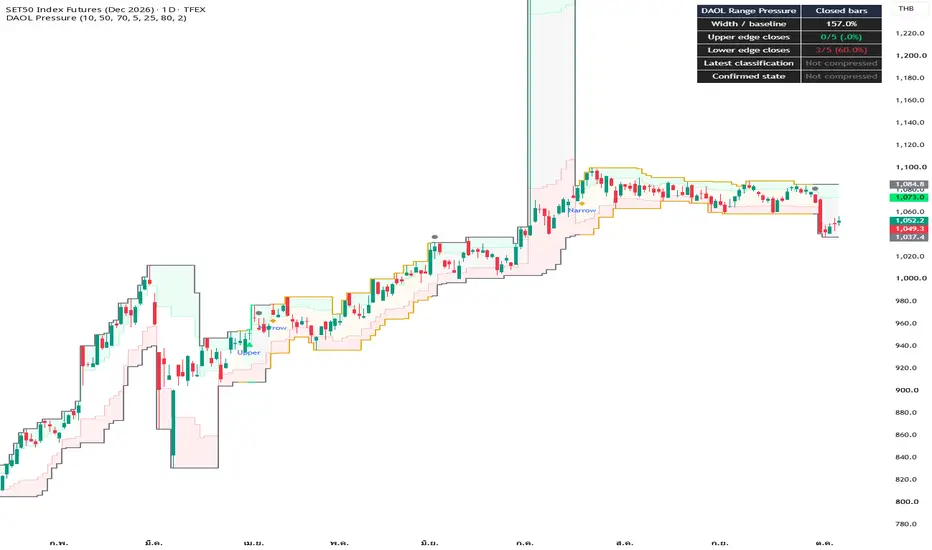
🔹 Outer lines — the high and low of the latest closed-bar range; their color shows the confirmed state
🔹 Light green zone — the upper-edge zone
🔹 Light red zone — the lower-edge zone
🔹 Markers — changes in the confirmed state
🔹 Dashboard — range-width ratio, edge-close counts, latest classification, and confirmed state
The latest classification may differ from the confirmed state while the indicator waits for consecutive closed-bar confirmation.
The range rolls forward with new bars. It is not frozen at a breakout level.
⏺️ วิธีใช้งาน
🔹 เส้นกรอบนอก — High สูงสุดและ Low ต่ำสุดจากกรอบของแท่งปิดล่าสุด โดยสีเส้นแสดงสถานะที่ยืนยันแล้ว
🔹 โซนเขียวอ่อน — โซนใกล้ขอบบน
🔹 โซนแดงอ่อน — โซนใกล้ขอบล่าง
🔹 สัญลักษณ์ — จุดที่สถานะยืนยันเปลี่ยน
🔹 Dashboard — อัตราส่วนความกว้างกรอบ จำนวนราคาปิดในแต่ละโซน สถานะล่าสุด และสถานะยืนยัน
สถานะล่าสุดอาจต่างจากสถานะยืนยันระหว่างรอให้เงื่อนไขต่อเนื่องครบจำนวนแท่งปิด
กรอบนี้เลื่อนไปตามข้อมูลแท่งใหม่ ไม่ได้ล็อกระดับไว้เมื่อเกิด Breakout
⏺️ Default settings
🔹 Range Bars — 10
🔹 Baseline — 50 prior rolling range widths
🔹 Compression Threshold — 70%
🔹 Recent Closes — 5
🔹 Edge Zone Size — 25% per side
🔹 Minimum Edge Occupancy — 80%
🔹 Confirmation — 2 consecutive closed bars
The number of sampled closes must not exceed the range length.
A lower compression threshold requires a narrower range relative to its baseline. A higher occupancy threshold requires more closes near the same edge.
⏺️ ค่าเริ่มต้น
🔹 Range Bars — 10 แท่ง
🔹 Baseline — ความกว้างกรอบย้อนหลัง 50 ค่า
🔹 Compression Threshold — 70%
🔹 Recent Closes — 5 แท่ง
🔹 Edge Zone Size — ฝั่งละ 25% ของความกว้างกรอบ
🔹 Minimum Edge Occupancy — 80%
🔹 Confirmation — 2 แท่งปิดต่อเนื่อง
จำนวนราคาปิดที่ตรวจต้องไม่เกินจำนวนแท่งของกรอบราคา
การลด Compression Threshold ทำให้ต้องมีกรอบแคบลงมากขึ้นจึงผ่านเกณฑ์ ส่วนการเพิ่ม Occupancy Threshold ทำให้ต้องมีราคาปิดอยู่ใกล้ขอบเดียวกันมากขึ้น
⏺️ Alerts
🔹 Compressed upper edge
🔹 Compressed lower edge
🔹 Balanced compression
🔹 Compression ended
🔹 Any confirmed state change
By default, a state must persist for 2 consecutive closed bars before confirmation. Alert events occur once when the confirmed state changes.
The first confirmed state initializes silently. Invalid or zero-width ranges interrupt confirmation.
To receive alerts, create an alert in TradingView, select the desired condition, and choose “Once Per Bar Close.”
⏺️ การแจ้งเตือน
🔹 Compressed upper edge — กรอบแคบและกระจุกใกล้ขอบบน
🔹 Compressed lower edge — กรอบแคบและกระจุกใกล้ขอบล่าง
🔹 Balanced compression — กรอบแคบแต่ไม่มีฝั่งใดผ่านเกณฑ์
🔹 Compression ended — ออกจากเกณฑ์บีบแคบ
🔹 Any confirmed state change — สถานะยืนยันเปลี่ยนทุกประเภท
ค่าเริ่มต้นรอให้สถานะต่อเนื่องครบ 2 แท่งปิดก่อนยืนยัน และสร้างเหตุการณ์ Alert ครั้งเดียวเมื่อสถานะยืนยันเปลี่ยน
สถานะแรกที่ยืนยันได้ใช้เริ่มต้นระบบโดยไม่แจ้งเตือน หากกรอบมีความกว้างเป็นศูนย์หรือข้อมูลไม่พร้อม การนับยืนยันจะถูกรีเซ็ต
หากต้องการรับ Alert ให้สร้างการแจ้งเตือนใน TradingView เลือกเงื่อนไขที่ต้องการ และตั้ง “Once Per Bar Close”
⏺️ Key Features
🔹 Range compression relative to a historical baseline
🔹 Upper- and lower-edge closing-price occupancy
🔹 One shared range for all sampled closes
🔹 Configurable closed-bar confirmation
🔹 Dashboard with underlying measurements
🔹 Price-only calculation without volume or multi-timeframe requests
⏺️ จุดเด่น
🔹 วัดการบีบแคบเทียบกับค่าเฉลี่ยย้อนหลัง
🔹 วัดการกระจุกของราคาปิดใกล้ขอบบนและขอบล่าง
🔹 ใช้กรอบเดียวกันประเมินราคาปิดทุกค่าที่ตรวจ
🔹 ปรับจำนวนแท่งปิดสำหรับยืนยันได้
🔹 มี Dashboard แสดงตัวเลขที่ใช้จำแนกสถานะ
🔹 ใช้ข้อมูลราคา ไม่ต้องใช้ Volume หรือข้อมูลจาก Timeframe อื่น
⏺️ Concept and attribution
The highest-high / lowest-low range is based on the Donchian Channels concept associated with Richard Donchian.
This independently written implementation combines relative range compression with recent closing-price occupancy near the range edges and consecutive closed-bar confirmation.
It does not claim that price channels, volatility compression, or edge-location analysis are entirely new concepts.
Reference:
TradingView — Donchian Channels (DC)
tradingview.com/support/solutions/43000502253-donchian-channels-dc/
⏺️ แนวคิดและการอ้างอิง
กรอบ High สูงสุดและ Low ต่ำสุดอ้างอิงแนวคิด Donchian Channels ของ Richard Donchian
โค้ดชุดนี้เขียนขึ้นใหม่ โดยนำการบีบแคบเทียบกับค่าเฉลี่ยมาประกอบกับการกระจุกของราคาปิดใกล้ขอบ และการยืนยันด้วยแท่งปิดต่อเนื่อง
ไม่ได้อ้างว่าแนวคิดกรอบราคา การบีบแคบ หรือการวิเคราะห์ตำแหน่งใกล้ขอบเป็นสิ่งใหม่ทั้งหมด
⏺️ Limitations and disclaimer
🔹 A compressed range can remain compressed for an extended period.
🔹 Edge occupancy does not predict breakout direction or timing.
🔹 Rolling boundaries can change the classification of sampled closes.
🔹 Confirmation introduces delay and cannot eliminate false signals.
🔹 Synthetic formula checks have been completed. TradingView compilation and real-market validation remain pending for this version.
🔹 For educational and informational purposes only. It does not constitute investment advice or a standalone trading system.
⏺️ ข้อจำกัดและคำชี้แจง
🔹 กรอบราคาอาจแคบต่อเนื่องเป็นเวลานาน
🔹 การกระจุกใกล้ขอบไม่ได้ทำนายทิศทางหรือเวลาที่จะเกิด Breakout
🔹 การเลื่อนขอบกรอบอาจเปลี่ยนผลการจำแนกราคาปิดที่ตรวจ
🔹 การรอยืนยันทำให้มีความล่าช้า และไม่สามารถกำจัดสัญญาณผิดพลาดทั้งหมด
🔹 เวอร์ชันนี้ตรวจสูตรด้วยข้อมูลสังเคราะห์แล้ว แต่ยังรอการ Compile ใน TradingView และตรวจสอบกับข้อมูลตลาดจริง
🔹 ใช้เพื่อการศึกษาและประกอบการวิเคราะห์ ไม่ถือเป็นคำแนะนำการลงทุนหรือระบบซื้อขายที่ใช้ได้โดยลำพัง
[DAOL] Range Pressure identifies narrowing price ranges and measures whether recent closing prices cluster near the upper or lower edge.
It combines two observations:
🔹 Compression — the current range width compared with its historical average
🔹 Edge Occupancy — how many recent closes fall inside the upper or lower edge zone
“Pressure” refers to closing-price location. It does not measure actual buying/selling pressure, order flow, or institutional activity.
⏺️ Indicator นี้คืออะไร?
[DAOL] Range Pressure คือเครื่องมือดูว่า กรอบราคาแคบลงหรือยัง และราคาปิดกระจุกอยู่ใกล้ขอบฝั่งไหน
วิเคราะห์จาก 2 องค์ประกอบ:
🔹 Compression — ความกว้างกรอบปัจจุบันเทียบกับค่าเฉลี่ยย้อนหลัง
🔹 Edge Occupancy — จำนวนราคาปิดล่าสุดที่อยู่ในโซนขอบบนหรือขอบล่าง
คำว่า “Pressure” หมายถึงตำแหน่งการกระจุกของราคาปิด ไม่ใช่การวัดแรงซื้อขายจริง Order Flow หรือการซื้อขายของสถาบัน
⏺️ Why use Range Pressure?
🔹 Identifies when the recent price range is narrower than usual
🔹 Shows whether closes cluster near one edge or remain distributed between the edges
🔹 Displays the measurements behind each classification
🔹 Adds context before analyzing a potential breakout
A compressed range does not guarantee an upcoming breakout. Upper-edge clustering does not guarantee an upward move, and lower-edge clustering does not guarantee a downward move.
⏺️ ทำไมต้องใช้?
🔹 ช่วยสังเกตว่ากรอบราคาล่าสุดแคบกว่าปกติหรือไม่
🔹 แสดงว่าราคาปิดกระจุกใกล้ขอบใด หรือยังไม่กระจุกฝั่งใดชัดเจน
🔹 มีตัวเลขประกอบ เพื่อให้เข้าใจเหตุผลของแต่ละสถานะ
🔹 ใช้เป็นบริบทก่อนวิเคราะห์การทะลุกรอบ
กรอบแคบไม่ได้รับประกันว่าจะเกิด Breakout และการกระจุกใกล้ขอบบนหรือขอบล่างไม่ได้รับประกันทิศทางที่จะตามมา
⏺️ Who should use it?
🔹 Traders monitoring consolidation and potential range breakouts
🔹 Day traders and swing traders comparing current range width with historical conditions
🔹 Technical analysts combining price location with volatility analysis
🔹 Users who prefer price-based analysis without a volume requirement
⏺️ เหมาะกับใคร?
🔹 Trader ที่ติดตามช่วงพักตัวและการทะลุกรอบ
🔹 Day trader และ Swing trader ที่ต้องการเทียบความกว้างกรอบกับสภาวะย้อนหลัง
🔹 นักวิเคราะห์ที่ใช้ตำแหน่งราคาร่วมกับการวิเคราะห์ความผันผวน
🔹 ผู้ใช้ที่ต้องการวิเคราะห์จากราคา โดยไม่ต้องใช้ Volume
⏺️ How does it work?
Build a range using the highest high and lowest low of the latest 10 bars.
Calculate its width: Highest High − Lowest Low.
Compare this width with the average of the preceding 50 rolling 10-bar range widths.
Classify the range as compressed when its width is no more than 70% of that average.
Inspect the latest 5 closes against the upper and lower 25% zones of the same current range.
The current range width is excluded from its historical baseline.
All sampled closes are assessed against one current range—not separate historical ranges.
⏺️ ทำงานอย่างไร?
สร้างกรอบจาก High สูงสุดและ Low ต่ำสุดของ 10 แท่งล่าสุด
คำนวณความกว้างกรอบ: High สูงสุด − Low ต่ำสุด
เทียบกับค่าเฉลี่ยความกว้างกรอบ 10 แท่งย้อนหลังจำนวน 50 ค่า
ถือว่าบีบแคบเมื่อความกว้างปัจจุบันไม่เกิน 70% ของค่าเฉลี่ย
ตรวจราคาปิด 5 แท่งล่าสุดว่าอยู่ในโซนบนสุดหรือล่างสุด 25% ของกรอบปัจจุบันกี่แท่ง
ค่าเฉลี่ยอ้างอิงไม่รวมความกว้างกรอบปัจจุบัน
ราคาปิดทั้ง 5 ค่าใช้กรอบปัจจุบันเดียวกันในการประเมิน ไม่ได้ใช้กรอบย้อนหลังคนละกรอบ
⏺️ How to read the colors
🟢 Green — the range is compressed, and enough recent closes cluster near the upper edge
🔴 Red — the range is compressed, and enough recent closes cluster near the lower edge
🟡 Gold — the range is compressed, but neither edge meets the occupancy threshold
⚪ Gray — the range is not compressed, or valid data/confirmation is unavailable
By default, edge dominance requires at least 4 out of 5 closes in the corresponding zone.
Gold means neither edge meets the threshold. It does not necessarily mean closes are concentrated at the exact center.
⏺️ อ่านสีอย่างไร?
🟢 เขียว — กรอบบีบแคบ และราคาปิดกระจุกใกล้ขอบบนครบตามเกณฑ์
🔴 แดง — กรอบบีบแคบ และราคาปิดกระจุกใกล้ขอบล่างครบตามเกณฑ์
🟡 ทอง — กรอบบีบแคบ แต่ไม่มีขอบฝั่งใดผ่านเกณฑ์การกระจุก
⚪ เทา — กรอบยังไม่บีบแคบ หรือข้อมูล/การยืนยันยังไม่พร้อม
ค่าเริ่มต้นกำหนดให้มีราคาปิดอย่างน้อย 4 จาก 5 แท่งอยู่ในโซนขอบเดียวกัน
สีทองหมายถึงยังไม่มีฝั่งใดผ่านเกณฑ์ ไม่ได้หมายความว่าราคาปิดต้องกระจุกตรงกลางกรอบเสมอไป
⏺️ Understanding the measurements
Width / Baseline (%) = Current Range Width ÷ Average Prior Range Width × 100
🔹 60% — the current range is 60% as wide as its historical average
🔹 100% — the current range equals its historical average
🔹 Above 100% — the current range is wider than its historical average
Upper / Lower Edge Closes (%) = Closes Inside That Edge Zone ÷ Sampled Closes × 100
For example, a range of 100–104 has an upper 25% zone of 103–104. If 4 of the latest 5 closes fall inside that zone, upper-edge occupancy is 80%.
That 80% describes observed closes. It is not an 80% probability of an upward breakout.
⏺️ ตัวเลขหมายถึงอะไร?
Width / Baseline (%) = ความกว้างกรอบปัจจุบัน ÷ ค่าเฉลี่ยความกว้างกรอบย้อนหลัง × 100
🔹 60% — กรอบปัจจุบันกว้างเท่ากับ 60% ของค่าเฉลี่ย
🔹 100% — กรอบปัจจุบันกว้างเท่ากับค่าเฉลี่ย
🔹 มากกว่า 100% — กรอบปัจจุบันกว้างกว่าค่าเฉลี่ย
Upper / Lower Edge Closes (%) = จำนวนราคาปิดในโซนขอบนั้น ÷ จำนวนราคาปิดที่ตรวจ × 100
ตัวอย่าง: กรอบอยู่ที่ 100–104 โซนขอบบน 25% คือ 103–104 หากราคาปิด 4 จาก 5 แท่งอยู่ในโซนนี้ ค่า Upper Edge Closes จะเท่ากับ 80%
ตัวเลข 80% นี้เป็นสัดส่วนราคาปิดที่ตรวจพบ ไม่ใช่โอกาสทะลุขึ้น 80%
⏺️ How to use
🔹 Outer lines — the high and low of the latest closed-bar range; their color shows the confirmed state
🔹 Light green zone — the upper-edge zone
🔹 Light red zone — the lower-edge zone
🔹 Markers — changes in the confirmed state
🔹 Dashboard — range-width ratio, edge-close counts, latest classification, and confirmed state
The latest classification may differ from the confirmed state while the indicator waits for consecutive closed-bar confirmation.
The range rolls forward with new bars. It is not frozen at a breakout level.
⏺️ วิธีใช้งาน
🔹 เส้นกรอบนอก — High สูงสุดและ Low ต่ำสุดจากกรอบของแท่งปิดล่าสุด โดยสีเส้นแสดงสถานะที่ยืนยันแล้ว
🔹 โซนเขียวอ่อน — โซนใกล้ขอบบน
🔹 โซนแดงอ่อน — โซนใกล้ขอบล่าง
🔹 สัญลักษณ์ — จุดที่สถานะยืนยันเปลี่ยน
🔹 Dashboard — อัตราส่วนความกว้างกรอบ จำนวนราคาปิดในแต่ละโซน สถานะล่าสุด และสถานะยืนยัน
สถานะล่าสุดอาจต่างจากสถานะยืนยันระหว่างรอให้เงื่อนไขต่อเนื่องครบจำนวนแท่งปิด
กรอบนี้เลื่อนไปตามข้อมูลแท่งใหม่ ไม่ได้ล็อกระดับไว้เมื่อเกิด Breakout
⏺️ Default settings
🔹 Range Bars — 10
🔹 Baseline — 50 prior rolling range widths
🔹 Compression Threshold — 70%
🔹 Recent Closes — 5
🔹 Edge Zone Size — 25% per side
🔹 Minimum Edge Occupancy — 80%
🔹 Confirmation — 2 consecutive closed bars
The number of sampled closes must not exceed the range length.
A lower compression threshold requires a narrower range relative to its baseline. A higher occupancy threshold requires more closes near the same edge.
⏺️ ค่าเริ่มต้น
🔹 Range Bars — 10 แท่ง
🔹 Baseline — ความกว้างกรอบย้อนหลัง 50 ค่า
🔹 Compression Threshold — 70%
🔹 Recent Closes — 5 แท่ง
🔹 Edge Zone Size — ฝั่งละ 25% ของความกว้างกรอบ
🔹 Minimum Edge Occupancy — 80%
🔹 Confirmation — 2 แท่งปิดต่อเนื่อง
จำนวนราคาปิดที่ตรวจต้องไม่เกินจำนวนแท่งของกรอบราคา
การลด Compression Threshold ทำให้ต้องมีกรอบแคบลงมากขึ้นจึงผ่านเกณฑ์ ส่วนการเพิ่ม Occupancy Threshold ทำให้ต้องมีราคาปิดอยู่ใกล้ขอบเดียวกันมากขึ้น
⏺️ Alerts
🔹 Compressed upper edge
🔹 Compressed lower edge
🔹 Balanced compression
🔹 Compression ended
🔹 Any confirmed state change
By default, a state must persist for 2 consecutive closed bars before confirmation. Alert events occur once when the confirmed state changes.
The first confirmed state initializes silently. Invalid or zero-width ranges interrupt confirmation.
To receive alerts, create an alert in TradingView, select the desired condition, and choose “Once Per Bar Close.”
⏺️ การแจ้งเตือน
🔹 Compressed upper edge — กรอบแคบและกระจุกใกล้ขอบบน
🔹 Compressed lower edge — กรอบแคบและกระจุกใกล้ขอบล่าง
🔹 Balanced compression — กรอบแคบแต่ไม่มีฝั่งใดผ่านเกณฑ์
🔹 Compression ended — ออกจากเกณฑ์บีบแคบ
🔹 Any confirmed state change — สถานะยืนยันเปลี่ยนทุกประเภท
ค่าเริ่มต้นรอให้สถานะต่อเนื่องครบ 2 แท่งปิดก่อนยืนยัน และสร้างเหตุการณ์ Alert ครั้งเดียวเมื่อสถานะยืนยันเปลี่ยน
สถานะแรกที่ยืนยันได้ใช้เริ่มต้นระบบโดยไม่แจ้งเตือน หากกรอบมีความกว้างเป็นศูนย์หรือข้อมูลไม่พร้อม การนับยืนยันจะถูกรีเซ็ต
หากต้องการรับ Alert ให้สร้างการแจ้งเตือนใน TradingView เลือกเงื่อนไขที่ต้องการ และตั้ง “Once Per Bar Close”
⏺️ Key Features
🔹 Range compression relative to a historical baseline
🔹 Upper- and lower-edge closing-price occupancy
🔹 One shared range for all sampled closes
🔹 Configurable closed-bar confirmation
🔹 Dashboard with underlying measurements
🔹 Price-only calculation without volume or multi-timeframe requests
⏺️ จุดเด่น
🔹 วัดการบีบแคบเทียบกับค่าเฉลี่ยย้อนหลัง
🔹 วัดการกระจุกของราคาปิดใกล้ขอบบนและขอบล่าง
🔹 ใช้กรอบเดียวกันประเมินราคาปิดทุกค่าที่ตรวจ
🔹 ปรับจำนวนแท่งปิดสำหรับยืนยันได้
🔹 มี Dashboard แสดงตัวเลขที่ใช้จำแนกสถานะ
🔹 ใช้ข้อมูลราคา ไม่ต้องใช้ Volume หรือข้อมูลจาก Timeframe อื่น
⏺️ Concept and attribution
The highest-high / lowest-low range is based on the Donchian Channels concept associated with Richard Donchian.
This independently written implementation combines relative range compression with recent closing-price occupancy near the range edges and consecutive closed-bar confirmation.
It does not claim that price channels, volatility compression, or edge-location analysis are entirely new concepts.
Reference:
TradingView — Donchian Channels (DC)
tradingview.com/support/solutions/43000502253-donchian-channels-dc/
⏺️ แนวคิดและการอ้างอิง
กรอบ High สูงสุดและ Low ต่ำสุดอ้างอิงแนวคิด Donchian Channels ของ Richard Donchian
โค้ดชุดนี้เขียนขึ้นใหม่ โดยนำการบีบแคบเทียบกับค่าเฉลี่ยมาประกอบกับการกระจุกของราคาปิดใกล้ขอบ และการยืนยันด้วยแท่งปิดต่อเนื่อง
ไม่ได้อ้างว่าแนวคิดกรอบราคา การบีบแคบ หรือการวิเคราะห์ตำแหน่งใกล้ขอบเป็นสิ่งใหม่ทั้งหมด
⏺️ Limitations and disclaimer
🔹 A compressed range can remain compressed for an extended period.
🔹 Edge occupancy does not predict breakout direction or timing.
🔹 Rolling boundaries can change the classification of sampled closes.
🔹 Confirmation introduces delay and cannot eliminate false signals.
🔹 Synthetic formula checks have been completed. TradingView compilation and real-market validation remain pending for this version.
🔹 For educational and informational purposes only. It does not constitute investment advice or a standalone trading system.
⏺️ ข้อจำกัดและคำชี้แจง
🔹 กรอบราคาอาจแคบต่อเนื่องเป็นเวลานาน
🔹 การกระจุกใกล้ขอบไม่ได้ทำนายทิศทางหรือเวลาที่จะเกิด Breakout
🔹 การเลื่อนขอบกรอบอาจเปลี่ยนผลการจำแนกราคาปิดที่ตรวจ
🔹 การรอยืนยันทำให้มีความล่าช้า และไม่สามารถกำจัดสัญญาณผิดพลาดทั้งหมด
🔹 เวอร์ชันนี้ตรวจสูตรด้วยข้อมูลสังเคราะห์แล้ว แต่ยังรอการ Compile ใน TradingView และตรวจสอบกับข้อมูลตลาดจริง
🔹 ใช้เพื่อการศึกษาและประกอบการวิเคราะห์ ไม่ถือเป็นคำแนะนำการลงทุนหรือระบบซื้อขายที่ใช้ได้โดยลำพัง

Aviso legal
As informações e publicações não se destinam a ser, e não constituem, conselhos ou recomendações financeiras, de investimento, comerciais ou de outro tipo fornecidos ou endossados pela TradingView. Leia mais nos Termos de Uso.
Aviso legal
As informações e publicações não se destinam a ser, e não constituem, conselhos ou recomendações financeiras, de investimento, comerciais ou de outro tipo fornecidos ou endossados pela TradingView. Leia mais nos Termos de Uso.