OPEN-SOURCE SCRIPT
RSI EMA Dot (Long Below / Short Above)
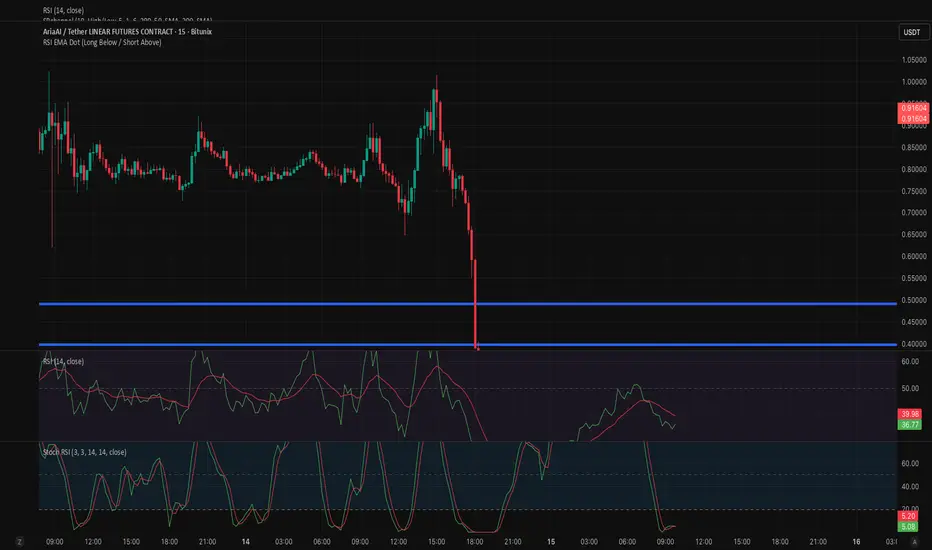
RSI EMA Cross Dot Indicator
This indicator identifies potential reversal points by combining RSI extremes with momentum shifts.
A signal is generated when the RSI (14) crosses its EMA (14) after being in an extreme zone:
Long signal (green dot below the candle):
RSI was below 20 (oversold) and then crosses above its EMA.
Short signal (red dot above the candle):
RSI was above 80 (overbought) and then crosses below its EMA.
Dots are plotted directly on the chart:
Long signals appear below the candle
Short signals appear above the candle
This helps highlight potential market reversals after extreme conditions, making it useful for identifying high-probability reaction zones.
This indicator identifies potential reversal points by combining RSI extremes with momentum shifts.
A signal is generated when the RSI (14) crosses its EMA (14) after being in an extreme zone:
Long signal (green dot below the candle):
RSI was below 20 (oversold) and then crosses above its EMA.
Short signal (red dot above the candle):
RSI was above 80 (overbought) and then crosses below its EMA.
Dots are plotted directly on the chart:
Long signals appear below the candle
Short signals appear above the candle
This helps highlight potential market reversals after extreme conditions, making it useful for identifying high-probability reaction zones.
Script de código aberto
Em verdadeiro espírito do TradingView, o criador deste script o tornou de código aberto, para que os traders possam revisar e verificar sua funcionalidade. Parabéns ao autor! Embora você possa usá-lo gratuitamente, lembre-se de que a republicação do código está sujeita às nossas Regras da Casa.

Aviso legal
As informações e publicações não se destinam a ser, e não constituem, conselhos ou recomendações financeiras, de investimento, comerciais ou de outro tipo fornecidos ou endossados pela TradingView. Leia mais nos Termos de Uso.
Script de código aberto
Em verdadeiro espírito do TradingView, o criador deste script o tornou de código aberto, para que os traders possam revisar e verificar sua funcionalidade. Parabéns ao autor! Embora você possa usá-lo gratuitamente, lembre-se de que a republicação do código está sujeita às nossas Regras da Casa.
Aviso legal
As informações e publicações não se destinam a ser, e não constituem, conselhos ou recomendações financeiras, de investimento, comerciais ou de outro tipo fornecidos ou endossados pela TradingView. Leia mais nos Termos de Uso.