OPEN-SOURCE SCRIPT
Minsky Instability Clock [SpokoStocks]
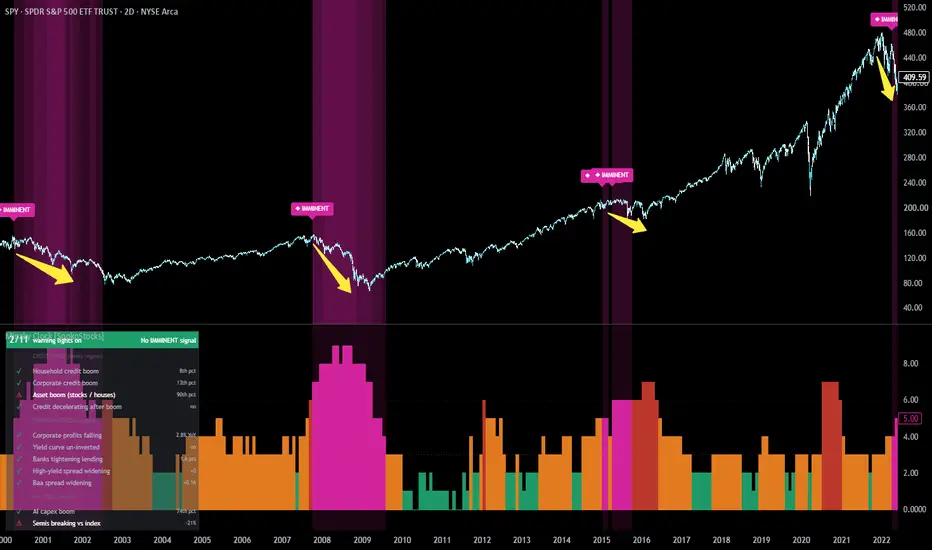
When does a boom become fragile? This Minsky-based clock turns 11 public macro indicators — credit, profits, yield curve, bank lending, credit spreads and AI capex — into one easy-to-read warning scoreboard.
"Stability is destabilizing." — Hyman P. Minsky
━━━━━━━━━━━━━━━━━━━━━━━━━━━━━━━━━━━━━━━━
OVERVIEW
The Minsky Instability Clock maps the US credit cycle through the lens of Hyman Minsky's Financial Instability Hypothesis. Long periods of calm encourage borrowing, borrowing fuels asset booms, and a boom becomes fragile once credit growth stops accelerating and financing conditions begin to tighten.
The script combines public macroeconomic data — household and corporate debt, asset prices, corporate profits, the yield curve, bank lending standards and credit spreads — into a single clock. It highlights the rare periods when a credit-fuelled boom is losing its financing. Historically, that has been the setting of the largest US equity drawdowns.
It is a macro regime tool, not a trading signal. It is designed for monthly or weekly charts of broad US equity indices such as the S&P 500.
━━━━━━━━━━━━━━━━━━━━━━━━━━━━━━━━━━━━━━━━
THE IDEA
Minsky argued that financial systems move from stability to fragility on their own. As confidence grows, borrowers move from "hedge" finance (income covers debt service) toward "speculative" and eventually "Ponzi" finance, which depends on rising asset prices and continuous new lending. A boom does not need credit to shrink in order to fail. It only needs credit growth to slow while the debt taken on during the boom still has to be serviced.
Michał Kalecki's profit equation adds the second leg: corporate debt stays healthy only while profits keep validating it. When profits roll over, lenders tighten and spreads widen, and the "Minsky moment" arrives.
The clock therefore asks two questions every month:
1. Has there been a genuine credit-plus-asset boom, and is that credit now decelerating? (the regime)
2. Are financing conditions starting to break? (the triggers)
Only when both are true does the clock enter its IMMINENT state.
━━━━━━━━━━━━━━━━━━━━━━━━━━━━━━━━━━━━━━━━
HOW IT WORKS
1) CREDIT CYCLE — the Minsky regime
- Credit boom
The 3-year change in household debt/GDP or non-financial corporate debt/GDP ranks in the top 20% of its own history (Federal Reserve Z.1 Financial Accounts). Percentiles are expanding and point-in-time, so each reading is compared only with the history available at that moment.
- Asset boom
3-year growth in real (CPI-deflated) S&P 500 prices or real FHFA house prices ranks in the top third of its history.
- Pop window
Within 24 months of a combined credit and asset boom, a booming credit channel starts to decelerate: its credit impulse (the change in the growth of debt/GDP, smoothed over two quarters) turns negative. This is the phase in which the boom can no longer be financed at the pace it requires.
2) MINSKY-MOMENT TRIGGERS — financing stress
- Corporate profits below their level a year earlier (the Kalecki profit channel)
- Yield curve (10Y minus 3M) back above zero after an inversion in the previous 18 months
- Fed Senior Loan Officer Opinion Survey: net share of banks tightening business lending standards up 10+ points in 6 months
- ICE BofA US High Yield option-adjusted spread 1+ point above its 12-month low
- Moody's Baa corporate yield spread over 10-year Treasuries 0.3+ point above its 12-month low
3) IMMINENT STATE
IMMINENT = pop window open AND at least 2 triggers firing (adjustable from 1 to 5).
It combines a fragile regime with confirmed financing stress. In the historical data it has been rare — roughly seven episodes since the late 1980s — which is what makes it informative.
4) AI CYCLE MONITOR — context layer
The current AI infrastructure build-out is financed partly outside the credit aggregates above: hyperscaler bond issuance, private credit and off-balance-sheet data-centre vehicles. To keep this cycle visible, a separate context layer tracks:
- AI capex boom
The 3-year rise in IT-equipment investment relative to GDP ranks in its top 20%, while real semiconductor-index (SOX) growth ranks in its top third.
- Semiconductor break
The semiconductor index falls 15% or more against the equity index from its 12-month relative high.
- AI stress
Within 24 months of an AI capex boom, a semiconductor break occurs together with at least one financing trigger.
This layer is for monitoring only and does not feed the IMMINENT state. The closest historical analogue — the 1995–2001 telecom and internet capex cycle — does not provide enough independent cases to validate timing, and the rules tested did not improve historical reliability. It is labelled as context everywhere in the script.
━━━━━━━━━━━━━━━━━━━━━━━━━━━━━━━━━━━━━━━━
HOW TO READ IT
PRICE CHART
- Pink background with a "◆ IMMINENT" label: pop window plus financing stress. Hover over the label to see which triggers were active when the state began. The pink deepens as more triggers fire.
- Optional amber background with a "◇ pop window" label: the credit boom is decelerating but financing stress is not yet confirmed.
- Optional cyan background with a "◇ AI stress" label: AI context layer.
By default only the IMMINENT state is drawn, keeping the price chart clean.
LOWER PANE — WARNING-LIGHT COLUMNS
The columns show how many of 11 warning lights are on (0–11):
- deep navy → steel blue → gold → red as lights accumulate
- amber when a pop window is open
- pink when the clock is IMMINENT
Dotted guides mark 3 and 6 lights. A thin edge line traces the count over time.
LOWER PANE — SCOREBOARD
A compact table shows each light with ✔ (calm) or ⚠ (warning) and its current reading, grouped as:
CREDIT CYCLE
- Household credit boom
- Corporate credit boom
- Asset boom (stocks / houses)
- Credit decelerating after boom (pop window)
FINANCING STRESS
- Corporate profits falling
- Yield curve un-inverted
- Banks tightening lending
- High-yield spread widening
- Baa spread widening
AI CYCLE (context)
- AI capex boom
- Semiconductors breaking vs index
The header shows the total (for example "3/11") and the current state. Every raw value is also available in TradingView's Data Window.
━━━━━━━━━━━━━━━━━━━━━━━━━━━━━━━━━━━━━━━━
SETTINGS
Model
- Equity index used for the asset-boom test (default TVC:SPX)
- Triggers required for IMMINENT (default 2)
- Credit-impulse smoothing in quarters (default 2)
Price chart
- IMMINENT background and label (on)
- Pop-window background and label (off)
- Trigger-intensity shading (on)
AI cycle monitor
- Show in lower pane (on)
- AI-stress background and label on price chart (off)
- Semiconductor index symbol (default NASDAQ:SOX)
Lower pane
- Scoreboard on/off and position
- Warning-light columns on/off
- Optional detail curves on a 0–100 scale: credit fuel, financing stress, asset boom and AI capex gauge (switch off the columns to read them)
━━━━━━━━━━━━━━━━━━━━━━━━━━━━━━━━━━━━━━━━
ALERTS
- IMMINENT started
- IMMINENT ended
- Pop window opened
- Trigger count increased
- Warning lights increased
- AI capex boom
- AI stress
━━━━━━━━━━━━━━━━━━━━━━━━━━━━━━━━━━━━━━━━
DATA AND NON-REPAINTING DESIGN
All inputs are public FRED series that update automatically on TradingView, so nothing needs to be entered by hand:
household debt (CMDEBT), non-financial corporate debt (BCNSDODNS), GDP, FHFA house price index (USSTHPI), CPI (CPIAUCSL), corporate profits (CP), 10-year and 3-month Treasury yields (GS10, TB3MS), Senior Loan Officer Survey (DRTSCILM), ICE BofA High Yield OAS (BAMLH0A0HYM2), Moody's Baa yield (DBAA) and IT-equipment investment (Y033RC1Q027SBEA), plus the chosen equity and semiconductor indices.
Each series is shifted by its publication lag (quarterly Z.1 and profit data are used two quarters later, for example), and all higher-timeframe requests read confirmed, completed periods only. Historical readings therefore reflect what was knowable at the time, and the signals do not repaint.
━━━━━━━━━━━━━━━━━━━━━━━━━━━━━━━━━━━━━━━━
HISTORICAL BEHAVIOUR (educational context)
On monthly data the IMMINENT state appeared ahead of or near the start of the 1990, 2000–2002, 2007–2009 and 2022 declines. It has also produced false or early signals, for example in 2005 and 2014–2015.
By design it does not register shocks that were not preceded by a credit boom, such as 1987, 1998, 2020 and 2025. Before 1990 several bear markets were driven mainly by inflation and interest rates rather than credit, and those lie largely outside what this tool measures.
Design notes: several extensions were tested and deliberately left out because they did not improve historical reliability. These were margin-debt surges, faster monthly bank and consumer credit series, and an "equity boom plus financing stress without a credit boom" path. In the data, booms became fragile through broad credit growth, and the clock stays focused on that channel.
━━━━━━━━━━━━━━━━━━━━━━━━━━━━━━━━━━━━━━━━
LIMITATIONS
- Macro data is revised and published with delays, so the clock moves slowly by design.
- There are few historical credit busts, so treat the state as context, not certainty.
- The AI Cycle Monitor has no historical validation and is labelled as context throughout.
- The script is built for the US economy and broad US equity indices.
- The script depends on TradingView's FRED data feeds; if a feed stops updating, the related reading stays at its last value.
━━━━━━━━━━━━━━━━━━━━━━━━━━━━━━━━━━━━━━━━
REFERENCES
- Hyman P. Minsky — "The Financial Instability Hypothesis" (1992); Stabilizing an Unstable Economy (1986)
- Michał Kalecki — Theory of Economic Dynamics (profit equation)
- Robin Greenwood, Samuel G. Hanson, Andrei Shleifer, Jakob Ahm Sørensen — "Predictable Financial Crises", Journal of Finance (2022)
- Bank for International Settlements — research on credit-to-GDP gaps and on the financing of the AI infrastructure boom
- Federal Reserve Board — Z.1 Financial Accounts; Senior Loan Officer Opinion Survey
━━━━━━━━━━━━━━━━━━━━━━━━━━━━━━━━━━━━━━━━
DISCLAIMER
This script is for educational and research purposes only. It does not provide investment, financial or trading advice and does not recommend any action. Past behaviour of any indicator does not guarantee future results. Always do your own research.
"Stability is destabilizing." — Hyman P. Minsky
━━━━━━━━━━━━━━━━━━━━━━━━━━━━━━━━━━━━━━━━
OVERVIEW
The Minsky Instability Clock maps the US credit cycle through the lens of Hyman Minsky's Financial Instability Hypothesis. Long periods of calm encourage borrowing, borrowing fuels asset booms, and a boom becomes fragile once credit growth stops accelerating and financing conditions begin to tighten.
The script combines public macroeconomic data — household and corporate debt, asset prices, corporate profits, the yield curve, bank lending standards and credit spreads — into a single clock. It highlights the rare periods when a credit-fuelled boom is losing its financing. Historically, that has been the setting of the largest US equity drawdowns.
It is a macro regime tool, not a trading signal. It is designed for monthly or weekly charts of broad US equity indices such as the S&P 500.
━━━━━━━━━━━━━━━━━━━━━━━━━━━━━━━━━━━━━━━━
THE IDEA
Minsky argued that financial systems move from stability to fragility on their own. As confidence grows, borrowers move from "hedge" finance (income covers debt service) toward "speculative" and eventually "Ponzi" finance, which depends on rising asset prices and continuous new lending. A boom does not need credit to shrink in order to fail. It only needs credit growth to slow while the debt taken on during the boom still has to be serviced.
Michał Kalecki's profit equation adds the second leg: corporate debt stays healthy only while profits keep validating it. When profits roll over, lenders tighten and spreads widen, and the "Minsky moment" arrives.
The clock therefore asks two questions every month:
1. Has there been a genuine credit-plus-asset boom, and is that credit now decelerating? (the regime)
2. Are financing conditions starting to break? (the triggers)
Only when both are true does the clock enter its IMMINENT state.
━━━━━━━━━━━━━━━━━━━━━━━━━━━━━━━━━━━━━━━━
HOW IT WORKS
1) CREDIT CYCLE — the Minsky regime
- Credit boom
The 3-year change in household debt/GDP or non-financial corporate debt/GDP ranks in the top 20% of its own history (Federal Reserve Z.1 Financial Accounts). Percentiles are expanding and point-in-time, so each reading is compared only with the history available at that moment.
- Asset boom
3-year growth in real (CPI-deflated) S&P 500 prices or real FHFA house prices ranks in the top third of its history.
- Pop window
Within 24 months of a combined credit and asset boom, a booming credit channel starts to decelerate: its credit impulse (the change in the growth of debt/GDP, smoothed over two quarters) turns negative. This is the phase in which the boom can no longer be financed at the pace it requires.
2) MINSKY-MOMENT TRIGGERS — financing stress
- Corporate profits below their level a year earlier (the Kalecki profit channel)
- Yield curve (10Y minus 3M) back above zero after an inversion in the previous 18 months
- Fed Senior Loan Officer Opinion Survey: net share of banks tightening business lending standards up 10+ points in 6 months
- ICE BofA US High Yield option-adjusted spread 1+ point above its 12-month low
- Moody's Baa corporate yield spread over 10-year Treasuries 0.3+ point above its 12-month low
3) IMMINENT STATE
IMMINENT = pop window open AND at least 2 triggers firing (adjustable from 1 to 5).
It combines a fragile regime with confirmed financing stress. In the historical data it has been rare — roughly seven episodes since the late 1980s — which is what makes it informative.
4) AI CYCLE MONITOR — context layer
The current AI infrastructure build-out is financed partly outside the credit aggregates above: hyperscaler bond issuance, private credit and off-balance-sheet data-centre vehicles. To keep this cycle visible, a separate context layer tracks:
- AI capex boom
The 3-year rise in IT-equipment investment relative to GDP ranks in its top 20%, while real semiconductor-index (SOX) growth ranks in its top third.
- Semiconductor break
The semiconductor index falls 15% or more against the equity index from its 12-month relative high.
- AI stress
Within 24 months of an AI capex boom, a semiconductor break occurs together with at least one financing trigger.
This layer is for monitoring only and does not feed the IMMINENT state. The closest historical analogue — the 1995–2001 telecom and internet capex cycle — does not provide enough independent cases to validate timing, and the rules tested did not improve historical reliability. It is labelled as context everywhere in the script.
━━━━━━━━━━━━━━━━━━━━━━━━━━━━━━━━━━━━━━━━
HOW TO READ IT
PRICE CHART
- Pink background with a "◆ IMMINENT" label: pop window plus financing stress. Hover over the label to see which triggers were active when the state began. The pink deepens as more triggers fire.
- Optional amber background with a "◇ pop window" label: the credit boom is decelerating but financing stress is not yet confirmed.
- Optional cyan background with a "◇ AI stress" label: AI context layer.
By default only the IMMINENT state is drawn, keeping the price chart clean.
LOWER PANE — WARNING-LIGHT COLUMNS
The columns show how many of 11 warning lights are on (0–11):
- deep navy → steel blue → gold → red as lights accumulate
- amber when a pop window is open
- pink when the clock is IMMINENT
Dotted guides mark 3 and 6 lights. A thin edge line traces the count over time.
LOWER PANE — SCOREBOARD
A compact table shows each light with ✔ (calm) or ⚠ (warning) and its current reading, grouped as:
CREDIT CYCLE
- Household credit boom
- Corporate credit boom
- Asset boom (stocks / houses)
- Credit decelerating after boom (pop window)
FINANCING STRESS
- Corporate profits falling
- Yield curve un-inverted
- Banks tightening lending
- High-yield spread widening
- Baa spread widening
AI CYCLE (context)
- AI capex boom
- Semiconductors breaking vs index
The header shows the total (for example "3/11") and the current state. Every raw value is also available in TradingView's Data Window.
━━━━━━━━━━━━━━━━━━━━━━━━━━━━━━━━━━━━━━━━
SETTINGS
Model
- Equity index used for the asset-boom test (default TVC:SPX)
- Triggers required for IMMINENT (default 2)
- Credit-impulse smoothing in quarters (default 2)
Price chart
- IMMINENT background and label (on)
- Pop-window background and label (off)
- Trigger-intensity shading (on)
AI cycle monitor
- Show in lower pane (on)
- AI-stress background and label on price chart (off)
- Semiconductor index symbol (default NASDAQ:SOX)
Lower pane
- Scoreboard on/off and position
- Warning-light columns on/off
- Optional detail curves on a 0–100 scale: credit fuel, financing stress, asset boom and AI capex gauge (switch off the columns to read them)
━━━━━━━━━━━━━━━━━━━━━━━━━━━━━━━━━━━━━━━━
ALERTS
- IMMINENT started
- IMMINENT ended
- Pop window opened
- Trigger count increased
- Warning lights increased
- AI capex boom
- AI stress
━━━━━━━━━━━━━━━━━━━━━━━━━━━━━━━━━━━━━━━━
DATA AND NON-REPAINTING DESIGN
All inputs are public FRED series that update automatically on TradingView, so nothing needs to be entered by hand:
household debt (CMDEBT), non-financial corporate debt (BCNSDODNS), GDP, FHFA house price index (USSTHPI), CPI (CPIAUCSL), corporate profits (CP), 10-year and 3-month Treasury yields (GS10, TB3MS), Senior Loan Officer Survey (DRTSCILM), ICE BofA High Yield OAS (BAMLH0A0HYM2), Moody's Baa yield (DBAA) and IT-equipment investment (Y033RC1Q027SBEA), plus the chosen equity and semiconductor indices.
Each series is shifted by its publication lag (quarterly Z.1 and profit data are used two quarters later, for example), and all higher-timeframe requests read confirmed, completed periods only. Historical readings therefore reflect what was knowable at the time, and the signals do not repaint.
━━━━━━━━━━━━━━━━━━━━━━━━━━━━━━━━━━━━━━━━
HISTORICAL BEHAVIOUR (educational context)
On monthly data the IMMINENT state appeared ahead of or near the start of the 1990, 2000–2002, 2007–2009 and 2022 declines. It has also produced false or early signals, for example in 2005 and 2014–2015.
By design it does not register shocks that were not preceded by a credit boom, such as 1987, 1998, 2020 and 2025. Before 1990 several bear markets were driven mainly by inflation and interest rates rather than credit, and those lie largely outside what this tool measures.
Design notes: several extensions were tested and deliberately left out because they did not improve historical reliability. These were margin-debt surges, faster monthly bank and consumer credit series, and an "equity boom plus financing stress without a credit boom" path. In the data, booms became fragile through broad credit growth, and the clock stays focused on that channel.
━━━━━━━━━━━━━━━━━━━━━━━━━━━━━━━━━━━━━━━━
LIMITATIONS
- Macro data is revised and published with delays, so the clock moves slowly by design.
- There are few historical credit busts, so treat the state as context, not certainty.
- The AI Cycle Monitor has no historical validation and is labelled as context throughout.
- The script is built for the US economy and broad US equity indices.
- The script depends on TradingView's FRED data feeds; if a feed stops updating, the related reading stays at its last value.
━━━━━━━━━━━━━━━━━━━━━━━━━━━━━━━━━━━━━━━━
REFERENCES
- Hyman P. Minsky — "The Financial Instability Hypothesis" (1992); Stabilizing an Unstable Economy (1986)
- Michał Kalecki — Theory of Economic Dynamics (profit equation)
- Robin Greenwood, Samuel G. Hanson, Andrei Shleifer, Jakob Ahm Sørensen — "Predictable Financial Crises", Journal of Finance (2022)
- Bank for International Settlements — research on credit-to-GDP gaps and on the financing of the AI infrastructure boom
- Federal Reserve Board — Z.1 Financial Accounts; Senior Loan Officer Opinion Survey
━━━━━━━━━━━━━━━━━━━━━━━━━━━━━━━━━━━━━━━━
DISCLAIMER
This script is for educational and research purposes only. It does not provide investment, financial or trading advice and does not recommend any action. Past behaviour of any indicator does not guarantee future results. Always do your own research.
Script de código aberto
Em verdadeiro espírito do TradingView, o criador deste script o tornou de código aberto, para que os traders possam revisar e verificar sua funcionalidade. Parabéns ao autor! Embora você possa usá-lo gratuitamente, lembre-se de que a republicação do código está sujeita às nossas Regras da Casa.

Aviso legal
As informações e publicações não se destinam a ser, e não constituem, conselhos ou recomendações financeiras, de investimento, comerciais ou de outro tipo fornecidos ou endossados pela TradingView. Leia mais nos Termos de Uso.
Script de código aberto
Em verdadeiro espírito do TradingView, o criador deste script o tornou de código aberto, para que os traders possam revisar e verificar sua funcionalidade. Parabéns ao autor! Embora você possa usá-lo gratuitamente, lembre-se de que a republicação do código está sujeita às nossas Regras da Casa.
Aviso legal
As informações e publicações não se destinam a ser, e não constituem, conselhos ou recomendações financeiras, de investimento, comerciais ou de outro tipo fornecidos ou endossados pela TradingView. Leia mais nos Termos de Uso.