Key Levels Map [JOAT]
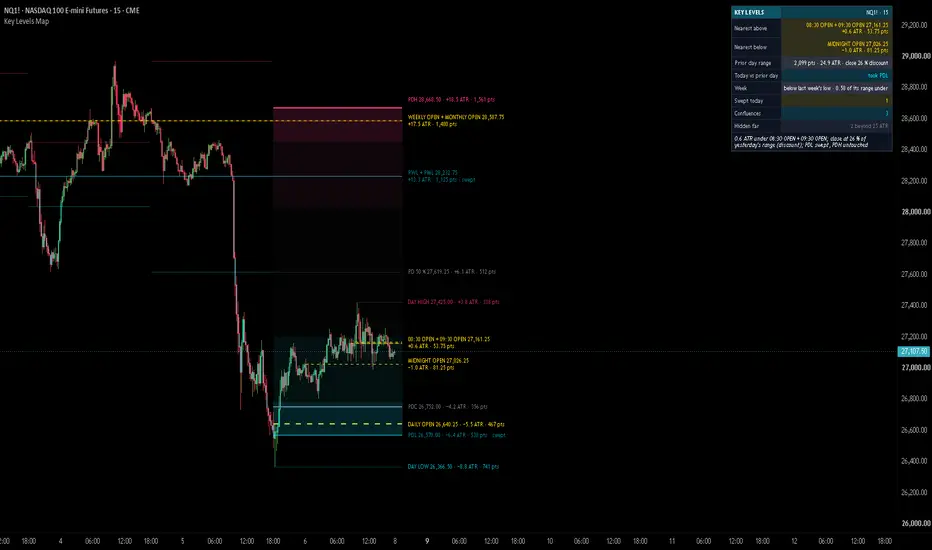
Key Levels Map is an open-source overlay that draws the previous-period levels most intraday traders mark by hand every morning: the prior day, prior week and prior month highs and lows, the prior day close, the daily, weekly and monthly opens, and the midnight, 08:30 and 09:30 opens. It draws each level once, from the bar where it became valid, and puts the numbers on the tag: the price, the signed distance from the close in ATR, and the same distance in points.
The levels themselves are not new. What the indicator adds is bookkeeping that is tedious to do by hand: levels that sit on top of each other are merged into one confluence tag, a high or low that price has traded through is marked "swept" with how many bars ago, levels too far away to matter on the current timeframe are kept off the chart so they do not squash the price scale, and a compact dashboard lists the nearest level on each side, where the close sits in yesterday's range, and what has been swept today. Every number on the dashboard is also drawn on the chart, and every dashboard row and level tag has a tooltip explaining how ICT / SMC traders usually read that level.
The colours follow one rule everywhere: highs (PDH, PWH, PMH, the developing day high, the top of the prior-day band) are drawn in the bear colour, lows in the bull colour, opens in the accent colour and the prior day close in neutral.

Core Concepts
1. Settled previous-period values
The prior day, week and month levels come from three higher-timeframe requests. Every completed-period value is read with a one-bar offset on the higher timeframe, the standard non-repainting pattern: the value only changes when the new period starts, and it is the same in history as it was live. The distance on every tag is measured from the close in ATR(14) of the chart and in price units:
Pine Script®
Here tfD is "D" on intraday charts (never a timeframe lower than the chart), atrK is ta.atr(14) of the chart, and f_pts prints the points as a whole number from 100 up (428 pts, 1,233 pts) and at tick precision below that (42.25 pts).
The current-period open in that request is only used to seed the level when the chart's history begins in the middle of a day, week or month. Every other open is taken from the chart's own first bar of the period, at the moment that bar opens.
2. Opens on the chart clock
The daily, weekly and monthly opens are the open of the first chart bar of the exchange day, week and month. The midnight, 08:30 and 09:30 opens are read on a selectable clock (New York by default). On a 1 hour chart the "08:30 open" is the open of the bar that contains 08:30, which is the 08:00 bar; the tooltip says so. These three opens are drawn on charts of 1 hour and below and are retired when the next exchange day starts, so yesterday's 08:30 open is never shown as today's.
3. Confluence merge
All enabled levels are sorted by price. Levels closer together than a fraction of ATR (0.15 by default) form one cluster: one tag "PDH + PWH 24,550.25 · +0.8 ATR · 42.00 pts" and one line with a soft glow. The tag tooltip lists every member with its own price, distance and reading. A tag longer than 42 characters (a long confluence such as "WEEKLY OPEN + MONTHLY OPEN") wraps onto two lines, name and price above the line, distance below, so no tag runs off the right edge; the lane layout reserves twice the height for it.
4. Sweeps
A high is swept when a closed bar trades above it, a low when a closed bar trades below it (the wick counts). The line dims and the tag ends in " · swept"; how many bars ago is in the tag tooltip. Opens and the prior day close are references, not liquidity, so they are never marked swept. A swept level can be kept dimmed or hidden.
5. Hide distance and scale protection
A monthly level 300 ATR away would flatten a 1-minute chart into a line. Levels farther than 25 ATR from the close (adjustable) are not drawn; the dashboard counts and lists them under "Hidden far". Past periods' lines follow the same idea: a finished level only leaves its faint history line when its period's range, the level included, fits inside twice the hide distance.
6. Prior-day range band
Across today the prior day's range is drawn as a very faint band, stronger near its edges (high colour at the top, low colour at the bottom), with a dotted 50 % line tagged "PD 50 %". The range in points and ATR and where the close sits in it, labelled premium (above 50 %), discount (below 50 %) or above / below the range, are on the dashboard's "Prior day range" row and in the PD 50 % tooltip, so the band carries no tag of its own that could collide with the right-edge tags.

Features
Input Parameters
Theme:
Limits (free account):
Dashboard:
Candles:
Daily levels:
Weekly / monthly levels:
Intraday opens:
Developing day:
Confluence & distance:
Range bands:
Display:
How to Use This Indicator
Reading the tags
Each tag reads name, price, then the distance from the current close: "PDL 26,571.75 · −8.0 ATR · 428 pts" means PDL is 8 ATR and 428 points below the close, a plus sign means above. Distances of 100 points or more are rounded to whole points. A dim tag ending in " · swept" is a high or low a closed bar has already traded through; hover it for how many bars ago. A tag such as "PDH + PWH" is a confluence: several levels within the tolerance, drawn as one line with a glow. Hover any tag for the full member list and how ICT / SMC traders read each level.
Reading the colours
Highs are in the bear colour, lows in the bull colour, opens in the accent colour (dashed), the prior day close in neutral. In the black / white preset the highs are dashed and the lows solid, so direction is carried by line style instead of colour.
Reading the band
The band shows yesterday's range across today. Its 50 % is equilibrium in ICT terms: above it price sits in yesterday's premium, below it in yesterday's discount. The dashboard's "Prior day range" row gives the range size and the close's position as a percentage (0 % = PDL, 100 % = PDH); the PD 50 % tooltip repeats it.
Reading the dashboard
Nearest above / below name the closest drawn level on each side with the same numbers as its tag. Today vs prior day reports whether today has traded above PDH, below PDL, both (outside day) or neither (inside day so far), counting the live bar. Week places the close in last week's range: "at 72 % of last week's range (premium)" inside it, or "below last week's low · 0.63 of its range under" outside it (0.63 = 63 % of the week's range past the low); the range size is in the row tooltip. Swept today, Confluences and Hidden far each list their levels in the row tooltip. The Read line repeats these numbers in one sentence, wrapped onto a second line past about 60 characters so the table stays narrow; it never says which way price will go.
Timeframes
Built for 1 minute to 1 hour. On 4 hour charts the daily and higher levels are drawn but the intraday opens are not. On daily and higher charts only the weekly and monthly levels are drawn.
Indicator Limitations
Originality Statement
Disclaimer
This indicator is provided for educational and informational purposes only. It is not financial advice. Trading involves substantial risk of loss. The levels drawn are prices from completed periods and opens; they describe where price has been, not where it will go. Past behaviour at any level does not predict future behaviour. The author accepts no responsibility for trading losses resulting from use of this indicator.
Made with passion by jackofalltrades
The levels themselves are not new. What the indicator adds is bookkeeping that is tedious to do by hand: levels that sit on top of each other are merged into one confluence tag, a high or low that price has traded through is marked "swept" with how many bars ago, levels too far away to matter on the current timeframe are kept off the chart so they do not squash the price scale, and a compact dashboard lists the nearest level on each side, where the close sits in yesterday's range, and what has been swept today. Every number on the dashboard is also drawn on the chart, and every dashboard row and level tag has a tooltip explaining how ICT / SMC traders usually read that level.
The colours follow one rule everywhere: highs (PDH, PWH, PMH, the developing day high, the top of the prior-day band) are drawn in the bear colour, lows in the bull colour, opens in the accent colour and the prior day close in neutral.
Core Concepts
1. Settled previous-period values
The prior day, week and month levels come from three higher-timeframe requests. Every completed-period value is read with a one-bar offset on the higher timeframe, the standard non-repainting pattern: the value only changes when the new period starts, and it is the same in history as it was live. The distance on every tag is measured from the close in ATR(14) of the chart and in price units:
Here tfD is "D" on intraday charts (never a timeframe lower than the chart), atrK is ta.atr(14) of the chart, and f_pts prints the points as a whole number from 100 up (428 pts, 1,233 pts) and at tick precision below that (42.25 pts).
The current-period open in that request is only used to seed the level when the chart's history begins in the middle of a day, week or month. Every other open is taken from the chart's own first bar of the period, at the moment that bar opens.
2. Opens on the chart clock
The daily, weekly and monthly opens are the open of the first chart bar of the exchange day, week and month. The midnight, 08:30 and 09:30 opens are read on a selectable clock (New York by default). On a 1 hour chart the "08:30 open" is the open of the bar that contains 08:30, which is the 08:00 bar; the tooltip says so. These three opens are drawn on charts of 1 hour and below and are retired when the next exchange day starts, so yesterday's 08:30 open is never shown as today's.
3. Confluence merge
All enabled levels are sorted by price. Levels closer together than a fraction of ATR (0.15 by default) form one cluster: one tag "PDH + PWH 24,550.25 · +0.8 ATR · 42.00 pts" and one line with a soft glow. The tag tooltip lists every member with its own price, distance and reading. A tag longer than 42 characters (a long confluence such as "WEEKLY OPEN + MONTHLY OPEN") wraps onto two lines, name and price above the line, distance below, so no tag runs off the right edge; the lane layout reserves twice the height for it.
4. Sweeps
A high is swept when a closed bar trades above it, a low when a closed bar trades below it (the wick counts). The line dims and the tag ends in " · swept"; how many bars ago is in the tag tooltip. Opens and the prior day close are references, not liquidity, so they are never marked swept. A swept level can be kept dimmed or hidden.
5. Hide distance and scale protection
A monthly level 300 ATR away would flatten a 1-minute chart into a line. Levels farther than 25 ATR from the close (adjustable) are not drawn; the dashboard counts and lists them under "Hidden far". Past periods' lines follow the same idea: a finished level only leaves its faint history line when its period's range, the level included, fits inside twice the hide distance.
6. Prior-day range band
Across today the prior day's range is drawn as a very faint band, stronger near its edges (high colour at the top, low colour at the bottom), with a dotted 50 % line tagged "PD 50 %". The range in points and ATR and where the close sits in it, labelled premium (above 50 %), discount (below 50 %) or above / below the range, are on the dashboard's "Prior day range" row and in the PD 50 % tooltip, so the band carries no tag of its own that could collide with the right-edge tags.
Features
- Prior day: PDH, PDL and PDC, drawn from the first bar of the exchange day
- Prior week and month: PWH, PWL, PMH and PML, drawn from the first bar of the week / month
- Opens: daily, weekly, monthly, plus the midnight, 08:30 and 09:30 opens on a selectable clock
- Data on every tag: name, price, signed distance in ATR(14) and in points, and "swept" once traded through (bars ago in the tooltip), never smaller than Small text
- Tooltips that teach: every level tag and every dashboard row explains how ICT / SMC traders read that level
- Confluence tags: stacked levels share one tag and a glowing line
- Developing day high / low: dotted rails from the bar that made them, with price and distance
- Prior-day range band: faint gradient band across today and its 50 %; range size and premium / discount on the dashboard and the PD 50 % tooltip
- Past periods' levels: optional faint untagged lines where finished levels used to be
- Right-edge lane layout: tags are placed nearest-to-price first and pushed apart so they never overlap, with a gap that widens when the drawn span is large; tags over 42 characters wrap onto two lines and take two lanes
- Dashboard: nearest level above and below, prior day range and close position, today versus the prior day (inside, took PDH, took PDL, outside), the prior week, levels swept today, confluences, levels hidden for distance, and a one-line Read written only from those numbers
- Candle paint (optional): premium / discount gradient in the same roles as the levels, or a single mono colour
- Themes: six presets including a clean black / white preset, plus a Custom set, a brightness control, and automatic light / dark chart detection
- Alert: "Key level swept" when a closed bar trades through a prior high or low
- Free-account safe: built for 5,000 bars of history, three requests to the daily / weekly / monthly timeframe only, every drawing capped and clamped
Input Parameters
Theme:
- Theme: six named presets plus Custom (default JOAT Signature); Custom uses the colour pickers below
- Brightness: 1 (faint) to 5 (vivid), default 3; scales every fill and glow
- Chart background: Auto, Dark or Light (default Auto reads the chart's background)
- Custom bull / bear, Custom accent / neutral, Custom text / panel, Custom glow: colours for the Custom preset
Limits (free account):
- Max lines kept: past periods' level lines kept before the oldest are deleted (default 60)
Dashboard:
- Show dashboard (default on)
- Dashboard position: nine positions (default Top Right)
- Dashboard size: Tiny, Small, Normal, Large (default Small)
- Compact dashboard: header, the nearest level and the Read line only, for phones (default off)
- Tinted value cells (default on)
Candles:
- Candle paint: Off, Score (premium / discount gradient by the close's position in the prior-day range; prior week on daily and weekly charts, prior month on monthly) or Mono (default Off)
Daily levels:
- PDH prior day high, PDL prior day low, PDC prior day close, Daily open (all on; intraday charts only)
Weekly / monthly levels:
- PWH prior week high, PWL prior week low, Weekly open, PMH prior month high, PML prior month low, Monthly open (all on)
Intraday opens:
- Opens time zone: the clock the midnight, 08:30 and 09:30 opens are read on (default America/New_York; Exchange = the symbol's own time zone)
- Midnight open, 08:30 open, 09:30 open (all on; charts of 1 hour and below)
Developing day:
- Day high / low rails (default on)
Confluence & distance:
- Confluence tolerance (ATR): levels closer than this merge into one tag (default 0.15; 0 = never merge)
- Hide levels farther than (ATR): levels beyond this distance from the close are not drawn (default 25)
- Hide swept levels: remove a level once it is swept instead of dimming it (default off)
- Past periods' levels: Off, Highs / lows or All levels (default Highs / lows)
Range bands:
- Prior-day range band (default on)
- Prior-day 50 % (default on)
- Band edge transparency: 60 to 99 (default 90)
Display:
- Right extension (bars): how far past the last candle the live levels reach and where their tags sit (default 6)
- Label size: Small, Normal, Large (default Small; Small is the floor because every tag carries numbers); the secondary tags (day high / low, PD 50 %) are one size smaller at Normal and Large and never below Small, told apart by their fainter colour
- Label lane gap (ATR): minimum vertical distance between right-edge tags (default 0.35)
How to Use This Indicator
Reading the tags
Each tag reads name, price, then the distance from the current close: "PDL 26,571.75 · −8.0 ATR · 428 pts" means PDL is 8 ATR and 428 points below the close, a plus sign means above. Distances of 100 points or more are rounded to whole points. A dim tag ending in " · swept" is a high or low a closed bar has already traded through; hover it for how many bars ago. A tag such as "PDH + PWH" is a confluence: several levels within the tolerance, drawn as one line with a glow. Hover any tag for the full member list and how ICT / SMC traders read each level.
Reading the colours
Highs are in the bear colour, lows in the bull colour, opens in the accent colour (dashed), the prior day close in neutral. In the black / white preset the highs are dashed and the lows solid, so direction is carried by line style instead of colour.
Reading the band
The band shows yesterday's range across today. Its 50 % is equilibrium in ICT terms: above it price sits in yesterday's premium, below it in yesterday's discount. The dashboard's "Prior day range" row gives the range size and the close's position as a percentage (0 % = PDL, 100 % = PDH); the PD 50 % tooltip repeats it.
Reading the dashboard
Nearest above / below name the closest drawn level on each side with the same numbers as its tag. Today vs prior day reports whether today has traded above PDH, below PDL, both (outside day) or neither (inside day so far), counting the live bar. Week places the close in last week's range: "at 72 % of last week's range (premium)" inside it, or "below last week's low · 0.63 of its range under" outside it (0.63 = 63 % of the week's range past the low); the range size is in the row tooltip. Swept today, Confluences and Hidden far each list their levels in the row tooltip. The Read line repeats these numbers in one sentence, wrapped onto a second line past about 60 characters so the table stays narrow; it never says which way price will go.
Timeframes
Built for 1 minute to 1 hour. On 4 hour charts the daily and higher levels are drawn but the intraday opens are not. On daily and higher charts only the weekly and monthly levels are drawn.
Indicator Limitations
- Distances in ATR use ATR(14) of the chart's own timeframe, so the same level reads as a larger ATR distance on a 1-minute chart than on a 1-hour chart. The "pts" figure is in the symbol's price units (dollars on stocks, points on futures)
- The day boundary is the exchange day of the symbol (18:00 New York on CME futures, the session open on stocks), not midnight. On stocks the prior-day levels follow whichever session setting the chart and daily data use
- Levels beyond the hide distance are not drawn at all. On a 1-minute chart this often includes the prior week and month levels and, on wide days, PDH or PDL. Raise "Hide levels farther than (ATR)" to draw them, at the cost of a compressed price scale
- A sweep is marked only when the bar closes. The "Today vs prior day" dashboard row counts the live bar, so it can show "took PDH" before the PDH tag shows "swept"
- The intraday opens are the open of the chart bar that contains the minute, which is only the exact minute on charts of that resolution or finer
- On continuous futures contracts a roll can shift price relative to levels taken from before the roll
- A Basic TradingView account loads about 5,000 bars, which is roughly three and a half days on a 1-minute chart. Past periods' lines therefore only reach back that far, and level lines that began earlier start at the oldest loaded bar
- The indicator draws levels and measures distances. It does not say whether a level will hold or break, and it gives no entries, exits or targets
Originality Statement
- Each level is tagged with its signed distance from the close in both ATR and points, and the tag tooltip explains how ICT / SMC traders read that level, so the chart itself carries the data and the reading rather than a separate legend
- Confluent levels are merged by an ATR tolerance into one tag and one glowing line instead of being stacked as overlapping labels, and the right-edge tags are laid out nearest-to-price first with a lane gap that widens with the drawn span, so they stay apart on a compressed 1-minute scale
- A distance-based hide rule keeps far higher-timeframe levels off low-timeframe charts and reports them on the dashboard instead, and past periods' lines obey a matching range rule, so the price scale stays usable from 1 minute to 1 hour
- Every dashboard number has a drawn counterpart on the chart, and the one-line Read is written only from those numbers, never as a direction call
Disclaimer
This indicator is provided for educational and informational purposes only. It is not financial advice. Trading involves substantial risk of loss. The levels drawn are prices from completed periods and opens; they describe where price has been, not where it will go. Past behaviour at any level does not predict future behaviour. The author accepts no responsibility for trading losses resulting from use of this indicator.
Made with passion by jackofalltrades

The Proven Highest Win Rate Trading Indicators, Strategies, Tools, + Signals !! 🃏
Get Access and See Full Results👇
jackofalltrades.vip 🌐
Get Access and See Full Results👇
jackofalltrades.vip 🌐
Aviso legal
As informações e publicações não se destinam a ser, e não constituem, conselhos ou recomendações financeiras, de investimento, comerciais ou de outro tipo fornecidos ou endossados pela TradingView. Leia mais nos Termos de Uso.
The Proven Highest Win Rate Trading Indicators, Strategies, Tools, + Signals !! 🃏
Get Access and See Full Results👇
jackofalltrades.vip 🌐
Get Access and See Full Results👇
jackofalltrades.vip 🌐
Aviso legal
As informações e publicações não se destinam a ser, e não constituem, conselhos ou recomendações financeiras, de investimento, comerciais ou de outro tipo fornecidos ou endossados pela TradingView. Leia mais nos Termos de Uso.