OPEN-SOURCE SCRIPT
Atualizado Horistic Vision
Copia e cola esta versão:
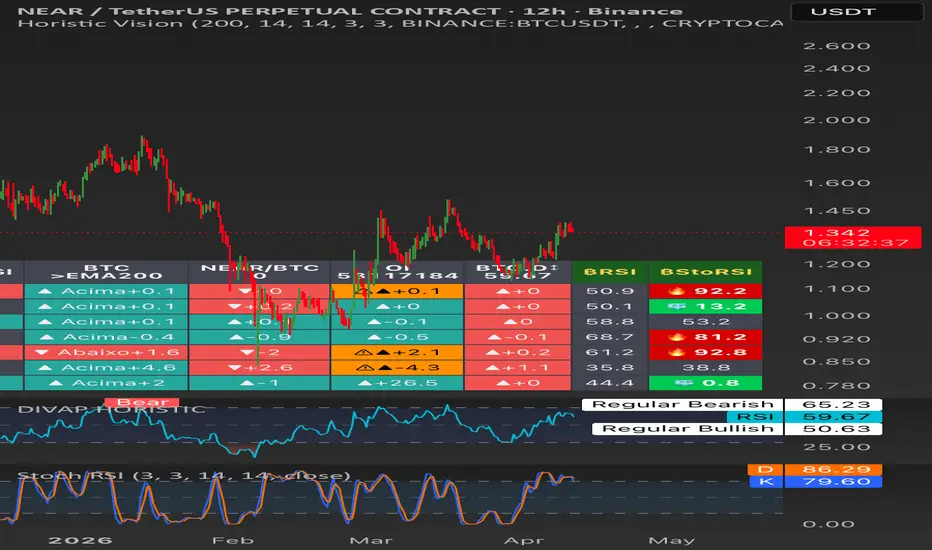
Horistic Vision v3.0 — Multi-Timeframe Confluence Dashboard
One table. Every timeframe. All the signals you need to decide: LONG, SHORT, or stay out.
How it works:
Each row is a timeframe (5m to 1M). Each column is a different data point. Everything feeds into a single Confluence Score.
Core columns:
Trend — price above or below the EMA 200 (the most respected level in the market)
RSI — overbought (≥70) and oversold (≤30) zones
StoRSI — Stochastic RSI, faster than RSI, works as an early warning system
Score — sums all signals. Strong green = bullish confluence. Strong red = bearish. Gray = stay out
Extra columns (toggle on/off):
BTC (price vs EMA200), Open Interest, BTC Dominance, USDT Dominance, Pair vs BTC, TOTAL/TOTAL2, SPX500, L/S Ratio, Funding Rate
Features:
Smart auto-limit: never exceeds TradingView's 40 security() call limit
Divergence detection (⚠ amber): flags when price and sentiment disagree
Dedicated ₿RSI and ₿StoRSI: Bitcoin RSI and Stochastic RSI with strong visual cues (🔥 overbought / 🧊 oversold)
Auto color inversion for altcoins (BTC.D, USDT.D)
Auto-hide: BTC columns disappear on BTC charts (no redundancy)
Anti-repainting
Alerts for confluence, extreme RSI, divergences, and BTC extreme zones
Quick read:
Score — the verdict. Green = good conditions. Gray = don't trade.
Trend — confirms if macro structure supports your direction.
RSI + StoRSI — both extreme at the same time = strong signal.
🔥 / 🧊 — BTC in extreme zone moves everything.
⚠ amber — divergences are the most valuable signals.
Compare TFs — all agree = high confidence.
Horistic Vision v3.0 — Multi-Timeframe Confluence Dashboard
One table. Every timeframe. All the signals you need to decide: LONG, SHORT, or stay out.
How it works:
Each row is a timeframe (5m to 1M). Each column is a different data point. Everything feeds into a single Confluence Score.
Core columns:
Trend — price above or below the EMA 200 (the most respected level in the market)
RSI — overbought (≥70) and oversold (≤30) zones
StoRSI — Stochastic RSI, faster than RSI, works as an early warning system
Score — sums all signals. Strong green = bullish confluence. Strong red = bearish. Gray = stay out
Extra columns (toggle on/off):
BTC (price vs EMA200), Open Interest, BTC Dominance, USDT Dominance, Pair vs BTC, TOTAL/TOTAL2, SPX500, L/S Ratio, Funding Rate
Features:
Smart auto-limit: never exceeds TradingView's 40 security() call limit
Divergence detection (⚠ amber): flags when price and sentiment disagree
Dedicated ₿RSI and ₿StoRSI: Bitcoin RSI and Stochastic RSI with strong visual cues (🔥 overbought / 🧊 oversold)
Auto color inversion for altcoins (BTC.D, USDT.D)
Auto-hide: BTC columns disappear on BTC charts (no redundancy)
Anti-repainting
Alerts for confluence, extreme RSI, divergences, and BTC extreme zones
Quick read:
Score — the verdict. Green = good conditions. Gray = don't trade.
Trend — confirms if macro structure supports your direction.
RSI + StoRSI — both extreme at the same time = strong signal.
🔥 / 🧊 — BTC in extreme zone moves everything.
⚠ amber — divergences are the most valuable signals.
Compare TFs — all agree = high confidence.
Notas de Lançamento
Here's the updated TradingView publication description in English:Horistic Vision — Multi-Timeframe Confluence Dashboard
A real-time, multi-timeframe analysis dashboard that brings together trend, momentum, and market structure into a single compact overlay table.
Core Columns (per timeframe):
Trend — Price position relative to EMA 200 (▲ Acima / ▼ Abaixo), RSI (14) with color-coded overbought/oversold zones, and Stochastic RSI with extreme zone detection.
Extra Columns (toggleable):
BTC price & trend vs EMA 200, pair vs BTC, Open Interest, BTC Dominance (inverted for alts), USDT Dominance (inverted for crypto), Total & Total2 Market Cap, SPX500, BTC Longs, and estimated Funding Rate.
₿RSI & ₿StoRSI (toggleable):
Dedicated Bitcoin momentum columns with vivid visual indicators — 🔥 for overbought extremes, 🧊 for oversold extremes. A strong signal layer for any altcoin chart.
Smart Features:
Auto-limit system respects TradingView's 40 security() call budget. Divergence detection (⚠) flags when OI or Longs/Shorts disagree with price direction. Auto-hides redundant BTC columns when viewing BTC charts. Anti-repainting with confirmed bar data only.
Alerts:
Divergence warnings on HTF, BTC RSI/StochRSI extreme zone alerts, and main symbol RSI extreme alerts on swing timeframes (4h+).
Fully customizable: choose your timeframes, toggle any column on/off, adjust EMA period, RSI/StochRSI parameters, table position, and font size.
Script de código aberto
Em verdadeiro espírito do TradingView, o criador deste script o tornou de código aberto, para que os traders possam revisar e verificar sua funcionalidade. Parabéns ao autor! Embora você possa usá-lo gratuitamente, lembre-se de que a republicação do código está sujeita às nossas Regras da Casa.

Aviso legal
As informações e publicações não se destinam a ser, e não constituem, conselhos ou recomendações financeiras, de investimento, comerciais ou de outro tipo fornecidos ou endossados pela TradingView. Leia mais nos Termos de Uso.
Script de código aberto
Em verdadeiro espírito do TradingView, o criador deste script o tornou de código aberto, para que os traders possam revisar e verificar sua funcionalidade. Parabéns ao autor! Embora você possa usá-lo gratuitamente, lembre-se de que a republicação do código está sujeita às nossas Regras da Casa.
Aviso legal
As informações e publicações não se destinam a ser, e não constituem, conselhos ou recomendações financeiras, de investimento, comerciais ou de outro tipo fornecidos ou endossados pela TradingView. Leia mais nos Termos de Uso.