OPEN-SOURCE SCRIPT
Historical Returns [BigBeluga]
🔵 OVERVIEW
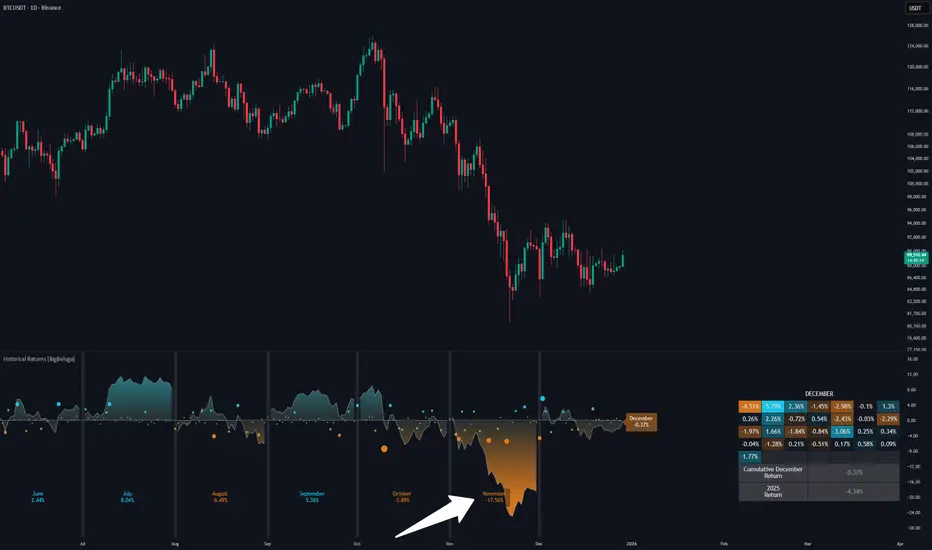
The Historical Returns [BigBeluga] indicator visualizes daily and monthly return data to help traders assess seasonal performance and volatility behavior. It provides a clean and informative dashboard showing the current month’s daily return bubbles, monthly return curves, and a snapshot of the current month and year performance. This tool is ideal for spotting recurring return patterns and understanding the broader profitability context of a symbol.
🔵 CONCEPTS
🔵 FEATURES
🔵 HOW TO USE
🔵 CONCLUSION
Historical Returns [BigBeluga] is your visual companion for return analytics — helping you identify profitable months, detect volatility surges, and understand historical seasonality at a glance. With a clean dashboard and insightful overlays, this tool supports better timing and improved statistical edge in both short- and long-term trades.
The Historical Returns [BigBeluga] indicator visualizes daily and monthly return data to help traders assess seasonal performance and volatility behavior. It provides a clean and informative dashboard showing the current month’s daily return bubbles, monthly return curves, and a snapshot of the current month and year performance. This tool is ideal for spotting recurring return patterns and understanding the broader profitability context of a symbol.
🔵 CONCEPTS
- Daily Return Bubbles: Each trading day is analyzed for its return percentage, and plotted as a bubble with size proportional to the return magnitude.
- Monthly Performance Curves: Average or cumulative returns are calculated and plotted to show how the current month is performing relative to historical averages.
- Current Year Return: Current year performance as a single return value, giving traders context on long-term profitability.
- Current Month Average Return: Current month average performance as a single return value, giving traders context on short-term profitability.
- Extreme Return Labels: Optionally highlights daily returns above +4% or below -4% with labeled percentages for spike recognition.
🔵 FEATURES
- Shows daily return bubbles (1%–7%+), color-coded by direction.
- Labels monthly returns with the month name and percentage value.
- Displays a performance dashboard with:
- Daily return heatmap for the current month.
- Average return for the current month.
- Year-to-date return.
- Toggle between average and cumulative modes for monthly return curves.
- Clearly marks days with abnormal return spikes using optional labels.
- Clean fallback warning if not on a daily chart ("⚠️USE DAILY TIMEFRAME").
- Custom color themes for bullish and bearish values.
🔵 HOW TO USE
- Use the monthly return curve to compare how the current month is performing against historical averages.
- Look for clusters of positive or negative bubbles as signals of strong directional weeks.
- Watch extreme return labels for volatility spikes or catalyst days.
- Use year-to-date return to assess how the asset is trending in the broader macro cycle.
- Combine with other BigBeluga tools to align trades with historically favorable periods.
🔵 CONCLUSION
Historical Returns [BigBeluga] is your visual companion for return analytics — helping you identify profitable months, detect volatility surges, and understand historical seasonality at a glance. With a clean dashboard and insightful overlays, this tool supports better timing and improved statistical edge in both short- and long-term trades.
Script de código aberto
Em verdadeiro espírito do TradingView, o criador deste script o tornou de código aberto, para que os traders possam revisar e verificar sua funcionalidade. Parabéns ao autor! Embora você possa usá-lo gratuitamente, lembre-se de que a republicação do código está sujeita às nossas Regras da Casa.

🌐 bigbeluga.org/tv - Get access to our powerful tools & indicators.
🔵 Learn More -> docs.bigbeluga.org/
🔵 Join Discord -> go.bigbeluga.org/k65q9bfqfu
All content provided by BigBeluga is for educational purposes only
🔵 Learn More -> docs.bigbeluga.org/
🔵 Join Discord -> go.bigbeluga.org/k65q9bfqfu
All content provided by BigBeluga is for educational purposes only
Aviso legal
As informações e publicações não se destinam a ser, e não constituem, conselhos ou recomendações financeiras, de investimento, comerciais ou de outro tipo fornecidos ou endossados pela TradingView. Leia mais nos Termos de Uso.
Script de código aberto
Em verdadeiro espírito do TradingView, o criador deste script o tornou de código aberto, para que os traders possam revisar e verificar sua funcionalidade. Parabéns ao autor! Embora você possa usá-lo gratuitamente, lembre-se de que a republicação do código está sujeita às nossas Regras da Casa.
🌐 bigbeluga.org/tv - Get access to our powerful tools & indicators.
🔵 Learn More -> docs.bigbeluga.org/
🔵 Join Discord -> go.bigbeluga.org/k65q9bfqfu
All content provided by BigBeluga is for educational purposes only
🔵 Learn More -> docs.bigbeluga.org/
🔵 Join Discord -> go.bigbeluga.org/k65q9bfqfu
All content provided by BigBeluga is for educational purposes only
Aviso legal
As informações e publicações não se destinam a ser, e não constituem, conselhos ou recomendações financeiras, de investimento, comerciais ou de outro tipo fornecidos ou endossados pela TradingView. Leia mais nos Termos de Uso.