Indicador
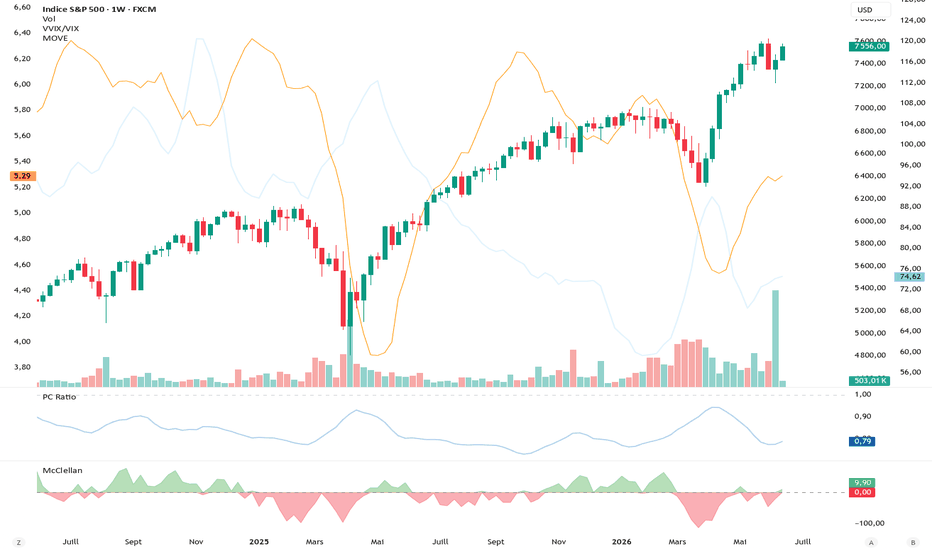
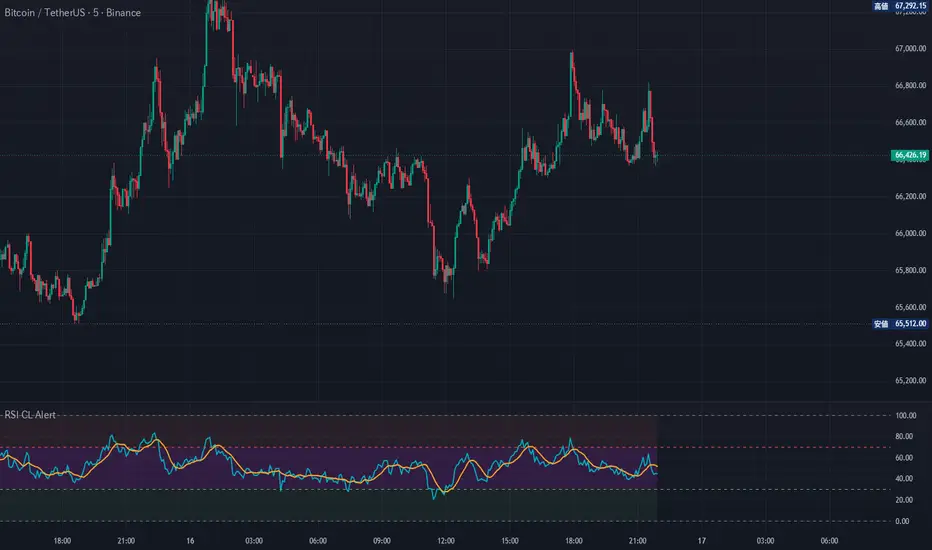
RSI Custom Level Alert█ OVERVIEW
An RSI indicator that lets you set custom overbought and oversold alert levels — because the default 70/30 doesn't work for every pair or timeframe.
The alert fires only once when RSI crosses your threshold, not repeatedly while it stays in the zone. Set it and walk away.
█ THE PROBLEM THIS SOLVES
The default RSI alert at 70/30 is too rigid. Gold tends to hover in the 60s during strong uptrends. Volatile pairs hit 70 and 30 constantly, flooding you with noise. This script lets you dial in the exact level that fits your pair and timeframe, so every alert actually means something.
█ FEATURES
● Fully adjustable overbought and oversold alert levels (default 70/30)
● Alerts fire only on the crossing bar — no zone spam
● MA overlay on RSI (SMA, EMA, SMMA/RMA, WMA, VWMA)
● MA crossover alerts included
● Color-coded overbought, oversold, and middle zones
● All colors fully customizable
█ ALERTS (4 types)
- RSI Overbought Alert — RSI crosses above your custom overbought level
- RSI Oversold Alert — RSI crosses below your custom oversold level
- RSI Crossed Above MA — RSI crosses above its moving average
- RSI Crossed Below MA — RSI crosses below its moving average
█ RECOMMENDED ALERT SETTING
When creating an alert, set the frequency to "Once Per Bar Close."
This ensures the alert fires once per confirmed bar only.
█ INPUTS
RSI Settings
- RSI Length: Lookback period for RSI calculation (default 14)
- Source: Price source (default close)
Moving Average Settings
- MA Type: SMA / EMA / SMMA(RMA) / WMA / VWMA
- MA Length: Lookback period for the MA (default 9)
Alert Levels (Custom)
- Overbought Alert Level: RSI level that triggers the overbought alert (default 70, freely adjustable)
- Oversold Alert Level: RSI level that triggers the oversold alert (default 30, freely adjustable)
Color Settings
- All zone and line colors are individually customizable Indicador
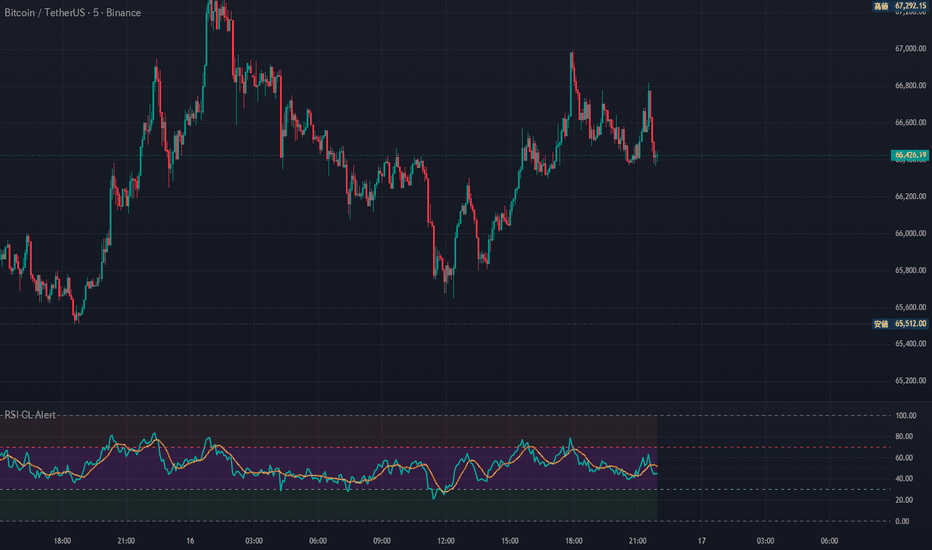
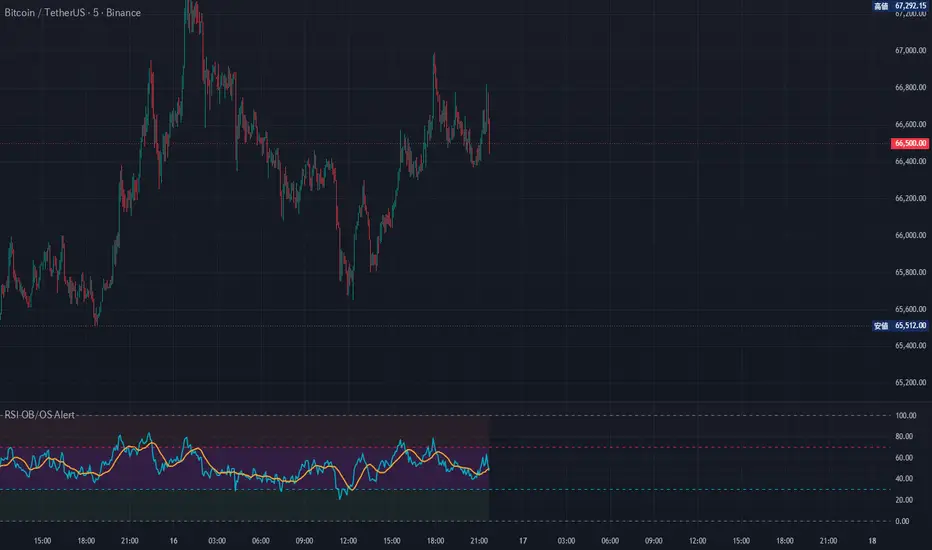
RSI Overbought Oversold Alert█ OVERVIEW
A clean RSI indicator with overbought/oversold alerts that fire only once per crossing — not repeatedly while price stays in the zone.
Built to fix a common frustration: TradingView's default RSI alert keeps firing every bar while RSI stays above or below the threshold. This script uses crossover/crossunder detection so you get notified at the moment RSI crosses the level, and nothing more until it crosses again.
█ FEATURES
● Customizable overbought and oversold levels (default 70/30)
● Alerts trigger only on the crossing bar, not throughout the zone
● MA overlay on RSI (SMA, EMA, SMMA/RMA, WMA, VWMA)
● MA crossover alerts included
● Color-coded overbought, oversold, and middle zones
● All colors fully customizable
█ ALERTS (4 types)
- RSI Overbought Alert — RSI crosses above the overbought level
- RSI Oversold Alert — RSI crosses below the oversold level
- RSI Crossed Above MA — RSI crosses above its moving average
- RSI Crossed Below MA — RSI crosses below its moving average
█ RECOMMENDED ALERT SETTING
When creating an alert, set the frequency to "Once Per Bar Close."
This ensures the alert fires once per confirmed bar, not on every tick.
█ INPUTS
RSI Settings
- RSI Length: Lookback period for RSI calculation (default 14)
- Source: Price source (default close)
Moving Average Settings
- MA Type: SMA / EMA / SMMA(RMA) / WMA / VWMA
- MA Length: Lookback period for the MA (default 14)
Alert Levels
- Overbought Level: RSI threshold for overbought alert (default 70)
- Oversold Level: RSI threshold for oversold alert (default 30)
Color Settings
- All zone and line colors are individually customizable Indicador
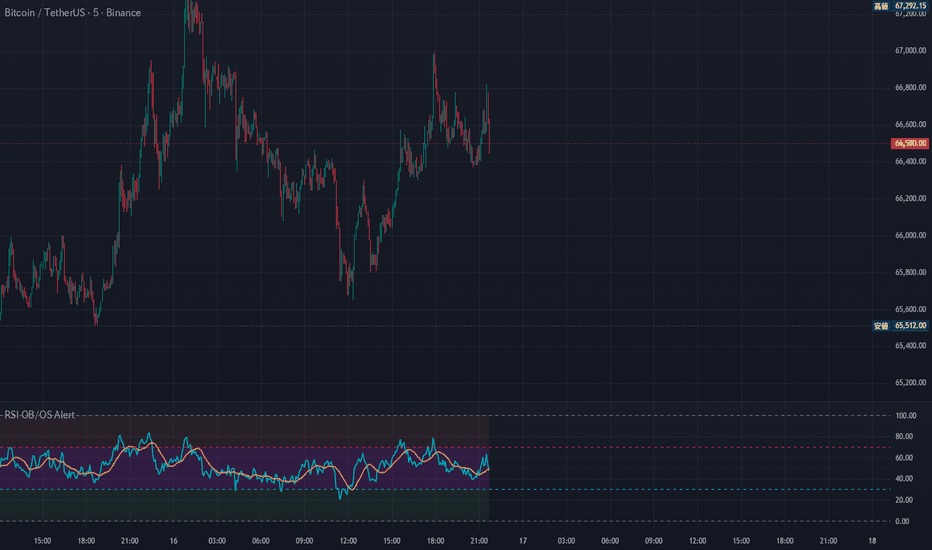
RSI Overbought Oversold Alert█ OVERVIEW
A clean RSI indicator with overbought/oversold alerts that fire only once per crossing — not repeatedly while price stays in the zone.
Built to fix a common frustration: TradingView's default RSI alert keeps firing every bar while RSI stays above or below the threshold. This script uses crossover/crossunder detection so you get notified at the moment RSI crosses the level, and nothing more until it crosses again.
█ FEATURES
● Customizable overbought and oversold levels (default 70/30)
● Alerts trigger only on the crossing bar, not throughout the zone
● MA overlay on RSI (SMA, EMA, SMMA/RMA, WMA, VWMA)
● MA crossover alerts included
● Color-coded overbought, oversold, and middle zones
● All colors fully customizable
█ ALERTS (4 types)
- RSI Overbought Alert — RSI crosses above the overbought level
- RSI Oversold Alert — RSI crosses below the oversold level
- RSI Crossed Above MA — RSI crosses above its moving average
- RSI Crossed Below MA — RSI crosses below its moving average
█ RECOMMENDED ALERT SETTING
When creating an alert, set the frequency to "Once Per Bar Close."
This ensures the alert fires once per confirmed bar, not on every tick.
█ INPUTS
RSI Settings
- RSI Length: Lookback period for RSI calculation (default 14)
- Source: Price source (default close)
Moving Average Settings
- MA Type: SMA / EMA / SMMA(RMA) / WMA / VWMA
- MA Length: Lookback period for the MA (default 14)
Alert Levels
- Overbought Level: RSI threshold for overbought alert (default 70)
- Oversold Level: RSI threshold for oversold alert (default 30)
Color Settings
- All zone and line colors are individually customizable Indicador

Acceleration + Wyckoff (Balanced) v6Hey,
I created this indicator with GROK.
I welcome all feedback, as I really don't know what i'm doing lol
Here is a summary of what I'm trying to achieve....
This is a custom momentum and acceleration indicator that combines Stan Druckenmiller’s second-derivative concept with Wyckoff Method principles. It helps traders identify potential turning points by measuring not just momentum, but the rate of change of momentum (acceleration).
It is designed to be more readable and practical than traditional Rate of Change (ROC) indicators, while providing actionable Wyckoff-style signals (Springs and Upthrusts).
Benefits
Early Reversal Detection: By focusing on acceleration (not just price or basic momentum), it can highlight potential turning points earlier than many standard indicators.
Wyckoff + Modern TA Hybrid: Combines classic Wyckoff concepts (Springs & Upthrusts) with Druckenmiller-style second-derivative thinking.
Flexible Across Assets: Works well on both individual stocks (e.g. RRL) and commodities (e.g. Gold).
Customizable: Users can adjust sensitivity, enable/disable volume filtering, and choose display styles.
Actionable Signals: Clear visual markers (green/red triangles) make it easy to spot potential high-probability setups.
Best Use Cases
Daily charts for swing trading and short-term reversals
Weekly charts for identifying larger structural shifts
Trending markets (especially useful on Gold and resource stocks)
Identifying exhaustion points in both uptrends and downtrends
Combining with other tools (volume, support/resistance, or your existing indicators)
In Summary
This indicator gives you a clearer view of momentum strength and acceleration while adding Wyckoff-inspired reversal signals. It solves common issues with traditional momentum indicators (poor scaling and late signals) and provides a practical, visual way to spot potential Springs and Upthrusts with adjustable sensitivity.
Indicador

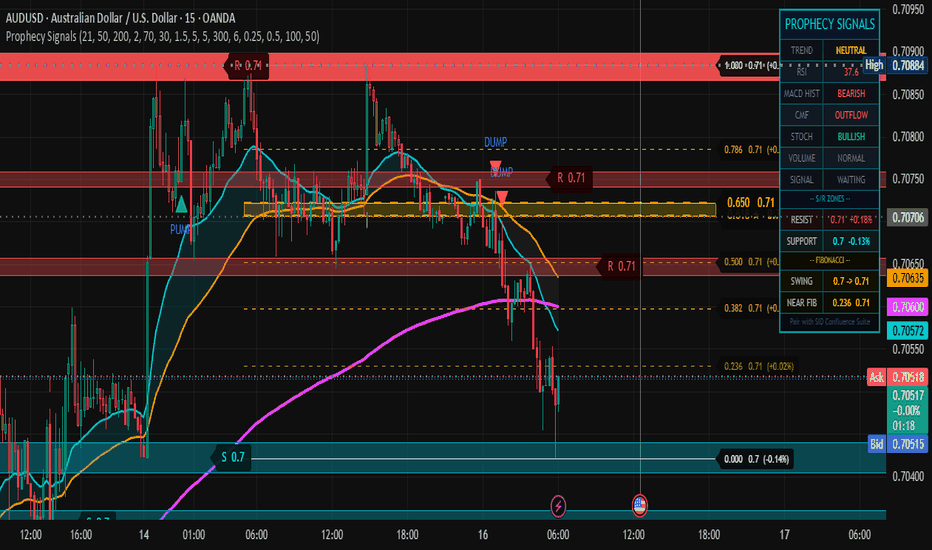
Prophecy Signals⚡ PROPHECY SIGNALS — Complete User Guide
Built for New & Experienced Traders
WHAT IS PROPHECY SIGNALS?
Prophecy Signals is a powerful all-in-one trading indicator built for TradingView. It combines multiple professional-grade tools into one clean, easy-to-read system. Instead of having 10 different indicators cluttering your chart, Prophecy Signals does the heavy lifting for you — identifying the trend, finding key price levels, and telling you exactly when high-probability trading opportunities appear.
Think of it as your personal trading assistant that never sleeps, never gets emotional, and always follows the rules.
WHO IS THIS FOR?
New traders who want a clear, structured way to read the market
Intermediate traders who want confluence-based signals instead of guessing
Day traders and swing traders across any market — Crypto, Forex, Stocks, Futures
WHAT DOES IT DO?
Prophecy Signals has 5 core engines working together at all times:
1. 📈 TREND ENGINE — "Which way is the market going?"
The trend engine uses three Exponential Moving Averages (EMAs):
EMA 21 (Fast) — shown in Cyan. Reacts quickly to price changes.
EMA 50 (Mid) — shown in Orange. Filters out short-term noise.
EMA 200 (Slow) — shown in Purple. The big picture trend line.
The Cloud fills the space between EMA 21 and EMA 50:
🔵 Teal/Cyan cloud = Bullish trend (price likely going UP)
🔴 Red cloud = Bearish trend (price likely going DOWN)
⚫ Grey cloud = No clear trend (stay cautious)
Simple rule for new traders:
If price is ABOVE the purple EMA 200 and the cloud is teal — you are in a BULL market. Only look for BUY signals.
If price is BELOW the purple EMA 200 and the cloud is red — you are in a BEAR market. Only look for SELL signals.
2. 🔊 PUMP & DUMP DETECTION — "Is big money moving?"
This engine watches for unusual buying or selling pressure by combining:
Volume Spikes — when volume is much higher than average, institutions are active
Engulfing Candles — when one candle completely swallows the previous one, it signals momentum
RSI (Relative Strength Index) — measures whether price is overbought or oversold
Signal Types:
SignalShapeWhat it meansPUMP🔺 Green triangle below candleBuying pressure detected — potential move UPDUMP🔻 Red triangle above candleSelling pressure detected — potential move DOWNSTRONG PUMP🟢 Green label below candleFull confluence bullish signal — high confidence BUY zoneSTRONG DUMP🔴 Red label above candleFull confluence bearish signal — high confidence SELL zoneMomentum Pump⬆ Green arrow below candleExplosive bullish breakout candle with volumeMomentum Dump⬇ Red arrow above candleExplosive bearish breakdown candle with volume
Important for new traders:
A STRONG PUMP only fires when ALL of these agree at the same time: trend is bullish, MACD is bullish, money is flowing in (CMF), Stochastic is crossing up, volume is spiking, and the candle body is strong. This is NOT a common signal — when it fires, pay attention.
A regular PUMP is an early warning. It does not mean you should immediately buy. Wait for confirmation.
3. 🧱 SUPPORT & RESISTANCE ZONES — "Where will price react?"
Support and Resistance (S/R) zones are price levels where the market has previously shown strong reactions. Prophecy Signals automatically finds and draws these zones for you.
How they work:
Resistance zones are drawn in 🔴 Red — these are price ceilings where selling pressure is strong
Support zones are drawn in 🔵 Teal — these are price floors where buying pressure is strong
Zone strength:
Solid, opaque zones = High strength (formed with volume spike + RSI extreme) — treat these with the most respect
Semi-transparent zones = Medium strength
Faint zones = Low strength — still relevant but less reliable
What happens at these zones:
Price approaches a resistance zone → Watch for a DUMP or reversal signal
Price approaches a support zone → Watch for a PUMP or bounce signal
Price breaks through a zone with volume → The zone is invalidated and removed automatically
Dashboard shows:
RESIST — the nearest resistance level above current price + % distance
SUPPORT — the nearest support level below current price + % distance
4. 📐 INSTITUTIONAL FIBONACCI — "Where do the big players trade?"
Fibonacci retracement is one of the most widely used tools by professional and institutional traders. It identifies key price levels based on mathematical ratios found in nature.
How to read the levels:
LevelLabelWhat it means0.000Swing BoundaryThe starting point of the move0.236Shallow RetracementMinor pullback level — weak support/resistance0.382Key Support / ResistanceStrong institutional level — watch for reactions0.500⚖ EQUILIBRIUM (EQ)The exact middle of the swing — decision zone0.618★ Golden RatioTHE most important level — where institutions enter0.650★ Golden Pocket ZonePart of the Golden Pocket with 0.6180.786Deep RetracementLast level before full reversal1.000Swing BoundaryThe end point of the move
The Golden Pocket (0.618 - 0.650) is highlighted with a gold filled zone. This is where institutional traders (banks, hedge funds, market makers) most commonly place their orders. When price enters this zone, be ready.
The Equilibrium (0.500) is highlighted in icy blue. This is the fair value midpoint. When price is ABOVE the EQ, it is in a premium zone (expensive). When price is BELOW the EQ, it is in a discount zone (cheap). Smart traders buy in discount and sell in premium.
Each label shows:
The ratio name and description
The exact price value
The percentage distance from current price (+ means above, - means below)
5. 📊 DASHBOARD — "What is the market telling me right now?"
The dashboard sits in the top-right corner of your chart. It gives you a real-time snapshot of every indicator at once.
RowWhat it showsTRENDBULL, BEAR, or NEUTRAL based on EMA alignmentRSICurrent RSI value — Green (oversold <40), Red (overbought >60), Yellow (neutral)MACD HISTBULLISH (histogram positive) or BEARISH (histogram negative)CMFINFLOW (money coming in = bullish) or OUTFLOW (money leaving = bearish)STOCHBULLISH (K line above D line) or BEARISH (K line below D line)VOLUMENORMAL or SPIKE! (yellow = unusual volume activity)SIGNALCurrent signal status — STRONG PUMP, PUMP, WATCH PUMP, WAITING, etc.RESISTNearest resistance level + % away from priceSUPPORTNearest support level + % away from priceSWINGFibonacci swing range (low → high)NEAR FIBClosest Fibonacci level to current price
HOW TO USE PROPHECY SIGNALS — STEP BY STEP
Step 1 — Check the Trend
Look at the EMA cloud and the dashboard TREND row.
Teal cloud + BULL = Look for BUY opportunities only
Red cloud + BEAR = Look for SELL opportunities only
Grey cloud + NEUTRAL = Stay out or reduce size
Step 2 — Find the Key Levels
Look at the S/R zones and Fibonacci levels on the chart.
Is price near a support zone or the 0.618/0.382 Fibonacci level? = Potential BUY zone
Is price near a resistance zone or the 0.786/0.618 Fibonacci level? = Potential SELL zone
Step 3 — Wait for the Signal
Do NOT enter a trade without a signal.
Wait for a PUMP signal near support in a bull trend = BUY setup
Wait for a DUMP signal near resistance in a bear trend = SELL setup
A STRONG PUMP or STRONG DUMP is the highest confidence signal
Step 4 — Check the Dashboard
Before entering, confirm that at least 4 out of 5 confluence rows agree with your signal direction:
RSI, MACD, CMF, STOCH, VOLUME should all support the signal
If only 2 agree = skip the trade
If 4 or 5 agree = high confidence, consider entering
Step 5 — Manage Your Trade
Set your Stop Loss just below the support zone (for buys) or above resistance (for sells)
Take profit at the next Fibonacci level or resistance/support zone
Never risk more than 1–2% of your account on a single trade
BEST TIMEFRAMES
TimeframeBest Use1H / 4HIdentify trend direction and key zones15mConfirm trend and watch for signals5mEntry confirmation — wait for signal here
Pro Tip: Always check the 1H or 4H chart first to understand the big picture. Then drop to 15m or 5m to find your exact entry. Never trade against the higher timeframe trend.
SETTINGS YOU CAN ADJUST
SettingWhat it doesRecommendedFast EMAHow quickly the fast EMA reacts21Mid EMAThe medium-term trend filter50Slow EMAThe long-term trend anchor200Volume Spike MultiplierHow large volume must be to count as a spike2.0RSI OverboughtLevel where RSI signals overbought70RSI OversoldLevel where RSI signals oversold30ATR MultiplierSensitivity of momentum detection1.5Pivot Left/Right BarsHow many bars define a swing point for S/R5S/R LookbackHow far back to scan for support/resistance300Fibonacci LookbackHow far back to find the swing high/low100
COMMON MISTAKES TO AVOID
❌ Do not trade every signal — Only trade signals that align with the higher timeframe trend
❌ Do not ignore the dashboard — If CMF shows OUTFLOW but you want to buy, be cautious
❌ Do not skip Stop Losses — Always define your risk before entering
❌ Do not chase signals — If you missed the candle, wait for the next setup
❌ Do not trade in a NEUTRAL trend — Choppy markets produce false signals
QUICK REFERENCE CARD
🔵 Teal Cloud = Bullish Trend → Look to BUY
🔴 Red Cloud = Bearish Trend → Look to SELL
⚫ Grey Cloud = No Trend → Stay out
🔺 PUMP = Early buy signal
🟢 STRONG PUMP = High confidence buy
⬆ Arrow = Momentum breakout
🔻 DUMP = Early sell signal
🔴 STRONG DUMP = High confidence sell
⬇ Arrow = Momentum breakdown
★ 0.618 / 0.650 = Golden Pocket — Institutional entry zone
⚖ 0.500 = Equilibrium — Decision zone (fair value)
🔵 Teal zones = Support — Price may bounce here
🔴 Red zones = Resistance — Price may reject here
ALERTS
Prophecy Signals includes 6 built-in alerts you can activate in TradingView:
Strong Pump — Full confluence bull signal fired
Strong Dump — Full confluence bear signal fired
Pump Signal — Base bullish signal detected
Dump Signal — Base bearish signal detected
Momentum Pump — Explosive bullish breakout
Momentum Dump — Explosive bearish breakdown
To set alerts: Right-click on the indicator name → Add Alert → Choose your condition.
FINAL WORDS
Prophecy Signals is a tool — not a guarantee. No indicator is right 100% of the time. The key to profitable trading is:
Patience — Wait for the right setup
Discipline — Follow the rules every time
Risk Management — Protect your capital above all else
Consistency — Trust the process over many trades, not just one
The more confluence you have (trend + key level + signal + dashboard), the higher the probability of a successful trade. Always trade what you see, not what you hope.
⚡ Prophecy Signals — Part of the Prophecy Trading Suite
Volume Profile VIP · Liquidity Zones VIP · Prophecy NUKE · Liquidity + VWAP/EMA Indicador
Estratégia

Indicador
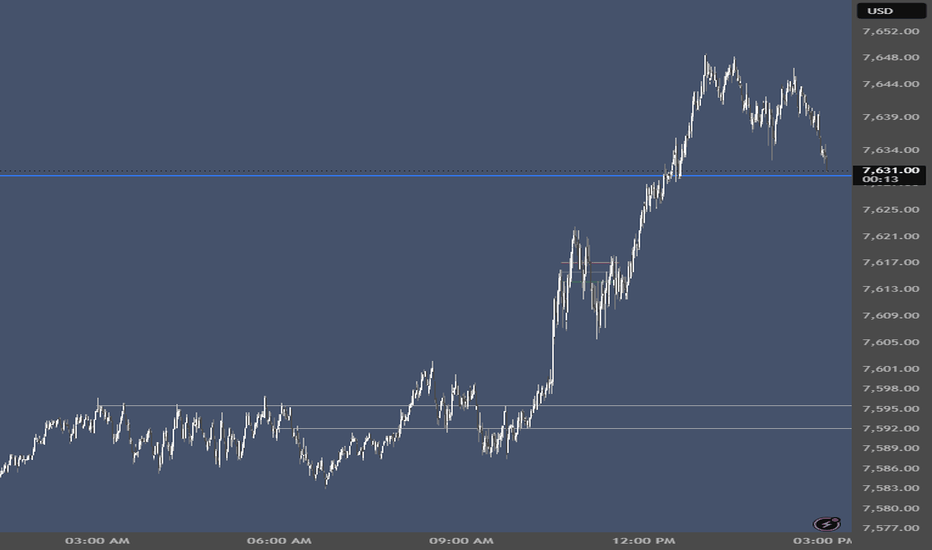
MAX CYCLE RADAR v3.6.1 RU PRO FIXEDГлавный вывод:
Это уже не просто “стрелочник купить/продать”. Это **комбайн-радар рыночного цикла**, который пытается понять: рынок копит, сжимается, снимает ликвидность, даёт импульс, входит в тренд или уже тухнет.
Главная задача индикатора — не угадывать дно, а дать нормальный вход **после подтверждения**, со стопом, тейками и пониманием, не поздно ли лезть.
Что это за индикатор
Название: MAX CYCLE RADAR v3.6.1 RU PRO FIXED
Тип: индикатор TradingView на Pine Script v6, не стратегия.
То есть он:
* показывает сигналы ПОКУПАТЬ / ПРОДАВАТЬ;
* рисует вход, стоп, тейки;
* показывает состояние рынка в инфо-окне;
* учитывает старшие таймфреймы;
* определяет фазу рынка;
* пытается не лезть в поздний вход после пампа.
Но он не открывает сделки сам и не тестируется как полноценная стратегия в Strategy Tester. Для тестера позже надо делать отдельную версию `strategy()`.
Главная идея
Мы не ушли от основной логики:
**накопление → сжатие → вынос ликвидности → импульс → откат / ретест → вход → тренд → затухание / боковик**
Индикатор пытается не просто увидеть зелёную свечу, а понять, где мы внутри этого цикла.
Что встроено внутрь
1. Squeeze / Momentum
Это модуль раннего предупреждения.
Он ищет:
* сжатие волатильности;
* выход из сжатия;
* пробуждение импульса;
* смену momentum.
Задача: заранее подсказать, что рынок может скоро рвануть.
Но сам по себе squeeze — не вход. Это как сигнал:
“готовься, скоро будет движение”.
---
2. Directional Flux
Это модуль силы направления.
Он смотрит, есть ли реальное ускорение цены относительно ATR.
Простыми словами:
* Flux вверх → покупатели начинают давить;
* Flux вниз → продавцы давят;
* Flux слабый → рынок шумит, сигналы хуже.
---
3. Liquidity Sweep
Это важный блок.
Он ищет ситуации, где рынок:
* пробил предыдущий high и вернулся обратно;
* пробил предыдущий low и вернулся обратно;
* сделал ложный пробой диапазона.
То есть он пытается поймать момент:
**толпу вынесли по стопам, а цена вернулась обратно.**
Это нужно для логики:
* сняли низ → возможен лонг;
* сняли верх → возможен шорт.
---
4. BOS / CHoCH
Это структурный блок из идеи Meridian Flow.
Он определяет:
BOS — пробой структуры по тренду.
CHoCH— смена характера движения, возможный разворот.
Простыми словами:
* BOS вверх → тренд вверх подтверждается;
* BOS вниз → тренд вниз подтверждается;
* CHoCH вверх → медвежий рынок может разворачиваться вверх;
* CHoCH вниз → бычий рынок может ломаться вниз.
Важно: этот блок не самый ранний, потому что работает через swing/pivot. Он подтверждает структуру с задержкой, зато меньше фантазирует.
---
5. Order Block
Индикатор берёт последнюю значимую свечную зону перед пробоем.
Для лонга:
* после BOS/CHoCH вверх берётся последняя медвежья зона;
* если цена возвращается туда и удерживается — это может быть зона входа.
Для шорта:
* после BOS/CHoCH вниз берётся последняя бычья зона;
* возврат туда может быть зоной шорта.
На графике мы не рисуем десятки OB, а только последнюю важную зону, чтобы не засрать экран.
---
6. Fibonacci Structure
Это модуль из Fibonacci Structure Engine.
Он ищет:
* последний импульс;
* fib-зону отката;
* цели по расширению.
Главная логика:
Для лонга лучше покупать не на хаях, а когда цена вернулась в нормальную зону:
0.5–0.786
Для шорта аналогично — не шортить низ, а ждать откат выше.
Это защищает от тупого входа после свечи в космос.
---
7. Trend Quality Index / TQI
Это идея из Self-Aware Trend System.
Индикатор оценивает качество тренда по нескольким факторам:
* эффективность движения;
* ADX;
* устойчивость momentum;
* состояние волатильности.
В инфо-окне это строка:
Тренд: сильный / средний / слабый
Смысл простой:
* сильный тренд → можно держать дальше;
* средний → осторожно;
* слабый → не добирать, готовиться к выходу.
---
8. Adaptive Trail
Это умная тренд-линия.
Она работает как динамическая защита позиции.
Если рынок шумный — линия шире.
Если тренд сильный — линия подтягивается лучше.
По ней индикатор может понять:
* держать позицию;
* выходить;
* тренд сломался;
* вход уже поздний.
---
9. MTF-фильтр
Индикатор смотрит несколько таймфреймов:
* 15m
* 1h
* 4h
* 1D
В инфо-окне строка **ТФ** показывает:
* Б = бычьи таймфреймы;
* М = медвежьи;
* Н = нейтральные.
Например:
Б3 / М1 / Н0
Это значит: 3 таймфрейма за рост, 1 против.
---
10. Новости вручную
TradingView не даёт нормально подключить реальные политические новости и календарь прямо внутрь Pine Script. Поэтому сделан ручной блок.
Можно включить:
* Новость 1;
* Новость 2;
* Новость 3;
* политический риск вручную.
Индикатор может:
* блокировать вход перед новостью;
* показать “СКОРО НОВОСТЬ”;
* после новости учитывать импульс вверх или вниз.
Это не автоматический новостной ИИ. Это ручной предохранитель.
## Что показывает на графике
На графике должно быть минимально:
ПОКУПАТЬ — когда условия за лонг набрали достаточно баллов.
ПРОДАВАТЬ — когда условия за шорт набрали достаточно баллов.
ВХОД — цена входа.
СТОП — примерный стоп.
ТЕЙК 1 / 2 / 3** — цели.
Фоновая зона** — текущий цикл рынка.
Fib-зона / OB-зона** — если включены.
Мы специально убрали кучу надписей типа `SCOUT`, `LATE`, `PRE`, чтобы график не превращался в помойку.
Что в инфо-окне самое важное
Оставляем только полезное:
Действие
Главное поле. Что делать сейчас:
* ПОКУПАТЬ
* ПРОДАВАТЬ
* ДЕРЖАТЬ ЛОНГ
* ДЕРЖАТЬ ШОРТ
* ЖДИ FIB-ОТКАТ
* ПОЗДНО ЛОНГ
* ПОЗДНО ШОРТ
* НЕ ЛЕЗТЬ
**Цикл**
Где рынок сейчас:
* НАКОПЛЕНИЕ
* СЖАТИЕ
* ВЫНОС СНИЗУ
* ВЫНОС СВЕРХУ
* ИМПУЛЬС ВВЕРХ
* ИМПУЛЬС ВНИЗ
* ТРЕНД ВВЕРХ
* ТРЕНД ВНИЗ
* ЗАТУХАНИЕ
* БОКОВИК
**Структура**
Показывает:
* BOS ↑
* BOS ↓
* CHoCH ↑
* CHoCH ↓
* БЫЧЬЯ
* МЕДВЕЖЬЯ
* НЕТ
**Зона**
Показывает:
* FIB ЛОНГ
* FIB ШОРТ
* OB ЛОНГ
* OB ШОРТ
* В FIB ЗОНЕ
* ПРЕМИУМ / ПОЗДНО
* ДИСКАУНТ / ПОЗДНО
**Тренд**
Сила тренда в процентах.
**Готовность**
Например:
**ЛОНГ 72% / ШОРТ 18%**
Это не вероятность на 100%, а оценка совпадения условий.
**ТФ**
Согласие старших таймфреймов.
**Объём**
OK / средний / слабый.
**Новости**
OFF / скоро новость / политический риск / новость вверх / новость вниз.
**Цели**
Потенциал до TP1 / TP2 / TP3 в процентах.
## Как читать сигналы
### “ПОКУПАТЬ”
Это появляется, когда совпали несколько условий:
* тренд или разворот в сторону лонга;
* MTF не против;
* есть momentum;
* есть структура / ретест / OB / Fib / пробой;
* нет признака “поздно”;
* нет блокировки новостей.
### “ПРОДАВАТЬ”
То же самое, но в обратную сторону.
### “ЖДИ FIB-ОТКАТ”
Это важная команда.
Она означает:
**движение уже пошло, но сейчас покупать поздно. Лучше ждать откат в нормальную зону.**
Вот это как раз защита от ситуации, когда ты покупаешь зелёную свечу на самом верху.
### “ПОЗДНО ЛОНГ”
Это значит:
тренд вверх есть, но цена уже слишком далеко от нормальной зоны. Вход плохой.
### “ЛОНГ СЛАБЕЕТ”
Это не обязательно “сразу продавай”.
Это предупреждение:
**тренд теряет качество, подтягивай стоп, не добирай.**
## На каких таймфреймах использовать
Для BTC:
* Основной вход: **15m / 30m**
* Подтверждение: **1h / 4h**
* Контекст: **1D**
Для ETH:
* Основной вход: **15m / 30m**
* Подтверждение: **1h / 4h**
Для альтов:
* Лучше не ниже **15m**
* И обязательно смотреть **1h / 4h**
* На 5m альты будут давать много шума.
Для скальпа:
* 5m можно, но только если рынок активный;
* входы чаще, но ложных будет больше.
## Какие настройки ставить
Для BTC:
**Профиль:** BTC
**Режим входа:** ГИБРИД
**Визуал:** НОРМАЛЬНО
Для ETH:
**Профиль:** ETH
**Режим входа:** ГИБРИД
Для альтов:
**Профиль:** ALT
**Режим входа:** БЕЗОПАСНЫЙ
Для агрессивной ловли ранних движений:
**Режим входа:** АГРЕССИВНЫЙ
Но там будет больше мусора.
## Важный честный момент
Этот индикатор не будет покупать самое дно.
И это правильно.
Если он начнёт покупать каждую нижнюю свечу, он будет ловить ножи.
Наша система должна работать так:
1. Сначала предупреждение: возможно разворот / вынос / сжатие.
2. Потом подтверждение структуры.
3. Потом вход на откате / ретесте / пробое.
4. Потом стоп и тейки.
То есть он не должен быть “угадайкой”. Он должен быть **радаром риска**.
## Что ещё надо будет доделать
Следующий нормальный шаг — сделать **отдельную strategy-версию**.
Она нужна, чтобы проверить:
* сколько сигналов было;
* win rate;
* средний R;
* просадку;
* какие настройки лучше для BTC;
* какие для ETH;
* какие для альтов.
Сейчас у нас индикатор. Он показывает логику.
Но чтобы понять, зарабатывает он или красиво рисует, нужна версия:
`strategy("MAX CYCLE RADAR STRATEGY")`
Вот там уже можно будет реально прогнать историю.
## Итог
Это индикатор не для тупого “зелёное — покупай”.
Это система, которая собирает несколько слоёв:
**цикл рынка + ликвидность + структура + Fib-зона + качество тренда + MTF + объём + риск новостей**
И финально выдаёт:
**ПОКУПАТЬ / ПРОДАВАТЬ / ДЕРЖАТЬ / ЖДАТЬ / ПОЗДНО / НЕ ЛЕЗТЬ**
Главное: не надо ожидать от него грааль. Его сила не в том, что он угадывает каждое движение, а в том, что он должен отсекать тупые входы и давать более чистые точки после подтверждения.
Indicador

Indicador

Indicador

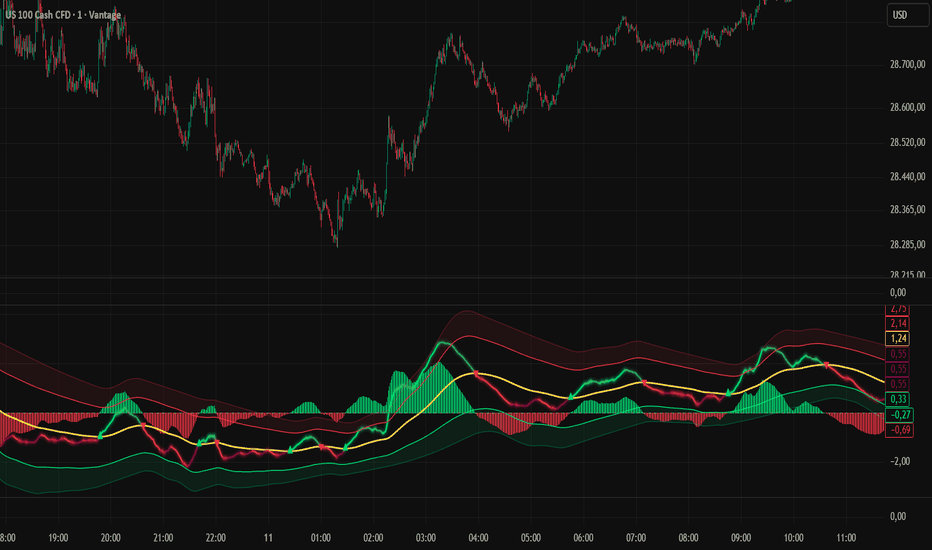
NASDAQ Z-Score x5 FAST# NASDAQ Z-Score x5 FAST
## Overview
NASDAQ Z-Score x5 FAST is the intermediate trend layer of the NASDAQ Z-Score Framework.
While the standard Chart Version focuses on execution and short-term momentum shifts, the x5 version was specifically designed to reveal the underlying intraday trend structure by filtering out lower timeframe noise.
The indicator uses the same adaptive Z-Score methodology as the Chart Version but operates on a significantly slower and more stable structure.
The result is a cleaner view of trend direction, trend strength, and market pressure without the constant fluctuations that occur on lower timeframes.
---
# Why This Version Was Created
During development it became clear that even a highly optimized chart timeframe oscillator can still react to short-term pullbacks and temporary market noise.
For active NASDAQ traders this creates a common problem:
The chart timeframe may signal a reversal while the underlying trend remains completely intact.
To solve this issue, the x5 version was developed as a dedicated trend confirmation layer.
Instead of focusing on entries, it focuses on identifying the dominant intraday flow and filtering out lower timeframe fluctuations.
The objective is simple:
Trade with the trend, not against it.
---
# Advantages Compared to the Chart Version
## Reduced Market Noise
The x5 version uses a significantly slower structure than the chart timeframe version.
Benefits:
* Fewer false reversals
* Cleaner trend visualization
* Improved directional clarity
* Better trend filtering
---
## Trend Confirmation Layer
The x5 version was specifically designed to answer one question:
"Is the current move supported by the underlying trend?"
Benefits:
* Improved trade selection
* Better directional confidence
* Higher quality setups
* Reduced counter-trend trading
---
## Stronger Market Context
While the chart timeframe focuses on execution, the x5 version focuses on context.
Benefits:
* Better understanding of market structure
* Easier identification of trend phases
* Improved pullback analysis
* Enhanced momentum confirmation
---
## Adaptive Dynamic Zero Line
Like the Chart Version, the x5 version uses a Dynamic Zero Line that continuously adapts to changing market conditions.
Benefits:
* Stable trend reference
* Reduced lag compared to traditional trend filters
* Improved identification of directional shifts
---
## Adaptive Volatility Bands
The dynamic bands automatically adjust to current market conditions.
Benefits:
* Better extreme detection
* Improved volatility adaptation
* More reliable trend continuation analysis
* Reduced false signals during volatile periods
---
# Core Components
### x5 Z-Score
The primary trend oscillator.
Designed to reveal the dominant intraday trend rather than short-term market fluctuations.
---
### Dynamic Zero Line
The adaptive equilibrium level used to evaluate trend direction and market pressure.
Crosses above and below the Dynamic Zero Line often indicate significant shifts in trend structure.
---
### Relative Pressure Model
Measures the distance between the x5 Z-Score and the Dynamic Zero Line.
This provides insight into trend acceleration and momentum development.
---
### Adaptive Bands
Dynamic volatility bands that expand and contract with market activity.
They help identify stretched market conditions without relying on fixed thresholds.
---
### Momentum Histogram
The histogram visualizes bullish and bearish pressure relative to the Dynamic Zero Line.
Compared to the Chart Version, the x5 histogram is intentionally smoother and more trend-oriented.
---
# Signal Logic
Bullish conditions occur when the x5 Z-Score remains above the Dynamic Zero Line.
Bearish conditions occur when the x5 Z-Score remains below the Dynamic Zero Line.
Crossovers indicate potential shifts in the dominant intraday trend.
Because the x5 structure is intentionally slower, signals are generally more selective and reliable than those generated on the chart timeframe.
---
# How To Use
The x5 version is not intended to be used as a standalone entry tool.
Its primary purpose is trend confirmation.
Typical workflow:
### Bullish Environment
* x5 above Dynamic Zero
* Histogram positive
* Look for long setups on the Chart Version
---
### Bearish Environment
* x5 below Dynamic Zero
* Histogram negative
* Look for short setups on the Chart Version
---
### Neutral Environment
* x5 near Dynamic Zero
* Weak histogram pressure
* Reduced directional edge
---
# Multi-Timeframe Workflow
The x5 version acts as the middle layer of the NASDAQ Z-Score Framework.
Structure:
* x15 Version = Market Structure Layer
* x5 Version = Trend Confirmation Layer
* Chart Version = Execution Layer
This creates a complete top-down workflow:
1. Determine overall market bias using x15.
2. Confirm trend strength using x5.
3. Execute entries and exits using the Chart Version.
When all three layers align, directional confidence and trend quality are significantly improved.
---
# Best Markets
Optimized for:
* NASDAQ (US100)
* NQ Futures
* High-Momentum Index Markets
Can also be used on:
* S&P 500
* DAX
* Gold
* Bitcoin
Although the default settings were specifically calibrated for NASDAQ intraday behavior.
---
# Summary
NASDAQ Z-Score x5 FAST serves as the dedicated trend confirmation engine within the NASDAQ Z-Score Framework.
By combining a Dynamic Zero Line, Relative Pressure Analysis, Adaptive Volatility Bands, and a smoother trend-focused structure, the indicator helps traders identify the dominant intraday trend while filtering out lower timeframe noise.
Its primary role is not execution, but confirmation.
Used together with the Chart Version and x15 Version, it provides a powerful multi-timeframe framework for trend-following and momentum-based trading.
Indicador
Indicador
Indicador

Indicador

ASX 200 Breadth - % Above MAASX 200 Breadth - % Above MA
Overview
This indicator measures market breadth for the ASX 200 by tracking the percentage of a representative basket of 40 large- and mid-cap ASX-listed stocks trading above a chosen moving average. It helps gauge whether strength (or weakness) in the index is broad-based across the market or concentrated in just a handful of large stocks.
How It Works
- Pine Script limits a single indicator to 40, so true 200-stock breadth isn't possible directly. Instead, this script uses a diversified 40-stock sample spanning the major ASX sectors:
- Financials: CBA, NAB, WBC, ANZ, MQG, SUN, QBE, IAG, ASX
- Materials/Resources: BHP, RIO, FMG, S32, NEM, STO, WDS
- Healthcare: CSL, RMD, COH, SHL, PME
- Consumer: WES, WOW, COL, TWE, JHX, AMC
- Industrials/Infrastructure: TCL, APA, BXB, CPU
- Property (REITs): GMG, SCG, MGR, VCX
- Tech/Other: XRO, REA, ALL, ORG
- For each stock, the script checks whether the current closing price is above its 20-, 50-, 100-, and 200-period Simple Moving Average (SMA).
- The indicator then plots the percentage of the basket trading above each selected MA, e.g. a reading of 75% on the 50-day line means 30 of the 40 sample stocks are above their 50-day SMA.
Inputs
- MA to Display: Choose which breadth line(s) to show - 20, 50, 100, 200, or All (shows all four together). Default: All
- Overbought Level: Upper reference line - readings above this suggest broad-based strength / potential overextension. Default: 80
- Oversold Level: Lower reference line - readings below this suggest broad-based weakness / potential capitulation. Default: 20
Reading the Indicator
- **Above 50%**: more than half the sample is trending above the selected MA — generally bullish breadth.
- **Below 50%**: more than half the sample is trending below the selected MA — generally bearish breadth.
- **Near 80%+ (Overbought)**: market strength is broad and stretched — watch for breadth divergences if price keeps rising but this line rolls over.
- **Near 20% or below (Oversold)**: broad-based weakness — often associated with capitulation lows or the start of a recovery once breadth turns back up.
- **Divergences**: if the ASX 200 index makes a new high/low but breadth fails to confirm (doesn't reach a corresponding extreme), it can signal weakening participation behind the move.
- **Multiple timeframes ("All")**: comparing the 20-day line against the 100/200-day lines shows whether short-term moves are aligned with the longer-term trend — e.g., a sharp pop in the 20-day line while the 200-day line stays low suggests a short-term bounce within a longer downtrend.
Notes & Limitations
- This is a **sample-based proxy** for ASX 200 breadth, not an exact count across all 200 constituents — actual index breadth may differ, especially when small-caps move independently of large-caps.
- All four MA lengths are calculated from a single data request per stock, so adding more MA options does not increase the symbol count or hit Pine's 40-symbol request limit.
- Works on any timeframe — the moving averages are calculated on that chart's timeframe (e.g., daily MAs on a daily chart, weekly MAs on a weekly chart). Indicador

Indicador
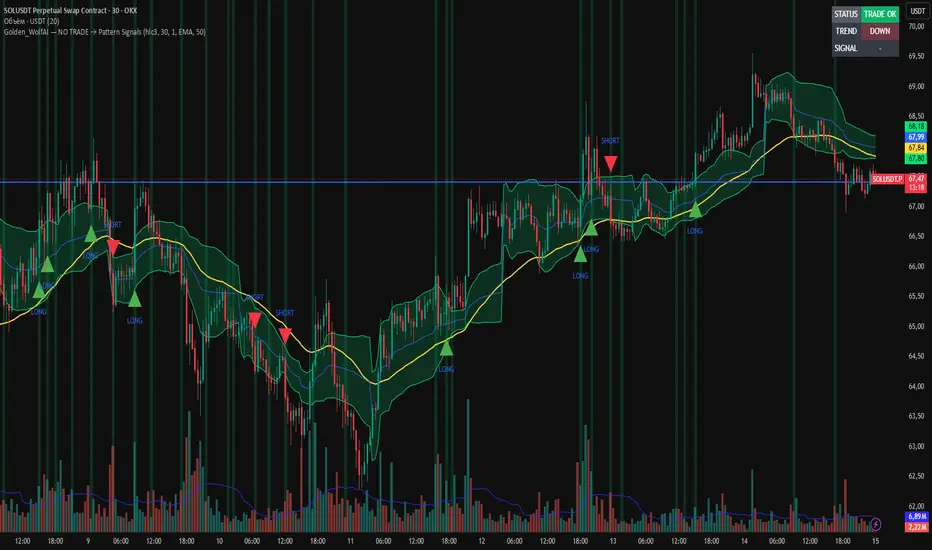
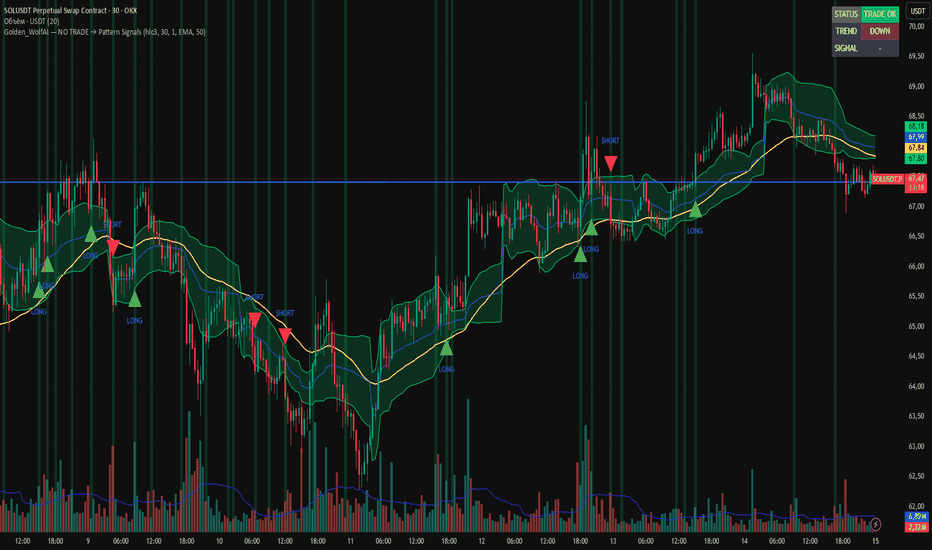
NO TRADE_Pattern Signals[Golden_WolfAI]Golden_WolfAI — NO TRADE → Pattern Signals
This indicator looks for trading signals only after price exits the NO TRADE zone.
How it works:
1. NO TRADE zone
The indicator builds a zone around VWAP using standard deviation. While price remains inside this zone, the market is considered neutral, and no signals are generated.
2. Exit from NO TRADE
A signal can appear only when price exits the NO TRADE zone. This helps filter out sideways market conditions and low-directional movement.
3. Trend filter
A moving average is used as a trend filter. The user can choose between SMA and EMA.
LONG signals are allowed only when price is above the MA.
SHORT signals are allowed only when price is below the MA.
4. Candlestick patterns
The indicator checks several candlestick formations:
• Engulfing
• Harami
• Hammer / Hanging Man
• Morning Star / Evening Star
• Piercing Line / Dark Cloud Cover
• REB
• Sweep
• Body Dominance
Each pattern type can be enabled or disabled in the settings.
5. Signal conditions
A LONG signal appears when price exits the NO TRADE zone, a bullish pattern is detected, and price is above the MA.
A SHORT signal appears when price exits the NO TRADE zone, a bearish pattern is detected, and price is below the MA.
The indicator displays:
• VWAP
• Upper and lower NO TRADE zone boundaries
• Moving Average
• LONG and SHORT labels
• A table showing market status, trend direction, and current signal
The script also includes alert conditions for LONG and SHORT signals, allowing users to create TradingView alerts.
Important: this is an indicator, not a strategy. It does not open or close trades and is not designed for direct backtesting in the Strategy Tester. Signals should be used as an analytical tool and require additional confirmation before making trading decisions.
Subscribe to Golden_WolfAI
Indicador
RSI2 Pullback Finder Trend-Filtered oversold dips in an upA clean, fully-configurable tool that highlights short-term oversold pullbacks while price is still in an uptrend — the classic "buy the dip in an uptrend" context. Visual signals + alerts. Educational, not financial advice.
RSI(2) Pullback Finder highlights one specific, well-known context: a short-term oversold pullback that happens WHILE price is still in an uptrend. This is the classic Larry-Connors-style "short-term mean reversion inside a longer-term uptrend" idea, turned into a clean visual + alert layer.
WHAT IT MARKS: Trend filter — price above a moving average you choose (default EMA 50). Oversold pullback — a short RSI (default length 2) dropping below a level you choose (default 10). When both are true on the same bar, the bar is shaded and a signal plots. Optional "context cleared" marker shows where the short-term oversold condition has resolved.
EVERYTHING IS CONFIGURABLE: MA type and length, RSI length and source, oversold level, reset level, fast MA, and all display toggles. Defaults are generic textbook values on purpose — tune them to your instrument and timeframe.
HOW TO USE: Treat a signal as "this setup is present right now," then apply your own entry rules, position sizing, and risk management. Use the built-in alerts to scan instead of staring at charts. Works on any symbol or timeframe.
WHAT IT IS NOT: It does not place trades, predict direction, or guarantee anything. It is a visualisation and alert tool. Past behaviour of any pattern does not predict future results. For education and research only — not financial advice, and I am not a financial adviser. Trade your own plan and your own risk.
Open-source — read the code, fork it, adapt it. Feedback welcome in the comments. Indicador

Indicador

BB %B + BandWidth**1. First Look At The Cyan Line: %B**
`%B` shows where price is located within the Bollinger Bands:
- `100`: Price is near the upper Bollinger Band
- Above `80`: Strong zone, but may also be short-term overheated
- `50`: Price is near the middle band
- Below `20`: Weak zone, but may also be short-term oversold
- `0`: Price is near the lower Bollinger Band
- Above `100`: Price has broken above the upper band
- Below `0`: Price has broken below the lower band
In your chart, the current `%B` is around `99.59`, which means price is very close to the upper Bollinger Band. Short-term momentum is strong, but it is also close to an overheated zone.
**2. Then Look At The Orange/Red Line: BandWidth PercentRank**
`BandWidth` measures the width of the Bollinger Bands, which represents volatility.
The default mode is `PercentRank`:
- Below `20`: Low volatility, likely in a squeeze
- Crossing above `20`: Possible squeeze release, volatility may start expanding
- Around `50`: Normal volatility
- Above `80`: Volatility is already high, chasing entries becomes riskier
The red background means the market is in a squeeze zone, where the Bollinger Bands are narrow and price may be building energy.
**3. How To Read The Markers**
- Green upward triangle: `%B` breaks above the upper band, a strong bullish breakout signal
- Red downward triangle: `%B` breaks below the lower band, a strong bearish breakout signal
- Red dot near the top: `%B` crosses above `80`, entering a strong/overheated zone
- Green dot near the bottom: `%B` crosses below `20`, entering a weak/oversold zone
- Yellow diamond: BandWidth exits the squeeze, volatility starts expanding
**4. Practical Usage Sequence**
A more reliable way to use it:
1. First look for the red background, which means a squeeze.
2. Wait for the yellow diamond, which means volatility is starting to release.
3. Check the direction of `%B`:
- `%B` crossing above `80` means the bullish side is stronger
- `%B` crossing below `20` means the bearish side is stronger
4. If `%B` breaks above `100` or below `0`, it means price has broken outside the Bollinger Bands and momentum is stronger. Indicador

Indicador

Indicador