EMA Cloud [PhantomCipher]EMA Cloud
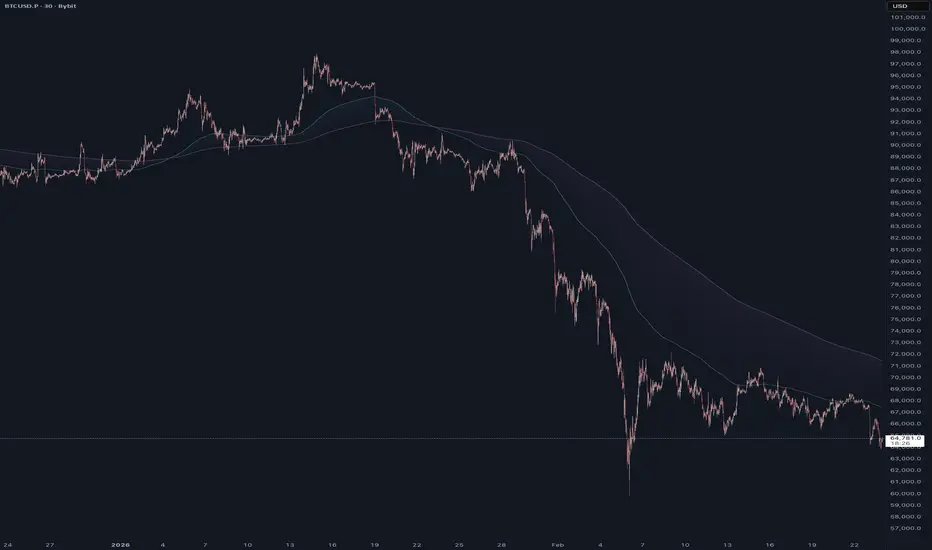
EMA Cloud shows the trend as a shaded band between two exponential moving averages, with a third EMA drawn as a longer-term reference line.
SNAPSHOT: the indicator on a clean chart, with the cloud in both colours and the 200 EMA line visible
How it works
Cloud: the area between a fast EMA (50 by default) and a slow EMA (100 by default) is filled. It's green while the fast EMA is at or above the slow EMA (uptrend) and red while it's below (downtrend).
EMA lines: the fast and slow EMAs are also drawn as lines that change colour with the trend.
Reference line: a separate EMA (200 by default) is drawn as a single line. It's not part of the cloud and its colour doesn't change with the trend. Use it to see where price sits against the longer-term trend.
Settings
Inputs tab: the length of each EMA, grouped into "EMA Cloud" (fast and slow) and "EMA Line" (the reference EMA).
Style tab: every colour, line width and on/off switch, including separate uptrend and downtrend colours for the cloud and for each EMA line.
Alerts
EMA Trend Up: fires when the fast EMA crosses above the slow EMA.
EMA Trend Down: fires when the fast EMA crosses below the slow EMA.
Create the alert with Once Per Bar Close . A cross that happens part-way through a bar can reverse before the bar closes.
The trend flip comes from comparing the two EMAs:
EMA_UpTrend = ta.ema(close, 50) >= ta.ema(close, 100)
SNAPSHOT: close-up of a trend flip, with the cloud changing colour where the two EMAs cross
How to use it
A change in cloud colour marks a shift in trend between the two EMAs. The 200 EMA adds context. For example, you might take only uptrend signals while price is above it, and only downtrend signals while price is below it.
Example chart: BYBIT:BTCUSDT.P
This indicator shows trend conditions. It's not a trading signal on its own, so combine it with your own analysis and risk management.
Indicador

20/50 EMA Pullback Tap IndicatorThe 20/50 EMA Pullback Tap Indicator is a simple price-action based tool designed to identify potential entries after a momentum shift, rather than entering immediately when the 20 EMA crosses the 50 EMA.
The core idea is simple:
The EMA cross identifies a change in momentum. The pullback provides the entry.
How It Works
🟢 Long Setup
The 20 EMA crosses above the 50 EMA.
The indicator arms a bullish setup.
No trade is signalled on the crossover.
Price must first establish itself above the 20 EMA.
The indicator then waits for price to pull back and touch the 20 EMA.
When the 20 EMA is tapped, a BUY signal is generated.
Only one long signal is generated from that crossover.
If price does not touch the 20 EMA within 30 candles, the setup expires.
🔴 Short Setup
The short setup works in the opposite direction:
The 20 EMA crosses below the 50 EMA.
The indicator arms a bearish setup.
No trade is signalled on the crossover.
Price must first establish itself below the 20 EMA.
The indicator waits for price to pull back and touch the 20 EMA.
When the 20 EMA is tapped, a SELL signal is generated.
Only one short signal is generated from that crossover.
If price does not touch the 20 EMA within 30 candles, the setup expires.
Why Use the Pullback?
A common problem with EMA crossover systems is entering immediately on the crossover. By the time the cross occurs, price may already have moved significantly.
This indicator takes a different approach.
The 20/50 crossover is treated as confirmation that momentum has shifted, while the 20 EMA pullback is used as the potential entry location.
This can provide a more structured entry instead of chasing the initial move.
No Additional Indicators
The indicator intentionally keeps the methodology simple.
It does not use:
RSI
MACD
VWAP
Volume filters
Additional trend indicators
Multiple confirmation indicators
The system is built around just:
20 EMA + 50 EMA + Pullback to the 20 EMA
Signal Behaviour
The indicator is designed to detect the EMA tap during the active candle rather than requiring the candle to close first.
This means signals can appear while the current candle is developing when price reaches the 20 EMA.
Because of this behaviour, traders should understand that a live-bar signal can change or disappear before the candle closes depending on market movement and TradingView's realtime calculations.
Setup Expiration
Each crossover creates a new setup.
If the required pullback does not occur within the configured number of candles, the setup is automatically cancelled.
The default expiration is:
30 candles
This prevents an old EMA crossover from generating an entry long after the original momentum shift.
Recommended Use
The indicator can be used on its own as a simple EMA pullback system or combined with a trader's own:
Support and resistance
Market structure
Liquidity levels
Risk management
Higher-timeframe analysis
However, these additional concepts are not required by the indicator itself.
Important Disclaimer
This indicator identifies potential setups based on the rules described above. A signal does not guarantee a profitable trade.
Always use appropriate risk management and test the indicator on your chosen market and timeframe before using it with real capital. Indicador

MA Trend Ribbon# MA Trend Ribbon
## Overview
MA Trend Ribbon is a trend-following overlay that sits directly on the price chart. It draws a band made of six moving-average lines stacked from fastest to slowest. The band fills with color to show whether the market is leaning up or down, and it prints clear BUY and SELL labels at the moments the trend flips. It can also read the entire ribbon from a higher timeframe, so a lower-timeframe chart can be traded in line with the broader trend. The goal is a single, easy-to-read picture of trend direction and the points where that direction changes.
## What It Shows
- **The ribbon** — six moving averages of increasing length, drawn together as a colored band. When the band tilts and expands upward the trend is up; when it rolls over and expands downward the trend is down. A band that pinches flat signals a market with little direction.
- **The color** — the entire ribbon turns one color for an up-trend and another for a down-trend, so direction reads at a glance without studying the individual lines.
- **The labels** — a BUY label marks the bar where the trend turns up, and a SELL label marks the bar where the trend turns down. By default the labels ride the ribbon itself, sitting just outside the band; they can instead be pinned to the price candles. A label always appears on the same bar the ribbon changes color, so the two never disagree.
- **Optional bar coloring** — price bars can be tinted to match the trend for an even faster read.
- **Alerts** — built-in alerts announce each new BUY and SELL so the chart does not have to be watched constantly.
## The Structure Timeframe
The ribbon can be calculated on a timeframe other than the one being viewed. Left blank, it simply uses the chart's own timeframe. Set to a higher timeframe, the whole ribbon — its lines, its color, and its signals — is drawn from that broader view and displayed on the current chart. This makes it possible to watch a fast chart while keeping every reading aligned to a slower, more meaningful trend.
Two things are worth knowing when a higher timeframe is selected. The ribbon will look stepped, because each higher-timeframe value holds flat across the smaller bars until the larger bar completes. And the most recent portion can shift while the current higher-timeframe bar is still forming, settling once that bar closes; the confirm-on-close option keeps alerts from acting before it settles.
## How Direction Is Decided
The ribbon offers two ways to define the trend, chosen from a single setting:
- **Ribbon Flip** — the trend is up while the fastest line sits above the slowest line, and down when it drops below. This waits for the whole ribbon to turn over, giving steadier, less frequent signals.
- **Fastest MA Slope** — the trend is up the moment the fastest line starts rising and down the moment it starts falling. This reacts earlier and produces more signals.
Whichever method is selected controls both the ribbon color and the labels, keeping the visual and the signals in step.
## Choice of Averages
The ribbon is not limited to one style of average. A dropdown selects the type used for all six lines, ranging from smooth-and-steady to fast-and-reactive. Smoother types change direction later but hold trends more calmly. Faster types change direction sooner but shift more often. Because every line uses the same base length regardless of the type chosen, the base length usually deserves a fresh look after switching types, since the same number behaves differently from one average to the next.
The default type is volume-weighted, which leans on the bars that trade the most. On symbols whose data feed does not carry real volume, a volume-weighted average may behave unpredictably; on those markets one of the price-only types is the better choice.
## Optional Polish
Two extra touches can be switched on to make trends easier to judge, and both are off by default so the standard look stays clean:
- **Momentum-scaled ribbon** — the fill grows more solid as the band expands during a strong trend and fades as it compresses in a quiet market, so strong moves stand out and flat stretches recede.
- **Price-to-ribbon fill** — a soft shade fills the gap between price and the ribbon, making pullbacks toward the band easy to spot.
---
## User Inputs
### Structure
- **Structure Timeframe** — the timeframe the entire ribbon is calculated on. Blank uses the chart's own timeframe. A higher selection draws that higher timeframe's ribbon and signals on the current chart. Default is blank.
### Moving Average
- **Source** — the price used for the calculation. Default is the closing price. Other choices include the open, high, low, or an average of these.
- **MA Type** — the style of average used for every line in the ribbon. Ten options are available, from the smoothest and steadiest to the fastest and most reactive: Simple, Exponential, Weighted, Hull, Wilder's, Volume-Weighted, Double Exponential, Triple Exponential, Arnaud Legoux, and Least Squares. Default is Volume-Weighted.
- **Base MA Length** — the length of the fastest line in the ribbon. Smaller values make the whole ribbon quicker to react; larger values make it slower and smoother. Default is 40.
- **Ribbon Spacing** — the amount added to each line's length as the ribbon steps from fastest to slowest. Smaller values pack the six lines into a tight band; larger values spread them apart so the band widens and narrows more dramatically. Default is 8.
### Advanced MA Inputs
These settings apply only to specific average types and are ignored by the rest.
- **ALMA Offset** — applies only when the Arnaud Legoux type is selected. Higher values make that average track price more closely; lower values make it smoother. Default is 0.85.
- **ALMA Sigma** — applies only when the Arnaud Legoux type is selected. Larger values produce a smoother line; smaller values follow price more closely. Default is 6.
- **LSMA Offset** — applies only when the Least Squares type is selected. Shifts that line forward or backward by a set number of bars. Default is 0.
### Signals
- **Signal Trigger** — chooses how the trend is defined, either Ribbon Flip (steadier, later) or Fastest MA Slope (earlier, more frequent). Default is Ribbon Flip.
- **Show Buy/Sell Labels** — turns the BUY and SELL labels on or off. Default is on.
- **Label Position** — chooses where labels sit. Ribbon attaches them to the band, just below the lowest line for a buy and just above the highest for a sell, so they travel with the ribbon. Bar pins them to the candles instead, below the low for a buy and above the high for a sell. Default is Ribbon.
- **Label ATR Offset** — sets how far a label sits from the ribbon in Ribbon mode, scaled to recent price movement so the gap stays consistent in calm and volatile markets. A value of zero places the label right on the band; larger values push it further away. Has no effect in Bar mode. Default is 0.5.
- **Color Bars By Trend** — tints the price bars to match the current trend color. Default is off.
- **Confirm Signals On Bar Close** — when on, alerts wait until a bar has fully closed before firing, so a signal cannot appear and then disappear before the bar finishes. Labels still show while the bar is forming. Default is on.
### Style
- **Bullish Color** — the color of the ribbon and labels during an up-trend.
- **Bearish Color** — the color of the ribbon and labels during a down-trend.
- **Ribbon Fill Transparency** — how see-through the shaded band is, from solid to invisible. Default is 78.
- **Ribbon Line Width** — the thickness of each ribbon line. Default is 1.
- **Label Size** — the text size of the BUY and SELL labels, from tiny to large. Default is Normal.
### Visual Polish
- **Momentum-Scaled Ribbon** — when on, the fill grows more solid as the ribbon expands and fades as it compresses, so trend strength is reflected in the shading. Default is off.
- **Strong-Trend Fill Transparency** — the solidity of the fill at full ribbon expansion when the scaling above is on. Lower is more solid. Default is 38.
- **Momentum Normalization Length** — how many bars are used to judge how wide the ribbon is now compared with its recent range. Shorter values react faster to changes in strength; longer values give a steadier scale. Default is 100.
- **Fill Price To Ribbon** — shades the gap between price and the ribbon to highlight pullbacks. Default is off.
- **Price Fill Transparency** — how subtle that price-to-ribbon shading is. Higher is fainter. Default is 88.
---
## Best Use
The ribbon works best as a trend filter rather than a stand-alone entry system. Trends are followed most cleanly when trades lean in the direction of the ribbon color, using the labels to mark the turning points. Reading the ribbon from a higher Structure Timeframe while entering on a faster chart is a natural way to keep trades aligned with the larger trend. In quiet, sideways markets the ribbon will change color back and forth and produce more frequent, less reliable signals; the Ribbon Flip setting and a wider spacing reduce this, at the cost of later entries. Faster average types and tighter spacing suit active, short-term charts, while smoother types and wider spacing suit calmer, longer-term views. Indicador

Indicador

Indicador

Indicador

Multi Trend FilterOverview
Multi Trend Filter shows the market's underlying trend with a single, clean line. It uses the Daily timeframe as the base, then layers 4H and 30m confirmation on top, coloring the trend in three intuitive states: green / yellow / red. No matter which chart timeframe you view it on (15m, 1h, 4h, etc.), it stays consistent on the Daily basis, and a two-pass smoothing keeps the line smooth on any chart.
WHAT THE COLORS MEAN
Green (UPTREND): Uptrend confirmed.
Yellow (TRANSITION): Trend is shifting — awaiting confirmation.
Red (DOWNTREND): Downtrend confirmed.
HOW IT WORKS — 3-STAGE MULTI-TIMEFRAME CONFIRMATION
Set the broad direction with higher timeframes first, then confirm the entry with the lower timeframe last.
Daily (Base / Reference line) — the line drawn on the chart; the anchor of the larger trend.
4H (Primary confirmation) — when both the close and the 4H flow align above/below the Daily line, the base direction is set.
30m (Final confirmation) — in that base direction, once the candle body closes across the 30m line, the color is finalized:
Close closes ABOVE the 30m line → Green
Close closes BELOW the 30m line → Red
Yellow (Transition) is the period before both stages confirm — the 4H hasn't committed yet, or it has but the close hasn't cleared the 30m line. Once green/red is confirmed, the color ignores minor noise while the base holds (latch), so it won't flicker.
HOW TO READ IT
Green: uptrend intact. Look for pullback entries.
Red: downtrend intact. Look for bounce exits / stay aside.
Yellow: direction unclear; safer to wait until it confirms green/red.
Yellow to Green = bullish shift. Yellow to Red = bearish shift.
KEY SETTINGS
Trend Line — First / Second Smoothing Length: line smoothness and responsiveness.
Display Smoothing — Smooth Line, Smooth Strength: keeps the line smooth on any timeframe (higher = smoother, slightly more lag).
Confirmation Lines — Show 30m Line (Signal) / Show 4H Line (Base): reveal the lines used for confirmation.
Style — up/down/transition colors, line width, fill and transparency, trend label.
TIPS
Use it as a trend direction and shift filter, not a standalone trade signal.
Reliability increases when the trend color agrees with your own setup (support/resistance, volume, etc.).
If the line looks choppy, raise Smooth Strength.
DISCLAIMER
This indicator is a reference tool to help judge trend direction. It does not guarantee trading profits. All trading decisions and responsibility rest solely with the user. Indicador

Indicador

Dual MA Gradient [Gabremoku]Dual MA Gradient is a clean dual moving average overlay designed to highlight not only MA direction and crossover, but also the degree of separation between the two averages through a dynamic gradient ribbon.
The script uses two configurable moving averages and transforms their relationship into a visual ribbon that reacts to:
bullish alignment
bearish alignment
neutral compression
Instead of relying only on a simple crossover, the indicator helps show whether the two averages are:
crossing,
compressing,
or expanding apart
That makes it useful as a compact trend-structure tool for traders who want an at-a-glance read on direction and relative momentum.
What it shows
📈 Two configurable moving averages — each MA can be set independently using:
EMA or SMA
custom length
custom source
🌈 Directional gradient ribbon — the space between the two averages is divided into layered fills that create a smooth visual ribbon.
🟦 Bullish separation — when the fast MA is above the slow MA, the ribbon shifts to bullish color.
🟨 Bearish separation — when the fast MA is below the slow MA, the ribbon shifts to bearish color.
⚪ Compression state — when the spread between the two MAs becomes small enough, the ribbon fades into a neutral state to signal contraction.
🏷️ Status label — optional live label shows the active state:
Compression
Bullish Separation
Bearish Separation
⭕ Cross markers — optional markers can be shown when bullish or bearish MA crosses occur.
Core logic
The indicator is built around three simple but useful ideas:
Which MA is on top
How far apart the two MAs are
Whether the spread is strong enough to be directional or too tight and neutral
A moving average crossover occurs when a shorter-period average crosses a longer-period average, and it is commonly used to identify trend shifts or signal changes in directional bias.
This script goes a step further by emphasizing the spread between the averages. That matters because ribbon spacing is often used as a visual clue for trend structure: when averages are compressed, the market may be in transition or contraction, while a wider directional ribbon can reflect stronger alignment.
How to read it
A practical reading method is:
Compression = the two averages are close together, market may be transitioning or losing directional clarity
Bullish separation = the fast MA is above the slow MA and the ribbon is opening upward
Bearish separation = the fast MA is below the slow MA and the ribbon is opening downward
In many moving-average frameworks:
the cross helps identify the directional shift
the spacing helps evaluate whether that shift is weak or established
a tight ribbon often suggests indecision or a developing transition
Features
✅ Dual moving average framework
✅ SMA or EMA selection for both lines
✅ Fully customizable lengths
✅ Dynamic layered ribbon between MAs
✅ Bullish / bearish / neutral compression states
✅ Optional MA line display
✅ Optional live status label
✅ Optional crossover markers
✅ Built-in bullish and bearish crossover alerts
Notes
This indicator is designed as a trend-visualization tool rather than a complete standalone strategy. Like all moving-average systems, it is inherently lagging, so it is generally more useful for confirming structure and directional bias than for predicting reversals in isolation.
Author: Gabremoku
Pine Script v6 Indicador

Multi MA Framework [Gabremoku]Multi MA Framework is a flexible multi-moving-average overlay built for traders who want a clean and fully customizable MA workspace directly on the chart.
The indicator lets you plot up to four independent moving averages, each with its own:
visibility toggle
length
MA type
color
This makes it useful for traders who want to combine fast and slow averages, compare SMA vs EMA behavior, or build a personalized trend framework without loading multiple separate indicators.
What it shows
📈 Up to 4 Moving Averages — each line can be configured independently and displayed only when needed.
⚙️ SMA or EMA per line — choose the moving average type separately for each MA. SMA gives equal weight to all values in the period, while EMA gives more weight to recent prices and typically reacts faster to change.
🏷️ End Labels — optional right-side labels show each MA name, type, and length.
☁️ Cloud Fills — optional fills between:
MA 1 / MA 2
MA 3 / MA 4
These clouds help visualize alignment and separation between faster and slower averages.
Core idea
This script is designed as a moving average framework, not a rigid strategy.
Moving averages are commonly used to:
identify trend direction
smooth noisy price action
monitor dynamic support and resistance
compare short-term and long-term market structure
By allowing different lengths and SMA/EMA choices on every line, the script makes it easy to create your own structure, for example:
fast trend stack
swing trend map
long-term bias model
crossover-based workflow
How to use
A practical way to use the framework is to combine shorter and longer averages.
For example:
a shorter MA can track immediate momentum
a medium MA can define swing direction
a longer MA can define higher-level trend bias
When multiple moving averages align in the same direction, traders often interpret that as stronger trend structure. Crossovers between faster and slower averages are also widely used to monitor possible trend shifts, although they are lagging by nature.
Example setups
Here are some common ways this framework can be configured:
Trend stack: 10 EMA / 20 EMA / 50 EMA / 200 SMA
Swing trader view: 20 EMA / 50 SMA / 100 SMA / 200 SMA
Minimal structure: show only 2 lines and enable one cloud
Cross comparison: use SMA on one line and EMA on another with the same or similar length to compare responsiveness
Because EMA reacts faster and SMA is smoother, combining both can help balance responsiveness and stability.
Features
✅ Up to 4 fully independent moving averages
✅ SMA or EMA selection for each line
✅ Custom length for each MA
✅ Custom color for each MA
✅ Visibility toggle for every line
✅ Adjustable line width
✅ Optional right-side end labels
✅ Optional MA1/MA2 cloud fill
✅ Optional MA3/MA4 cloud fill
✅ Clean chart overlay design
Notes
This indicator is best used as a custom trend structure tool rather than a standalone signal engine. Moving averages are inherently lagging indicators, so they are most effective when used to define context and trend bias rather than predict reversals on their own.
Author: Gabremoku
Pine Script v6 Indicador

Indicador

Trend Master Bundle (5x EMA, DEMA & VWAP) | MouryaThe Trend Master Bundle is a comprehensive, trend-following utility designed to visualize perfect moving average alignment and volume-weighted momentum. By integrating multiple exponential moving averages, a double exponential moving average, and standard deviation VWAP bands, this tool provides a clear, quantitative view of both macro trend direction and intraday mean-reversion zones.
The "Perfect Alignment" Strategy
The core algorithmic logic of this indicator detects strict momentum states where the moving averages fan out in a specific sequence:
Extremely Bullish: Identified when the current price sits above the moving averages, and the MAs are stacked in strict ascending order: 5 EMA > 10 EMA > 20 EMA > 50 EMA > 100 DEMA > 200 EMA. This structural alignment indicates a dominant uptrend.
Extremely Bearish: Identified when the price remains below the moving averages, and they are stacked in descending order: 5 EMA < 10 EMA < 20 EMA < 50 EMA < 100 DEMA < 200 EMA.
Core Indicator Components
5x Exponential Moving Averages: Standard institutional lengths (5, 10, 20, 50, 200) serve as dynamic support and resistance layers.
100-Period DEMA: The Double Exponential Moving Average is utilized to reduce the lag inherent in standard EMAs. It reacts faster to price changes, serving as a highly responsive lead indicator for mid-to-long-term trend transitions.
VWAP with Standard Deviation Bands: The anchored Volume Weighted Average Price calculates the asset's true fair value based on volume and price. The surrounding standard deviation bands help measure market volatility and extension.
Upgraded Visual Features
End-of-Line Tracking Labels: Dynamic text labels automatically track the most recent candle, floating the name of each specific moving average (e.g., "EMA 50", "VWAP") directly at the end of its respective line for instant visual identification.
Dynamic Premium Dashboard: A sleek, non-intrusive dark-mode widget provides a real-time readout of the current trend state (Extremely Bullish, Extremely Bearish, or Neutral) and lists the exact current price values for all active moving averages.
Full Customisation: Every MA length, colour, VWAP anchor, and UI element can be toggled or adjusted via the indicator settings menu to suit individual charting preferences.
Practical Application
Trend Confirmation: Traders can use the dashboard to ensure they are trading in the direction of the dominant momentum.
Pullback Entries: During a confirmed "Extremely Bullish" or "Extremely Bearish" state, the 20 EMA and VWAP baseline often act as areas of interest for trend-continuation setups.
Mean Reversion: Price interaction with the outer VWAP standard deviation bands (Bands #2 and #3) can signal statistically overextended market conditions, helping identify potential exhaustion points or mean-reversion opportunities. Indicador

Indicador

Estratégia

Indicador

Indicador

High Volatility EMA Extension Bands
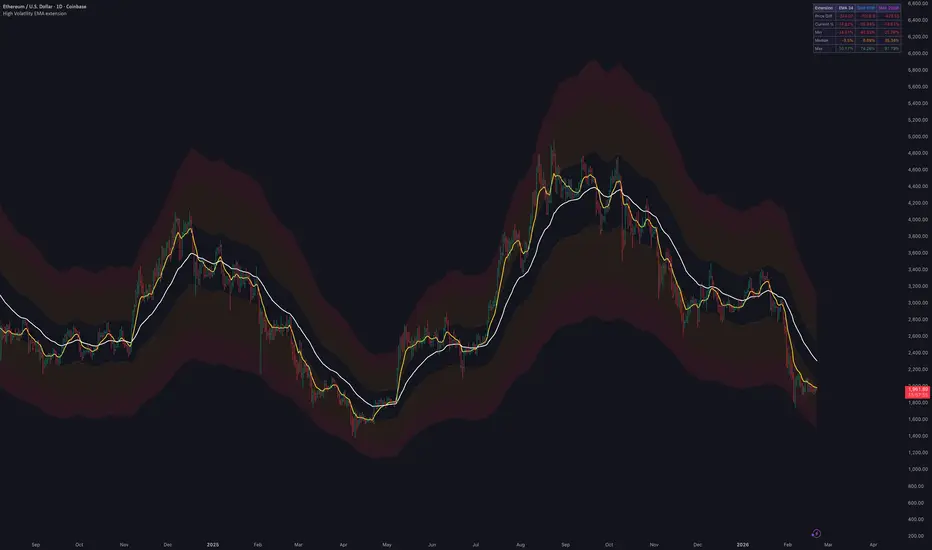
An EMA-based trend indicator with extension bands and statistical tracking for higher-volatility assets.
What it shows:
8 EMA (yellow) and 34 EMA (white) lines
Three extension bands at 10%, 25%, and 35% above and below the 34 EMA
Color-coded zones: green (10%), amber (25%), red (35%)
Extension statistics table showing current %, price difference, min/max/median values for EMA 34, 50-week SMA, and 200-week SMA
Settings:
Adjustable EMA lengths (default: 8 and 34)
Customizable extension percentages (default: 10%, 25%, 35%)
Toggle extension bands on/off
Toggle statistics table on/off
Indicador

Low Volatility EMA Extension Bands
An EMA-based trend indicator with tight extension bands and statistical tracking for lower-volatility assets.
What it shows:
8 EMA (yellow) and 34 EMA (white) lines
Three extension bands at 10%, 15%, and 20% above and below the 34 EMA
Color-coded zones: green (10%), amber (15%), red (20%)
Extension statistics table showing current %, price difference, min/max/median values for EMA 34, 50-week SMA, and 200-week SMA
Settings:
Adjustable EMA lengths (default: 8 and 34)
Customizable extension percentages (default: 10%, 15%, 20%)
Toggle extension bands on/off
Toggle statistics table on/off
Indicador

Estratégia
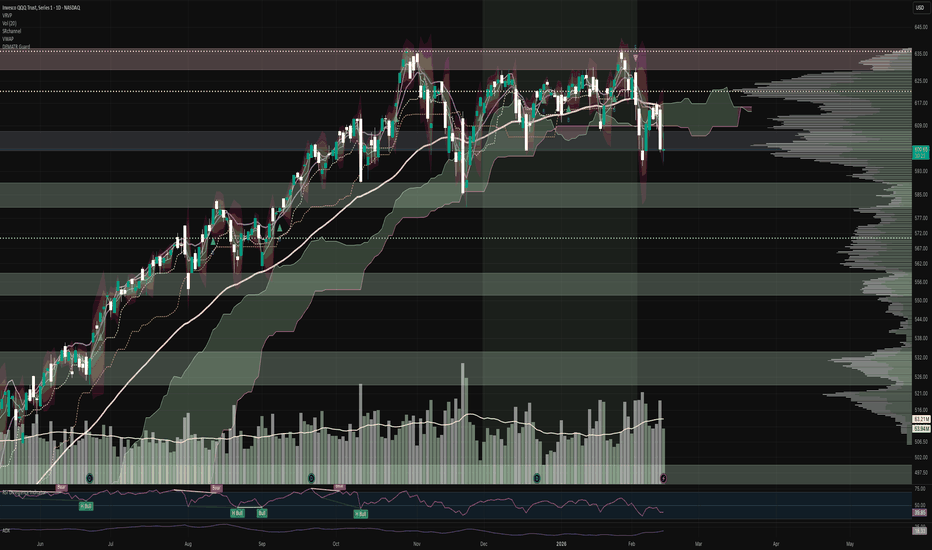
Indicador

Indicador
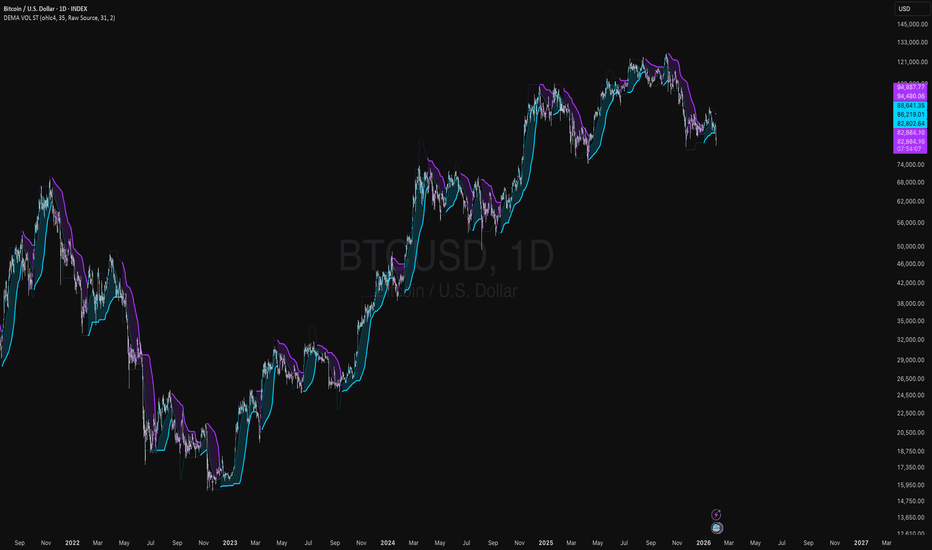
Indicador

Estratégia