Gold Macro Dashboard [invincible3]Gold Macro Indicator Dashboard
A professional macro-driven gold dashboard designed to evaluate the broader gold market regime using automatically sourced TradingView data. The indicator combines real yields, dollar strength, rate expectations, risk-off demand, gold breadth, and confirmation ratios into a single 0–100 Gold Macro Score.
The model uses a fixed daily macro timeframe, so dashboard readings stay consistent across intraday, daily, and weekly charts.
Main Features
Fixed Daily macro scoring
0–100 Gold Macro Score oscillator
Macro Regime classification
Macro Strength score
Real Yield driver
DXY / US Dollar driver
Gold liquidity proxy
US 2Y rate outlook
VIX risk-off signal
Cross-currency gold breadth
Gold/Silver ratio
Gold/S&P 500 ratio
Copper/Gold ratio
US 10Y–2Y yield spread
Crypto-style clean dashboard layout
Dark/light theme adaptive colors
No manual macro inputs
Score Interpretation
80–100: Strong Bull
60–80: Bullish
40–60: Neutral
20–40: Bearish
0–20: Strong Bear
How It Works
The composite score is weighted as follows:
Real Yield 10Y: 30%
US Dollar DXY: 25%
Gold liquidity proxy: 15%
US 2Y rate outlook: 10%
Risk-Off VIX: 10%
Gold breadth: 10%
Gold breadth checks whether gold is trending higher across major currencies, including XAUUSD, XAUEUR, XAUJPY, XAUGBP, and XAUCNH.
Use Case
This indicator is designed for traders and investors who want a macro-level view of gold’s trend quality. It can help identify whether gold strength is supported by broad macro conditions or only short-term price movement.
Disclaimer
This is an educational macro model only. It is not financial advice and should not be used as a standalone buy or sell signal. Always combine it with your own risk management, technical analysis, and market research. Indicador

Liquidity Map & Execution Cost# Liquidity Map & Execution Cost
## What this script does
LMX answers three execution questions most indicators ignore: **how expensive is it to get in and out right now, how hard would it be to move size, and where on the chart will price struggle versus travel freely.** It reads only the chart's own price and volume — no symbol is hardcoded, so it runs on any asset and any market (equities, futures, FX, crypto, indices) — and turns the answers into a plain-language trade check: liquidity state, suggested position size, order type, estimated slippage, and a colour-coded map of support, resistance, walls and open gaps.
## Why these components are combined (mashup justification)
This is not several indicators stacked together — it is one liquidity model whose parts each answer a question the others cannot, and they are designed to be read together. Removing any one leaves a specific blind spot:
1. **Cost to cross — effective spread.** Estimated with the EDGE estimator (Ardia, Guidotti & Kroencke 2024) from open/high/low/close, cross-checked against Abdi-Ranaldo (2017) and Corwin-Schultz (2012). This tells you the round-trip cost of entering, which spread-blind tools cannot show. Alone, it says nothing about moving size or about levels.
2. **Cost to move size — price impact.** The Amihud (2002) illiquidity ratio with a high-low refinement, plus a rolling Kyle (1985) lambda computed as a true regression slope. This tells you how far your own order would push price — the question that matters for sizing, and one a spread estimate cannot answer.
3. **Direction of pressure — order imbalance.** A close-location signed-volume imbalance and its persistence. This tells you which side is leaning now, adding direction that the cost measures lack.
4. **The spatial map — volume at price.** A time-decay-weighted, range-distributed volume profile that yields the Point of Control and Value Area (standard 70% method), rendered as directional zones: green support below price, red resistance above, solid = a wall price struggles at, faint = an open gap price slides through. This converts the abstract cost/impact numbers into *locations* on the chart.
5. **Anchored VWAP — fair value.** A volume-weighted average anchored to your chosen reference (last major swing by default; or session/week/month open, or the highest-volume bar), drawn as a trend-coloured line. It is the dynamic counterpart to the static profile: where the average participant is positioned, and whether price is rich or cheap versus that.
Together they form one decision: the spread and impact set the **cost and size**, the imbalance and VWAP set the **direction and fair value**, and the map sets the **location** — so the output is "trade full size with market orders, buyers in control, room to run up to the gap above," not five separate readings.
## How a reading is produced
Each estimator is normalised to a percentile of its own history so thresholds adapt to every symbol and timeframe. The inverted spread, inverted impact and depth combine into a 0–100 **Liquidity Score**, classified as Deep / Normal / Thin / Stressed (a sudden impact spike forces Stressed). The score drives the suggested size multiplier, the order-type advice and the slippage estimate. The map is rebuilt on the last bar from the volume-at-price profile.
## How to use it
- Apply to any symbol. Set the price source and, if you trade very low intraday timeframes, optionally fix the calc timeframe (e.g. Daily) so the spread estimators stay stable. On symbols without real volume the volume modules disable automatically and the score leans on the spread estimators (the panel shows "price-only").
- **Simple mode (default)** gives plain-language guidance: Liquidity, Trade cost, Pressure, Position size, Orders, Watch-out, Fair value, and a one-line verdict. **Pro mode** exposes the full readout (spread in bps, Amihud and Kyle percentiles, depth, imbalance, flow persistence, value-area levels).
- On the chart: trade toward green support, expect resistance at red, size down where the map is thin (price moves fast there), and read the trend-coloured fair-value line for rich/cheap context.
- Alerts: liquidity-state change and sudden liquidity withdrawal.
## Originality
The combination is the original contribution: a single overlay that fuses low-frequency **spread**, **impact** and **imbalance** estimators with a **time-decay, range-distributed volume profile** and an anchored fair-value line, then translates all of it into sizing/order/slippage decisions in plain language. The building blocks are public-domain methods (EDGE, Abdi-Ranaldo, Corwin-Schultz, Amihud, Kyle, volume-profile Value Area, anchored VWAP), each used for the specific job described above and cited in the script header.
## Limitations (please read)
- These are **low-frequency estimators** of quantities normally measured from quote/tick data. They approximate — they do not measure — the true spread, depth, or dealer book.
- Volume-based modules require a real volume feed; they disable on symbols without one.
- Spread estimators were validated on daily-type bars; on very fast intraday timeframes they are noisier — use the calc-timeframe option if needed.
- The on-panel statistics are computed on the loaded chart history.
- This is an analysis tool, **not financial advice.** Test before use and trade at your own risk.
Indicador

Indicador

Indicador

Indicador

Indicador

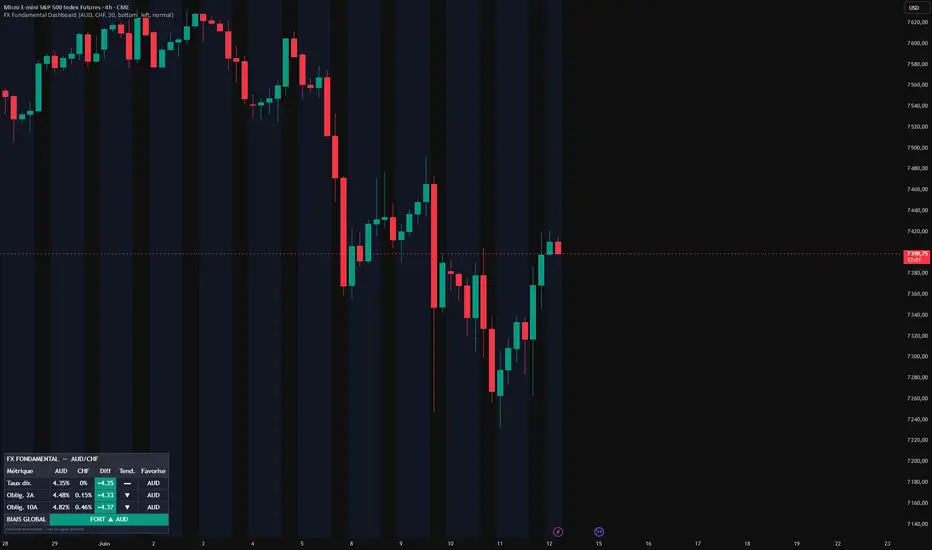
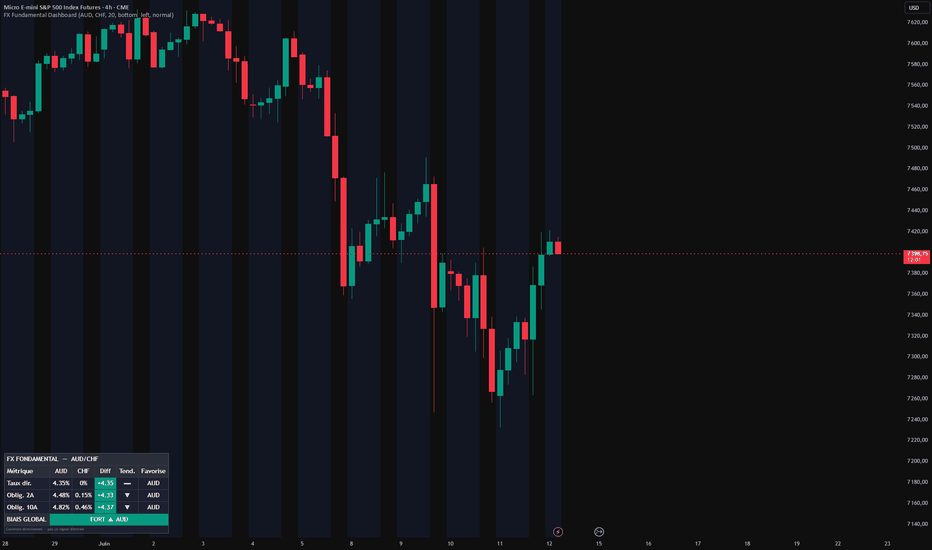
FX Fundamental Strength - Scorecard macro par deviseDescription
FX Fundamental Strength calcule un score de force fondamentale pour 8 devises majeures (USD, EUR, GBP, JPY, CHF, CAD, AUD, NZD) et les classe en temps reel. L'objectif est de fournir un contexte macro clair, pas un signal d'entree.
Pour chaque devise, l'indicateur combine 4 metriques:
Taux directeur (request.economic INTR): plus il est haut, plus la devise est forte.
Inflation annuelle (IRYY): par defaut une inflation elevee est lue comme hawkish (option desactivable).
Momentum du rendement 2 ans: variation du taux 2 ans sur N jours, un rendement qui monte renforce la devise.
Taux de chomage (UR): plus il est bas, plus la devise est forte.
Notation relative
Chaque metrique est notee en relatif: une devise gagne des points selon le nombre d'autres devises qu'elle bat sur cette metrique. Cette approche est robuste aux echelles differentes et aux donnees manquantes (une valeur indisponible vaut 0 point sans casser le calcul). Les 4 scores sont ensuite combines selon des ponderations reglables (par defaut: Taux 40, Momentum 25, Inflation 20, Chomage 15).
Le resultat est un score de 0 a 100 par devise, ou 100 represente la plus forte du panier, avec un classement et un code couleur.
Biais LONG / SHORT
L'indicateur met en avant la devise la plus forte et la plus faible du moment, et propose un biais directionnel: LONG sur la plus forte, SHORT sur la plus faible. Des alertes se declenchent quand la devise la plus forte ou la plus faible change.
Parametres principaux
Ponderations des 4 metriques
Fenetre du momentum 2 ans (jours)
Symboles des rendements 2 ans modifiables (par exemple basculer sur le 10 ans si le 2 ans n'est pas disponible)
Position, taille et affichage du tableau
A noter
C'est un outil de contexte fondamental, a croiser avec ton propre timing (structure de marche, niveaux, methodologie d'execution). L'EUR utilise le Bund allemand comme proxy de rendement. 32 appels de donnees au total (4 metriques x 8 devises), sous la limite Pine. Indicador
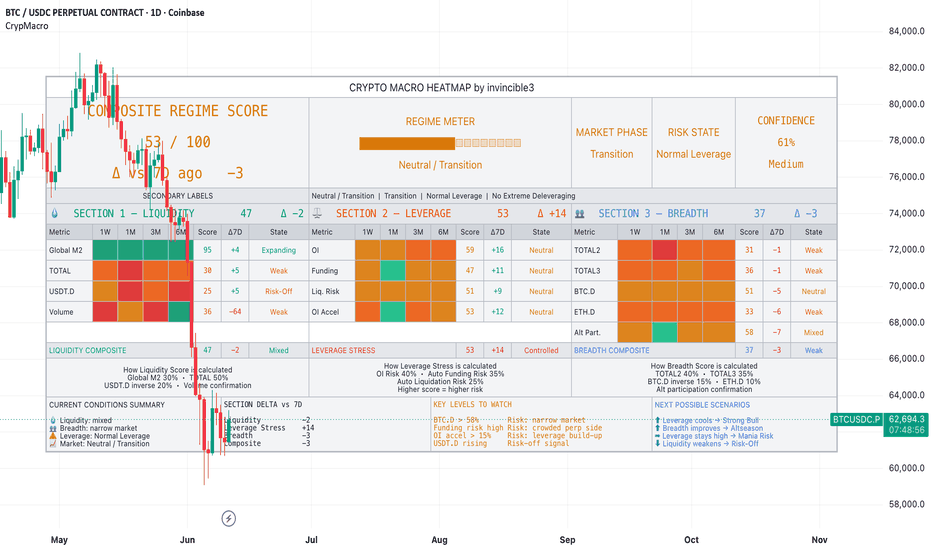
Crypto: Macro Heatmap [invincible3]Crypto Macro Heatmap is an automatic market-regime dashboard designed to summarize crypto macro conditions using liquidity, leverage, breadth, and risk-participation metrics.
The indicator converts multiple market data sources into normalized 0–100 scores and displays them in a structured heatmap table. It is built to help traders quickly understand whether the broader crypto environment is risk-on, neutral, or risk-off.
Main dashboard sections:
1. Liquidity
Tracks Global M2, total crypto market cap, USDT dominance, and BTC volume confirmation. Higher liquidity scores generally suggest stronger macro support for crypto markets.
2. Leverage
Tracks open interest pressure, funding-risk proxy, liquidation-risk proxy, and OI acceleration. Higher leverage scores mean higher stress or crowding risk.
3. Breadth
Tracks TOTAL2, TOTAL3, BTC dominance, ETH dominance, and altcoin participation. This section helps identify whether market strength is broad or concentrated.
Key features:
* Fully automatic scoring
* No manual market-score inputs
* Dashboard show/hide checkbox
* Light/dark chart theme detection
* Composite regime score
* Regime meter
* Market phase detection
* Risk-state classification
* Confidence score
* Section delta versus 7 days ago
* Fixed-width heatmap layout for cleaner visual alignment
The composite score combines liquidity support, market breadth, and leverage-adjusted risk into one regime reading. The dashboard is intended for macro context and regime analysis, not direct buy or sell signals.
Use this tool as a higher-timeframe market filter together with your own technical analysis, risk management, and trading system.
Disclaimer: This indicator is for educational and analytical purposes only. It does not provide financial advice. Always do your own research and manage risk carefully.
Indicador
Indicador

MARKET OS [Viprasol]MARKET OS — Cost-Aware Regime & Signal Engine
═══════════════════════════════════════════════════════════
THE IDEA IN ONE LINE
═══════════════════════════════════════════════════════════
Most indicators read one thing — trend, volume, or structure — and leave you
to guess the rest. MARKET OS reads the market across four independent
dimensions at once, fuses them into a single 0-100 Market Score, and grades
every signal A/B/C — including something no other signal engine on
TradingView shows: the estimated ROUND-TRIP TRADING COST of taking that
signal, stamped right on the label.
═══════════════════════════════════════════════════════════
THE FOUR DIMENSIONS
═══════════════════════════════════════════════════════════
1. DIRECTION — adaptive trend + market structure
A Kaufman Adaptive Moving Average (KAMA) baseline that hugs price in
trends and slows down in chop, combined with swing structure tracking
(BOS continuation counts and CHoCH reversals with a configurable
confirmation requirement). Direction scores highest when adaptive trend
and structure AGREE.
2. QUALITY — efficiency regime
The Kaufman Efficiency Ratio (0 = pure chop, 1 = perfect one-way move)
classifies the environment as TRENDING / TRANSITION / CHOPPY. A breakout
in a trending regime and the same breakout in chop are not the same trade
— this dimension prices that difference into the score.
3. PARTICIPATION — effort vs result (Wyckoff)
Relative volume (EFFORT) is compared against ATR-normalized price movement
(RESULT) on every bar:
• High effort + high result = CONVICTION (real participation)
• High effort + low result = ABSORPTION (volume swallowed — warning
crosses on the chart; a classic exhaustion footprint)
• Low effort + high result = THIN MOVE (prone to fade)
4. COST — EDGE effective spread (the genuinely new part)
The engine embeds the EDGE estimator from Ardia, Guidotti & Kroencke,
"Efficient Estimation of Bid-Ask Spreads from Open, High, Low, and Close
Prices", Journal of Financial Economics 161 (2024) — an asymptotically
unbiased estimator of the effective bid-ask spread computed from nothing
but OHLC bars. The current spread is ranked against the symbol's own
history, so the engine knows when this market is CHEAP or EXPENSIVE to
trade. To my knowledge this is the first TradingView signal engine that
measures its own trading cost.
═══════════════════════════════════════════════════════════
THE FUSION: MARKET SCORE & STATE
═══════════════════════════════════════════════════════════
The four dimensions are combined into a weighted composite score
(Direction 30%, Quality 30%, Participation 25%, Cost 15%):
75-100 ◆ PRIME — everything aligned, cheap to trade
55-74 ◆ FAVORABLE — good conditions
35-54 ◆ MIXED — partial alignment
0-34 ◆ HOSTILE — choppy / absorbed / expensive (background shaded)
Candles are colored on a continuous gradient from neutral gray to full trend
color as the score rises — you can see environment quality at a glance,
without reading a single number.
═══════════════════════════════════════════════════════════
SIGNALS — GRADED AND COST-STAMPED
═══════════════════════════════════════════════════════════
Entries are structure reversals (CHoCH) confirmed by the adaptive trend,
gated by a minimum score, and stamped with:
▲ LONG
Score 82
Cost 4.2t / Tgt 38t (11.1%)
That last line is the engine's cost-awareness: estimated round-trip spread
cost in ticks, your ATR-based target in ticks, and the percentage of your
target the spread will consume. If the cost eats 25%+ of the target, an
alert can tell you the trade is structurally overpriced — BEFORE you take it.
C-grade signals (reversal fired, but the environment scored poorly) are
hidden by default. They look like signals and trade like donations.
═══════════════════════════════════════════════════════════
HOW TO USE
═══════════════════════════════════════════════════════════
1. Pick a Preset: Fast (1-15m), Default (15m-1H), Smooth (1H+).
2. Trade A-grade signals in PRIME/FAVORABLE states, in the signal direction.
3. Treat ABSORPTION crosses as early reversal warnings.
4. Check the Round-Trip Cost row before entering — if the spread eats a
large slice of your target, size down, widen the target, or skip.
5. Use HOSTILE shading as a stand-aside filter.
6. Raise "Minimum Score to Signal" for fewer, cleaner entries.
═══════════════════════════════════════════════════════════
SETTINGS
═══════════════════════════════════════════════════════════
Engine — preset, KAMA length, structure pivot width.
Quality — ER smoothing and trending/choppy thresholds.
Participation — effort and result thresholds.
Cost — EDGE window, cost-regime lookback, target size in ATR multiples.
Signals — minimum score, C-grade visibility, BOS-before-flip, cooldown.
Visuals — colors, adaptive cloud, structure levels, gradient candles,
hostile shading, absorption markers.
Dashboard — position and size.
Alerts (8): Long, Short, A-Grade Signal, Prime State, Hostile State,
Absorption, High Cost Regime, Cost Eats Edge (≥25% of target).
═══════════════════════════════════════════════════════════
HONEST LIMITATIONS
═══════════════════════════════════════════════════════════
• The EDGE estimator is asymptotic — short windows are noisy, and on very
illiquid symbols or synthetic OHLC feeds (some forex/CFD data) the cost
dimension degrades; the engine then treats cost as neutral rather than
fabricating a number.
• Volume-based participation requires reliable volume data.
• Structure detection depends on pivot settings and timeframe.
• The score weights encode a judgment (direction and quality matter most);
they are not optimized parameters and you should not treat the score as a
probability.
• This is an analytical decision-support tool, not a trading system. Past
performance does not guarantee future results. Not financial advice.
═══════════════════════════════════════════════════════════
CREDITS & ORIGINALITY
═══════════════════════════════════════════════════════════
The EDGE estimator methodology belongs to David Ardia, Emanuele Guidotti and
Tim A. Kroencke (Journal of Financial Economics 161, 2024, 103916,
doi 10.1016/j.jfineco.2024.103916). KAMA and the Efficiency Ratio are Perry
Kaufman's public concepts; Effort-vs-Result is a Wyckoff principle. All code
in this script — the Pine implementation of EDGE from the published formulas,
the four-dimension fusion model, the composite scoring and state machine, the
cost-stamped signal engine, and all visualization — is original Viprasol work
written from scratch for this indicator. No third-party Pine code is reused.
Indicador

ORB Retest Pro v3 + Smart ZonesORB Retest Pro v3 + Smart Zones is a customizable Opening Range Breakout indicator built for traders who want clean ORB structure, retest-based entries, and real-time smart money confluence on the chart.
The indicator maps the Opening Range High, Low, Mid, and ORB box, then waits for price to break the range and retest it before printing a signal. This helps filter out weaker breakout candles and focuses on more structured continuation setups.
In addition to ORB logic, the script detects and displays real-time Fair Value Gaps (FVGs), Inversion Fair Value Gaps (IFVGs), Order Blocks (OBs), and Breaker Blocks using customizable zone boxes. Zones can be shown or hidden individually, colors can be fully customized, and broken zones can automatically remove themselves from the chart to keep the layout clean.
A key feature of this indicator is its smart zone behavior. When enabled, broken FVGs can automatically convert into IFVGs, allowing the chart to reflect changing market structure instead of leaving outdated zones on screen. You can also keep zones from previous sessions visible and control the number of days to look back, making it useful for both intraday and multi-session analysis.
The indicator is designed to work well on futures and stocks, with adjustable session times, timezone settings, and an optional timeframe filter so the ORB can be tailored to different markets and trading styles.
Features
Custom Opening Range session
Adjustable timezone
ORB high, low, mid, and box
Break + retest signal logic
Optional reclaim / rejection close confirmation
ATR displacement filter
Minimum breakout distance in ticks
Retest must occur within a user-defined number of bars
One signal per side per day or one total signal per day
Real-time FVG, IFVG, OB, and Breaker detection
Fully customizable zone colors and visibility
Optional automatic removal of broken zones
Optional FVG to IFVG conversion
Ability to keep previous-day zones on the chart
Adjustable lookback period
Confluence-based signal coloring
Built-in alerts
Best use
This indicator is best used on intraday charts such as 1m, 3m, 5m, and 15m, especially for traders who want to combine Opening Range Breakout structure with smart money zone confluence.
Notes
FVG, IFVG, Order Block, and Breaker logic are rule-based and designed for consistent automation inside Pine Script. They may not match every discretionary interpretation exactly, but they provide a structured and practical framework for real-time chart analysis.
Indicador

Volume Profile Composite, Naked POC & Value-AreaVolume Profile — Composite, Naked POC & Value-Area
==================================================
WHAT IT IS
A volume-at-price profile built for depth and decisions. It measures where trade
actually concentrated across the loaded history, distils that distribution into
the levels traders use — Point of Control (POC), Value Area (VAH/VAL), High and
Low Volume Nodes (HVN/LVN), and untested "naked" prior-session POCs — and then
converts those levels into a plain-language read of where price sits in the
auction (premium, discount, or inside value; balancing or migrating).
It is a study for chart analysis and education. It plots levels and context; it
does not place orders and does not output buy/sell signals.
HOW IT WORKS (ENGINE)
Volume is accumulated bar by bar into a price-keyed map on a fine grid (the
symbol's minimum tick multiplied by a user factor), then re-aggregated to the
chosen number of display rows. Because the engine uses a map rather than a fixed
lookback array, the profile can span every loaded bar instead of only a recent
window, and it is not limited by the historical bar-reference ceiling.
Each bar's volume is distributed across that bar's high-low range over a capped
number of samples, and tagged buy or sell by bar direction, producing a two-tone
histogram and a per-level delta. Where intrabar (lower-timeframe) data is
available, recent history can optionally be refined from it; older bars fall back
to the bar-range method. The Value Area is grown outward from the POC bin until
the chosen percentage of total volume is captured. Prior-day, prior-week and
full-history composite levels reuse the same value-area routine on their own maps.
The heavy redraw runs on bar open/close rather than on every realtime tick, to
keep live charts responsive.
WHY THESE COMPONENTS ARE COMBINED (MASHUP JUSTIFICATION)
This is one volume-profile engine, not a stack of independent indicators. Every
layer is computed FROM THE SAME accumulated volume map, and each one exists to
remove a specific blind spot of the raw histogram. A bare histogram only answers
"where did volume happen"; it cannot tell you whether price is rich or cheap,
which level matters next, or whether the market is balancing or trending. The
combined layers answer those questions, and they work together as follows:
- POC and Value Area transform the raw distribution into a fair-value frame, so
every other reading can be expressed as premium, discount, or inside value.
- HVN and LVN classify each price level produced by that same distribution as
acceptance (a volume shelf where reactions are more likely) or a thin gap
(where price tends to move quickly). This tells you how a level is likely to
behave, which the POC/Value Area alone do not.
- Naked prior-session POCs carry acceptance forward in time: they are POCs from
earlier sessions that price has not yet traded back through, derived from the
same per-session maps, and they act as revisit references.
- Value migration is simply the sequence of those session POCs read as a
direction, turning the profile history into a balancing-versus-trending read.
- The composite overlay keeps the full-history POC and Value Area in view while
you work a shorter, more legible recent window, so context is never lost.
- VWAP, Initial Balance, an expected-move band, and cumulative-volume-delta
divergence are confluence layers. They are optional and each degrades
gracefully if its data is absent. They are included because volume-profile
levels are used in context: VWAP gives the session's volume-weighted mean,
Initial Balance gives the opening reference, the expected-move band frames a
realistic day's range, and CVD-versus-price flags exhaustion. Each one answers
"does independent volume/price information agree with what the profile shows
here?", which is exactly how these levels are traded in practice.
- The Auto-Read is the synthesis step: it does not add new data, it ranks the
levels the engine already produced by distance to price and states the auction
context in words.
In short, the histogram is the raw material and every other element is a
transformation of that same data into a level, a classification, a confluence
check, or a written read. That shared derivation is the reason they belong in a
single script rather than as separate indicators.
WHAT IT PLOTS
- Buy/sell two-tone histogram, drawn in the clear space to the right of price so
candles stay visible.
- POC, Value Area (VAH/VAL, adjustable percentage), HVN/LVN nodes.
- Naked daily POCs, with a creation-time check that skips levels already traded
through and an optional age-out so the list stays meaningful.
- Polarity flip: a prior-day Value Area edge that price closes decisively beyond
and holds changes role (broken VAH becomes support; broken VAL becomes
resistance) and feeds the support/resistance read.
- Prior-day and prior-week POC/Value Area, full-history composite overlay,
developing POC.
- VWAP with standard-deviation bands, Initial Balance, expected-move band,
cumulative-volume-delta divergence, buy/sell imbalance shelves, poor highs/lows,
single-print gaps.
- Higher-timeframe POC bias (a light proxy — see Limitations).
- Auto-Read dashboard (full or compact), one-line headline, and an on-chart
identity strip showing the script name, symbol and timeframe.
HOW TO USE
1. Choose a scope: Rolling (default), Composite (all history), From date, or
Fixed range. The composite overlay keeps the big-picture levels visible.
2. Read location first from the headline or dashboard: inside value, premium, or
discount, and whether value is migrating up, down, or flat.
3. Treat the levels as a map, not a signal. POC acts as a mean-revert magnet;
Value Area edges are balance boundaries; HVN suggests stalls; LVN suggests
fast moves; a naked POC is a revisit reference.
4. Look for confluence with VWAP, Initial Balance, and prior-session levels, and
treat CVD divergence as a caution flag.
5. Detail presets (Simple / Standard / Pro) gate how much is shown. A compact
dashboard toggle trims the table to the key decision fields.
WHAT MAKES IT ORIGINAL
- Full-history depth via the price-keyed map, beyond a fixed lookback window.
- A built-in, past-only calibration of the profile's own claims: it logs
value-edge and POC-stretch reversion events against the prior-day Value Area
(which exists on every bar, so the measurement backfills over history), waits a
fixed horizon, and reports the realised hit-rate with a 95% confidence
interval. This is descriptive of past behaviour on the specific instrument; it
is explicitly not a backtest and not a forecast.
- A decision-ordered, plain-language Auto-Read derived entirely from the engine's
own levels.
DATA SOURCE AND ANY-MARKET USE
The volume source is user-selectable (Settings > Data source), so the profile can
be built from the symbol's own volume or from any other series your feed
provides. For symbols that report no native volume (some cash indices and FX
feeds), an optional "borrow volume" field lets you supply a volume-bearing proxy
for the same instrument; it only activates when the charted symbol genuinely has
no volume. The volatility-index symbol for the expected-move band is also
user-set and falls back to a daily-ATR band when left blank. An optional
asset-class auto-tune adapts the grid and node percentiles to the detected class.
All of these are blank or off by default, so nothing is tied to one market.
CALIBRATION NOTE
The calibration panel is descriptive only. It reports how often, in the past, on
the current symbol, price followed through after the logged events. Small samples
are flagged. It is not a probability of future results.
LIMITATIONS (HONEST)
- This uses a BAR-RANGE volume distribution (optionally refined by lower-timeframe
bars). It approximates where volume traded within each bar. It is NOT exchange
price-by-price volume, tick data, or order-flow/footprint, and it cannot see
bid/ask.
- It needs real volume. Cash indices often report none — use the matching future
or continuous contract, or the borrow-volume field.
- The higher-timeframe POC is a light single-bar proxy (the price of the
highest-volume higher-timeframe bar over a lookback), not a full higher-
timeframe profile.
- All readings are probabilistic context, not predictions.
DISCLAIMER
This script is a study/indicator for chart analysis and education only. It is NOT
a strategy, NOT a recommendation, and NOT financial advice. It places no orders
and guarantees no result. Trading involves substantial risk; a level's past
behaviour does not assure future behaviour. Do your own research and manage your
own risk.
Indicador

Stock: Comparison Dashboard [invincible3]Stock: Comparison Dashboard
**Stock: Comparison Dashboard ** is a fundamental and market-strength comparison tool designed to compare two stocks side by side directly on the TradingView chart.
The dashboard helps traders and investors quickly evaluate which stock is stronger across multiple financial dimensions, including growth, income statement strength, profitability, valuation, cash flow quality, financial strength, liquidity, dividend quality, and relative price strength.
Key Features
1. Two-Stock Comparison
Select any two symbols and compare their financial metrics side by side. The dashboard displays both raw values and category-based scores.
2. Fundamental Metrics
The indicator includes a wide set of financial metrics, such as:
* Revenue growth
* EPS growth
* Total revenue
* Operating income
* Net income
* Margins
* Return on equity
* Price-to-earnings ratio
* Price-to-sales ratio
* Free cash flow
* Debt ratios
* Current ratio
* Dividend yield
* Dividend payout ratio
3. Category Scores
The dashboard calculates separate comparison scores for:
* Growth Score
* Income Score
* Profitability Score
* Valuation Score
* Cash Flow Score
* Financial Strength Score
* Liquidity Score
* Dividend Score
* Relative Strength Score
4. Proportional Scoring System
The scoring system uses proportional comparison instead of simple winner-take-all logic.
For example, if one stock has 16% growth and another has 18% growth, the weaker stock does not receive 0. Instead, both stocks receive proportional scores based on how close their values are.
This makes the dashboard more realistic and useful for financial analysis.
5. Relative Strength Score
The Relative Strength Score compares the market performance of both stocks using:
* 3-month price performance
* 6-month price performance
* 12-month price performance
* Position within the 52-week range
* Distance from the 200-day moving average
This helps identify which stock has stronger market momentum.
6. Better / Weaker Value Highlighting
Better and weaker values are highlighted using text color instead of heavy background coloring. This keeps the table cleaner and easier to read.
7. Light and Dark Table Themes
The dashboard includes both light and dark table themes, making it suitable for different TradingView chart layouts.
8. Customizable Rows
Each category allows the user to choose which metrics to display. Unwanted rows can be set to “None” to keep the dashboard clean.
How to Use
1. Select Stock 1 and Stock 2 from the indicator settings.
2. Choose the financial period: Quarter or Year.
3. Select the metrics you want to compare in each category.
4. Choose Light or Dark table theme.
5. Read the raw values and comparison scores to identify the stronger stock.
Interpretation
A higher score means the stock is stronger in that specific category.
Example:
* Higher Growth Score = stronger growth profile
* Higher Profitability Score = better profitability
* Higher Valuation Score = more attractive valuation
* Higher Financial Strength Score = stronger balance sheet
* Higher Relative Strength Score = stronger market momentum
Important Notes
This indicator uses TradingView financial data. Some financial fields may be unavailable for certain stocks, exchanges, or periods. If a metric is unavailable, the table may show a dash.
TradingView also has request limits, so the dashboard is designed to keep the number of active financial rows under control.
This indicator is intended for research, comparison, and educational analysis only. It is not financial advice. Always combine fundamental analysis with your own research, risk management, and market context.
Indicador

Gold Macro Bias TableGold Macro Bias Table
Gold Macro Bias Table is designed to provide a fast, structured and multi-dimensional overview of the current gold market environment. The main goal is to help traders quickly assess how different macroeconomic, intermarket, risk, volatility, volume and technical factors are currently aligned.
Gold is influenced by many different drivers. Real yields, the US dollar, Treasury yields, bond-market behavior, foreign exchange dynamics, silver, gold miners, credit markets, volatility and technical momentum can all affect price behavior. Instead of analyzing every related market separately, this indicator brings the most relevant inputs together in one compact dashboard.
The indicator is not intended to predict future price movement. It is a decision-support tool that helps traders understand whether the current market background is more supportive, neutral or opposing for gold.
Data Sources and Market Inputs
The script uses TradingView market data based on the symbols selected in the settings. The default symbols can be adjusted by the user.
Real Yield:
The real yield input is used to represent inflation-adjusted interest-rate pressure. Rising real yields are generally negative for gold because they increase the opportunity cost of holding a non-yielding asset. Falling real yields are generally supportive for gold.
DXY:
The US Dollar Index is used as a broad measure of US dollar strength. A stronger dollar is usually a headwind for gold, while a weaker dollar can support gold prices.
US10Y and US02Y:
US Treasury yields are used to measure interest-rate pressure across different parts of the yield curve. Rising yields can pressure gold, while falling yields can support gold, especially when combined with a weaker US dollar.
TLT:
TLT is used as a proxy for long-duration US Treasury bonds. Strength in TLT often reflects falling long-term yields, which can be supportive for gold.
USDJPY:
USDJPY is included as a rate-sensitive and dollar-sensitive FX input. A rising USDJPY can often reflect stronger US rate pressure or broader US dollar strength, which may be negative for gold.
Silver:
Silver is used as a precious-metals confirmation factor. Strength in silver can confirm broader demand for precious metals, while weakness may indicate a lack of confirmation.
GDX:
GDX represents gold miners. Miner strength can confirm institutional appetite for the gold sector, while miner weakness can warn that gold strength is not broadly supported.
VIX:
The VIX is used as a volatility and risk-sentiment input. Higher volatility can increase safe-haven demand, but very elevated volatility also means higher trading risk.
HYG:
HYG is used as a credit-risk proxy. Strength in high-yield credit usually points to more risk-on conditions, while weakness can indicate stress in credit markets.
Scoring and Weighting
The table compares each selected input with its moving average and assigns a score depending on whether the current condition is considered supportive or opposing for gold.
The score values and weightings are fully adjustable in the settings. This allows each trader to adapt the model according to personal experience, trading style and individual interpretation of how important each factor is for the current market environment.
The total score is displayed as the Macro Gold Bias.
Volatility
The volatility section compares the current ATR percentage with its own average. This helps identify whether the market is currently calm, normal, elevated or extreme. The volatility reading is used as additional context, especially when market conditions become unstable or risk expands quickly.
Volume and Delta
The volume section provides a quick overview of session volume, estimated session ask volume, estimated session bid volume and estimated session delta.
The intraday delta values for 1m, 5m, 15m and 1h are calculated from the available TradingView chart data. These values are not true exchange bid/ask volume and should not be interpreted as real order-book flow.
They are tick-volume-based approximations designed to give the trader a practical feeling for current market behavior, volume pressure and whether recent activity appears more buy-side or sell-side dominated.
Average Volume and Delta
The average row compares the current session and intraday delta behavior with configurable lookback periods. The session average volume lookback and the delta lookbacks for 1m, 5m, 15m and 1h can be adjusted in the settings.
This helps put current activity into context instead of relying on isolated volume or delta values.
Technical Gold Bias
The technical section uses TradingView’s built-in Technical Ratings, often known from the TradingView Technical Rating gauge. It combines information from multiple moving averages and oscillators into a normalized technical reading.
This separates the technical condition of gold from the broader macro and intermarket environment.
Market Regime
The market regime section classifies the current environment into broader categories such as:
Safe Haven
Yield Pressure
Dollar Pressure
Inflation Hedge
Yield Relief
Mixed
This gives additional context behind the raw score and helps explain why the current environment may be supportive, opposing or mixed for gold.
Final Gold Bias
The final bias combines the macro score, technical rating, market regime and volatility context into one final interpretation. It is designed to provide a fast overview of whether current conditions are bullish, bearish, mixed or high risk.
Trend Strength
The trend strength score ranges from -10 to +10. It combines macro direction, technical direction and market regime support into a simple strength reading.
A positive value indicates a more supportive environment for gold, while a negative value indicates a more opposing environment.
Price Movement Alerts
The indicator includes configurable price movement alerts for gold and the selected macro symbols.
The purpose of these alerts is not to generate buy or sell signals. They are designed as warning signals when one or more monitored symbols exceed the user-defined percentage threshold.
This can be useful because related markets do not always react at the same speed. Some symbols may move earlier and provide a warning that the market environment is changing, while others may react later. These alerts can help traders recognize fast market movement, unstable conditions or situations where it may be necessary to reduce exposure or step out of the market.
TradingView alerts can be configured through the normal TradingView alert menu. Depending on the user’s TradingView settings, notifications can be sent by app, pop-up, email, webhook or other available alert actions.
Important Note
This indicator is not a standalone trading system and does not provide financial advice. It should be used together with price action, market structure, risk management and personal trade planning.
All readings depend on the selected symbols, the active data feed, the chosen timeframes and the user-defined settings.
Indicador

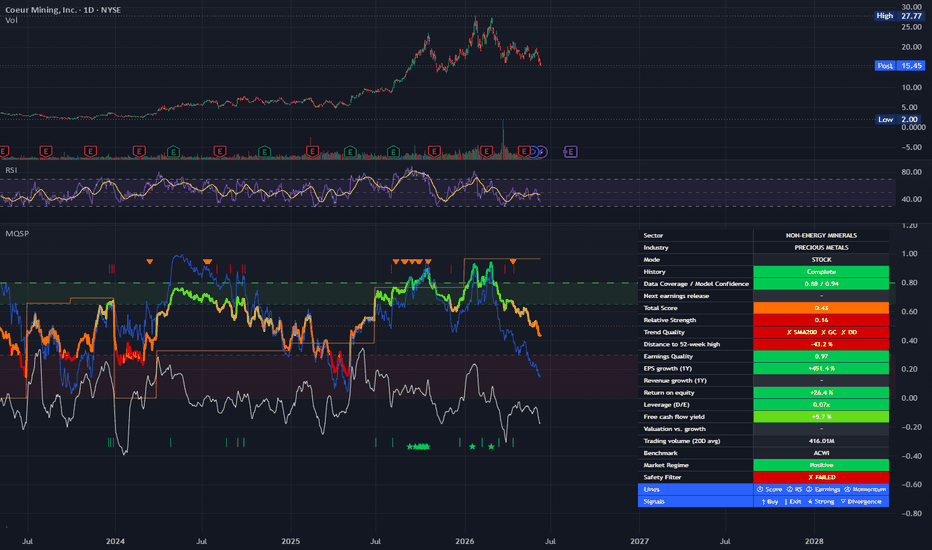
Market Quality Score ProMarket Quality Score Pro is a multi-factor scoring indicator that helps you evaluate stocks, ETFs, indices, bonds, crypto, forex, and commodities with one unified framework. It combines relative strength, trend quality, and (where available) fundamental quality into a normalized score from 0.00 to 1.00, then translates that score into practical signal zones such as Watch, Buy, Strong Buy, or Avoid.
The indicator is designed to adapt to different instrument types automatically. For stocks, it can include earnings growth, revenue growth, and return on equity, while for ETFs, indices, bonds, and many other instruments it focuses more on relative strength, benchmark comparison, trend structure, and data quality.
Key features:
Multi-factor total score from 0.00 to 1.00.
Relative strength model based on 12-month ex-last-month, 6-month, 3-month, distance to 52-week high, and RS-line slope.
Trend quality model based on SMA200, 50/200 structure, and drawdown control.
Fundamental quality block for equities using EPS growth, revenue growth, and ROE where valid data exists.
Automatic benchmark selection by market and region, with optional manual override.
Coverage and confidence logic to reduce overconfidence when data is incomplete.
Safety filter for trend condition, drawdown quality, and tradability.
Signal markers for Buy, Strong Buy, Exit, and Divergence.
Informative table with benchmark, market regime, history quality, score components, and model status.
How to read it:
Above 0.50: instrument becomes interesting.
Above 0.65: enters the buy zone if additional gates and filters are satisfied.
Above 0.80: strong candidate with stricter confirmation logic.
Below 0.30: weak zone or avoid area.
This script is not a standalone trading system and should not be used in isolation. Signals are strongest when read together with price structure, liquidity, market regime, and upcoming event risk such as earnings releases Indicador
Indicador

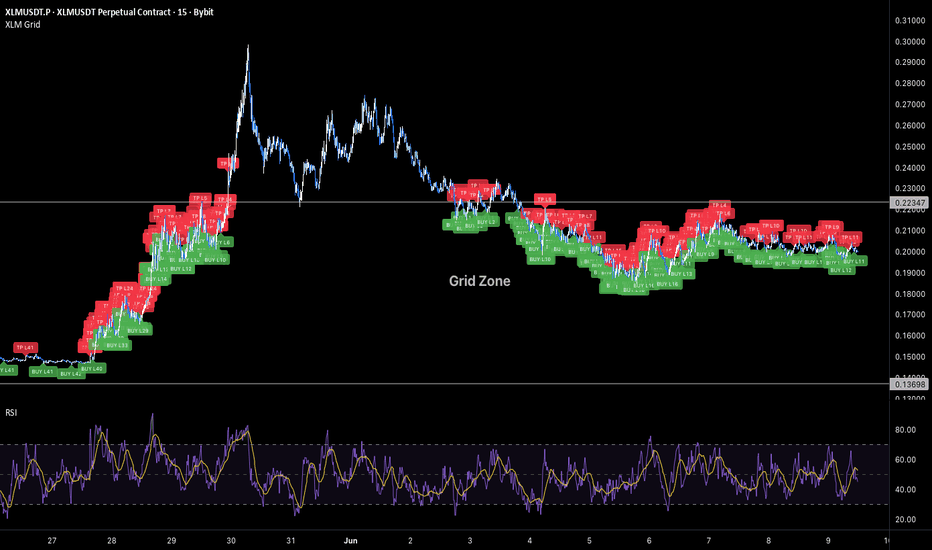
[3Commas] XLM Grid Bot - Long Strategy XLM Grid Bot — Long Strategy
🔷 What it does:
This is a long-only price-grid strategy that harvests volatility on XLM / USDT through repeated round-trips on a pre-defined ladder of price levels between two fixed bounds. Each level is an independent slot: when price crosses down through a level, the strategy opens one slot; when price subsequently crosses up through the level immediately above, that slot is closed for a fixed round-trip profit. The grid is generated geometrically by default, so spacing adapts to the price scale.
- Up to 50 simultaneous long slots at default settings, each sized as a fixed fraction of the configured Total Investment.
- No trailing exit, no stop loss — each slot's exit is the level above its entry.
- Per-slot exposure is approximately 2.00% of equity at default settings, comfortably inside the conventional 5–10% per-trade risk band.
- Every fill and close emits a webhook-ready JSON alert payload tagged with the specific grid slot.
🔷 Who is it for:
- Swing traders harvesting volatility on XLM in range-bound regimes.
- Bot operators looking for a chart-driven signal source with per-slot webhook JSON ready to drive a DCA Bot configured for grid execution.
- Traders running a portfolio of low-correlation strategies who want a high-trade-count contributor with bounded per-trade risk.
- Range traders who prefer mechanical execution over discretionary entries.
🔷 How does it work:
Grid Construction: On script load, the strategy computes N price levels between the configured High and Low bounds. In Geometric mode (default), level k is at High × (Low/High)^(k/(N-1)), giving constant percent spacing — approximately 1.0% per step at default settings. In Arithmetic mode, levels are linearly spaced by absolute price.
Per-Slot Logic: Each grid level is an independent slot tracked by a boolean ownership flag. When bar close moves price down through an empty slot's level, a long is opened at that level for one slot's worth of capital (Investment / N). When bar close moves price up through the level immediately above an owned slot, that slot is closed, locking the round-trip profit between the two adjacent levels.
No Trailing, No Stop Loss: By design, each slot has a fixed exit (the level above). The strategy never trails the exit and never stops a slot out for a loss — slots whose entry price is below current market simply wait until price comes back. This is the canonical grid-bot behavior.
Capital Bounds: Total deployed capital cannot exceed the configured Investment. When all 50 slots are filled, no new orders are opened until price rises and starts closing slots. This structural cap is the strategy's primary risk control.
🔷 Why it's unique:
- Per-Level Webhook Ledger: Every fill and close emits a fully-formed JSON alert payload tagged with the specific grid slot ("Grid_BUY_L5" / "Grid_TP_L5"). The strategy can drive a DCA Bot configured for grid emulation without any glue layer.
- Pre-Allocated State: All up to 200 slot ledgers live in fixed-size arrays, so state lookups are constant-time and the chart can render every active slot with no performance overhead.
- Honest Backtest Surface: The avg entry line plotted on the chart and the open PnL displayed in the status table both reflect the actual broker-equivalent position state — derived from fill-by-fill bookkeeping, not synthetic averaging. The status table also reports the cumulative realized net profit (how much the grid has actually earned, in USDT and % of starting capital), so live performance is visible directly on the chart.
- Calibrated for XLM 15m: Default bounds, level count, and step size are set against XLM's recent observed range. The 50-level geometric ladder gives roughly 1.0% per step — wide enough to clear taker fees on each round-trip, granular enough to keep catching 15m swings inside the range.
🔷 Considerations Before Using the Strategy:
Market Selection & Range Validity: Grid strategies are most profitable in range-bound, mean-reverting markets. On strong directional trends below the configured Low, slots will keep loading as price falls and won't close until price reverses. The default High/Low (0.22347 / 0.13698) was set against XLM's recent observed range; update both whenever the regime changes.
Capital Deployment & Drawdown: The default Investment of 10,000 USDT equals 100% of starting capital — high-conviction setting that assumes the configured range holds. Per-slot risk is low (~2.00% of equity), but if price collapses below the Low bound, aggregate unrealized loss can grow further. Scale the Investment input down to match the worst-case drawdown you are willing to absorb in a range-break scenario.
No Stop Loss Justification: There is no exit on adverse moves below the lowest grid level. The strategy's per-trade risk is structurally capped by the per-slot allocation (Investment / N levels) — at defaults that is ~200 USDT per slot, well inside the conventional 5–10% per-trade band. The aggregate unrealized exposure is controlled separately via the Investment input.
Trade Volume & Fees: Grid bots on 15m generate a high number of round-trips. The ~1.0% step is deliberately wider than a tight scalp grid so each round-trip comfortably clears the taker fee. The default commission (0.06% per trade) should be matched to your exchange's actual fees; any mismatch will materially shift the results.
Demo Testing: Always demo-test before going live. Past results do not guarantee future performance, especially on a strategy whose profitability is bounded by the chosen High/Low range remaining valid.
🔷 STRATEGY PROPERTIES
Symbol: BYBIT:XLMUSDT.P (Perpetual) — strategy is portable to any XLM / USDT pair.
Timeframe: 15M
Test Period: February 1, 2026 — June 9, 2026 (~4.3 months).
Initial Capital: 10,000 USDT.
Total Investment: 10,000 USDT (100% of capital, high-conviction setting).
Order Size per Slot: Investment / 50 = 200 USDT (~2.00% of equity).
Commission: 0.06% per trade.
Slippage: 3 ticks.
Margin for Long Positions: 100%.
Indicator Settings: Default Configuration.
Grid Bounds: High 0.22347 / Low 0.13698 (range −38.70%).
Grid Levels: 50 (Geometric spacing, ~1.0% per step).
Stop Loss: None — per-slot allocation is the structural risk cap.
Trailing: None.
Strategy: Long Only.
🔷 STRATEGY RESULTS
⚠️ Remember, past results do not guarantee future performance.
Net Profit: +2,167.03 USDT (+21.67%)
Max Equity Drawdown: 761.57 USDT (7.53%)
Total Closed Trades: 1,076
Percent Profitable: 62.27% (670 / 1,076)
Profit Factor: 1.932
🔷 How to Use It:
🔸 Adjust Settings: Open the strategy inputs and set the High and Low bounds to a range you expect XLM to respect. Pick Geometric for percent-spaced levels (default, recommended) or Arithmetic. Set Grid Levels (7–200) and Total Investment to match your risk profile.
🔸 Results Review: Run a full-period backtest and confirm Max Drawdown stays within your personal risk band. Validate that the trade count is high enough to be statistically meaningful — this configuration produced 1,076 closed trades over the test window, far above the ~100-trade floor for statistical relevance.
🔸 Create alerts to trigger the DCA Bot: Add one alert on the strategy using "Any alert() function call". Paste your DCA Bot's webhook URL into the alert's Webhook field, and fill the Bot ID, Email Token, and Pair inputs on the script. Every grid-level buy and grid-level close will emit a dedicated JSON payload tagged with the slot index, so each level can be tracked independently downstream.
🔷 INDICATOR SETTINGS
High Price: Top of the grid. The highest level a slot can be created from.
Low Price: Bottom of the grid. The lowest level a slot can be created from.
Grid Levels: Number of price levels between High and Low (default 50, range 7–200).
Spacing Mode: Geometric (constant percent step) or Arithmetic (constant absolute step).
Total Investment (USDT): Total capital allocated across all slots. Per-slot size = Investment / Grid Levels.
Bot ID / Email Token / Pair: Webhook fields injected into every alert payload.
Visualization: Toggle grid lines, range box, HIGH/LOW labels, avg entry plot, fill labels, status table (shows range, levels, owned slots, investment, per-slot size, open PnL, and cumulative realized net profit).
Brand Watermark: Configurable text, position, size, and transparency.
👨🏻💻💭 We hope this tool helps enhance your trading. Your feedback is invaluable, so feel free to share any suggestions for improvements or new features you'd like to see implemented.
__
The information and publications within the 3Commas TradingView account are not meant to be and do not constitute financial, investment, trading, or other types of advice or recommendations supplied or endorsed by 3Commas and any of the parties acting on behalf of 3Commas, including its employees, contractors, ambassadors, etc. Estratégia
Quarterly Earnings Here's a ready-to-paste TradingView publication description:
---
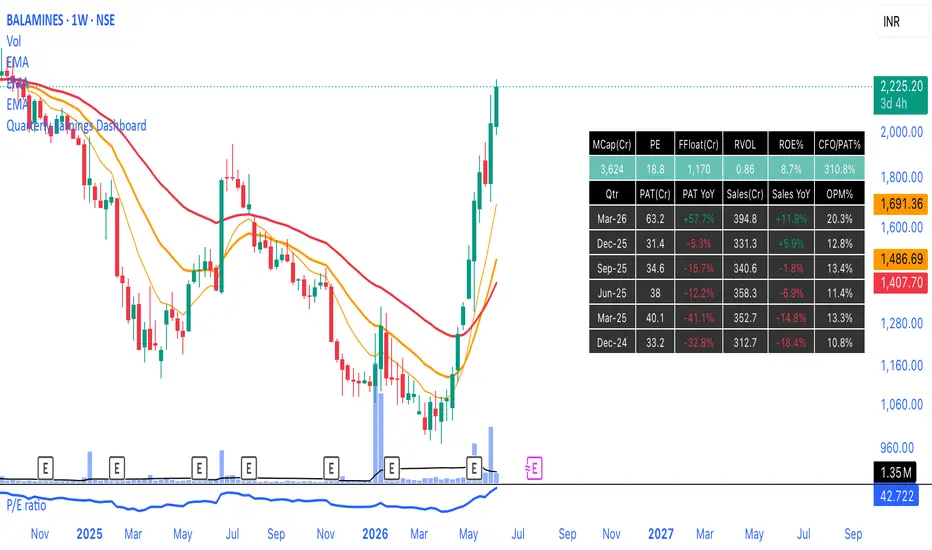
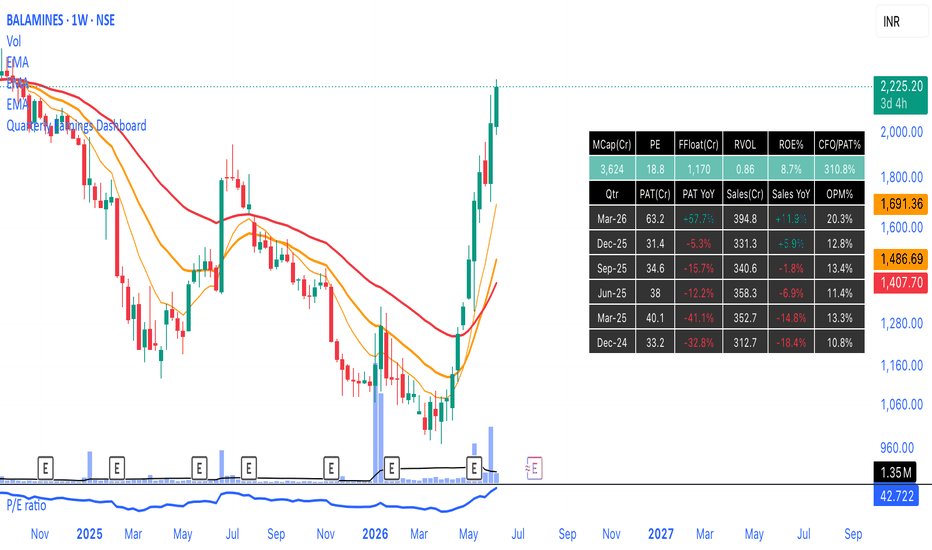
**Quarterly Earnings Dashboard**
A clean on-chart table that puts a stock's key fundamentals next to its price action — built for fundamentals-aware swing/position traders who want valuation, quality, and earnings trend in one glance without leaving the chart.
**Current snapshot (top row)**
- **MCap (Cr)** — market capitalisation
- **PE** — price-to-earnings
- **FFloat (Cr)** — free-float market cap (MCap × float shares ÷ total shares)
- **RVOL** — relative volume vs the N-bar average (configurable), to spot unusual activity
- **ROE%** — return on equity
- **CFO/PAT%** — cash conversion: operating cash flow ÷ profit after tax. ~100%+ signals profits backed by real cash; persistently low is a quality red flag.
**Quarterly earnings table**
For the last N reported quarters: **PAT (Cr)**, **PAT YoY%**, **Sales (Cr)**, **Sales YoY%**, and **OPM%**. YoY columns are colour-coded green/red so accelerating or decelerating earnings jump out.
**Inputs**
- Quarters to show (1–16)
- Reporting period (FQ / FY / TTM)
- RVOL length
- Table position and colours
**Notes**
- All data is pulled from TradingView's built-in fundamentals via `request.financial()`. Best used on a single stock's weekly or daily chart.
- Some IDs (free float, cash flow) aren't published on the quarterly feed for every market, so the snapshot falls back FQ → FY → TTM. If a cell still reads "n/a", TradingView simply doesn't carry that data for the symbol.
- RVOL is relative to the chart timeframe — on a weekly chart it's volume vs the 20-week average.
Not financial advice; for research and educational use.
---
Indicador
Institutional Fibonacci + Elliott WaveInstitutional Fibonacci + Elliott Wave — Indicator Description
Overview
This indicator combines three powerful technical analysis tools into a single overlay: Fibonacci retracement/extension levels, Elliott Wave detection, and a Volume Point of Control (POC) line. It is designed to help traders identify high-probability entry zones, validate wave structure, and project take-profit targets with institutional-grade precision.
Core Components
1. Fibonacci Retracement & Extension Levels
The indicator automatically detects the most recent confirmed swing high and swing low using a configurable pivot length, then draws the full Fibonacci grid from that range.
Retracement levels (entry/pullback zones):
0.236, 0.382, 0.500, 0.618 (Golden Ratio), 0.705 (Institutional), 0.786 (Deep), 0.886 (Extreme)
Extension levels (take-profit targets):
1.000 (TP1 — equal move), 1.272 (TP2 — Wave 3 target), 1.618 (TP3 — Golden Extension), 2.000 (TP4), 2.618 (TP5)
The Golden Zone (0.618–0.786) is highlighted with a shaded box — historically the highest-probability reversal area in trending markets. A TP1 zone box is also drawn around the 1.000 extension.
Direction is set automatically: if the most recent confirmed pivot was a high, the grid is drawn bullish (low → high); if a low, it draws bearish (high → low). Every level includes an optional price label and percentage distance from the 0.618 entry.
2. Elliott Wave Detection
The indicator scans recent pivot history for a valid 5-wave impulse pattern, applying the three core Elliott Wave rules:
Wave 2 never retraces beyond the start of Wave 1
Wave 3 is never the shortest impulse wave
Wave 4 does not overlap Wave 1's price territory
When a pattern is confirmed, it draws labeled wave points (W1–W5) connected by colored lines — solid cyan for impulse waves, dashed orange for corrective waves. It also projects forward targets:
W5 Min / W5 Max — expected completion range for Wave 5
ABC-C — the likely endpoint of the subsequent corrective wave
Both bullish and bearish impulse structures are detected.
3. Point of Control (POC)
The POC line marks the price level with the highest traded volume over a configurable lookback window (default: 300 bars). It is calculated by dividing the price range into buckets and finding the bucket with the most cumulative volume — similar to a simplified volume profile.
The POC acts as a strong support/resistance magnet. Price tends to revisit and consolidate around it, making it useful for:
Confirming Fibonacci entry zones when POC aligns with the 0.618–0.786 area
Identifying likely reversal points if price is extended far from POC
4. Information Table
A compact on-chart table (position configurable) displays:
All 7 key price levels (0.618 entry through 2.618 TP5) with current prices and % move from the 0.618 entry
Elliott Wave phase status (Scanning / Bullish Impulse / Bearish Impulse)
Wave rule validation confirmation
How to Use It
Entering a trade:
Watch for price to pull back into the Golden Zone (0.618–0.786). If the POC line sits inside or near that zone, confluence is strong. Look for a reversal candle or momentum confirmation before entering.
Setting targets:
Use the extension levels from the table as a tiered take-profit plan — partial exit at TP1 (1.000), scale out at TP2 (1.272), and let runners run toward TP3 (1.618) or beyond.
Elliott Wave confluence:
If the indicator detects a bullish impulse and you are entering near the Wave 4 zone (between W3 and W4 labels), the W5 Min/Max projections give you a forward price target range that aligns with the extension levels.
Alerts:
Five built-in alerts are available — Golden Zone entry, TP1/TP2/TP3 hits, Elliott Wave confirmation, and a POC touch — configurable directly from TradingView's alert system.
Key Settings
Setting Default Notes Pivot Swing Length21Higher = fewer, more significant swings EW Pivot Length21Match to Swing Length for consistency POC Lookback300 bars Increase for longer-term POC Price Buckets200Higher = more precise POC, heavier CPU load Show Golden Zone On Recommended to leave on Show % from Entry On Shows distance from 0.618 for each level
Best Practices
Works on any timeframe and instrument (stocks, forex, crypto, futures)
Higher timeframes (4H, Daily) produce more reliable pivot detections
Elliott Wave detection is most reliable in trending, impulsive markets — use with caution in choppy, ranging conditions
Confluence of a Fibonacci level + POC + Elliott Wave count is the strongest signal this indicator can produce Indicador

Indicador

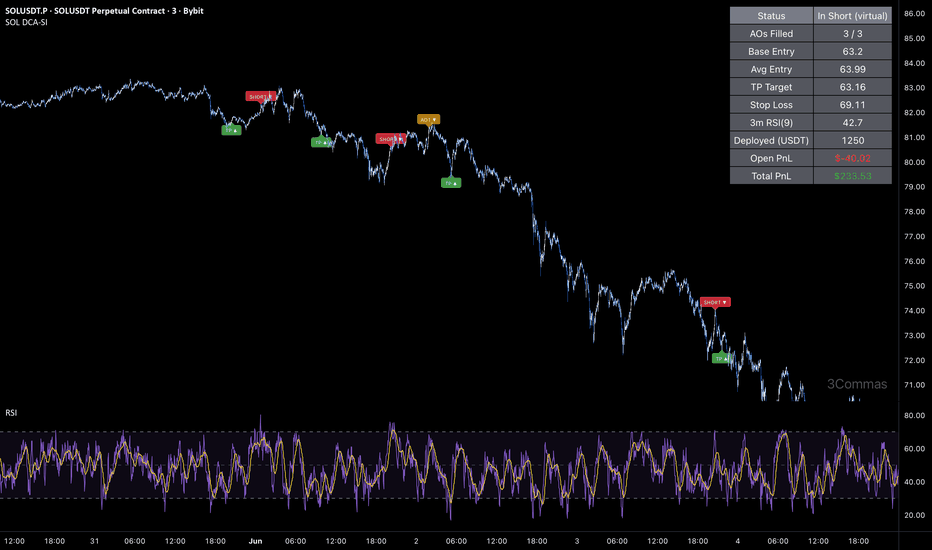
[3Commas] SOL RSI Reversal DCA - Short Indicator SOL RSI Reversal DCA - Short Indicator
🔷 What it does:
This is a signal-only indicator that mirrors a short-side mean-reversion workflow on SOL / USDT. It tracks one virtual short position at a time, opened when the 3-minute RSI(9) crosses down through 80 (overbought momentum rollover). Up to three averaging orders fill at fixed deviations ABOVE base entry (+1%, +2%, +3%) with uniform sizing. Exit is a 1.3% Take Profit with a 0.3% trailing retrace, plus a hard 8% Stop Loss. The indicator computes running average entry, deployed capital, open PnL, and lifetime realized PnL — all from honest fill-by-fill bookkeeping. Every event emits a webhook-ready JSON alert payload for direct DCA Bot consumption.
- Momentum-exhaustion trigger: 3m RSI(9) crossing DOWN through 80.
- Uniform DCA ladder: +1% / +2% / +3% above base entry, equal sizing.
- Tight 1.3% Take Profit with a 0.3% trailing lock, and a hard 8% Stop Loss.
- Honest virtual bookkeeping: Open PnL and lifetime Total PnL displayed live on the chart.
🔷 Who is it for:
- Intraday traders fading overbought spikes on SOL on lower timeframes.
- Bot operators who want a chart-driven signal source that emits per-event JSON ready for a DCA Bot.
- Traders who want a defined-risk short signal — modest averaging plus a hard stop — rather than an open-ended martingale.
- Operators tracking staged position management (entry, up to three averaging fills, single exit) directly on the chart without the strategy-tester overhead.
🔷 How does it work:
Entry Trigger: A 3-minute RSI(9) is sampled via request.security with lookahead disabled (no repaint). The base short opens when that RSI crosses DOWN through 80 — the prior 3m close was ≥ 80 and the current is below it, marking the moment overbought momentum rolls over.
Base Entry: When the trigger fires, the indicator marks a virtual short, captures the base entry price, and seeds the cost-basis ledger with the configured base order size (default 500 USDT).
Averaging Orders (Uniform DCA Ladder): After base fill, the indicator monitors price deviation above the base entry. Each averaging order has a fixed deviation — +1%, +2%, +3% — with uniform sizing (250 USDT each). Each fill updates the running cost-basis and dispatches its own webhook payload, raising the virtual average entry.
Honest Virtual Bookkeeping: Total cost and qty are updated incrementally on every event, so the avg entry, deployed capital, Open PnL, and Total PnL displayed in the status table reflect the actual broker-equivalent position state — no shortcut from base entry, no synthetic averaging.
Exit (TP + Trailing): A 1.3% Take Profit below the running average entry arms a trailing exit. Once price trades through the TP level, the indicator tracks the in-favor low and signals a close when price retraces 0.3% off that low.
Stop Loss: A hard 8% Stop Loss above the average entry. If price runs against the short past that level, the close webhook fires, realized PnL accumulates, and the virtual position resets.
Lifetime Total PnL: When a cycle closes, its realized PnL accumulates into a lifetime counter. The status table displays both Open PnL (current cycle, resets on exit) and Total PnL (lifetime, persists across chart history).
🔷 Why it's unique:
- Momentum-Exhaustion Trigger: Rather than signaling on any overbought reading, the short opens specifically on the RSI crossing DOWN through 80 — the rollover moment — filtering out signals that fire while momentum is still climbing.
- Defined-Risk DCA: A modest 3-rung uniform ladder AND an 8% hard stop, so the worst-case loss per cycle is bounded and known in advance.
- Trailing Take Profit: The 1.3% target arms a 0.3% trailing exit rather than a fixed limit — capturing the reversion snap and then riding any follow-through.
- Lifetime PnL Tracking: Open PnL and Total PnL are displayed live on the chart — strategy-tester-equivalent insight without running a backtest.
- Per-Event Webhook Ledger: Up to six discrete events per cycle (entry + 3 AO fills + TP or SL), each with its own JSON alert payload. One TradingView alert with "Any alert() function call" drives a DCA Bot end-to-end.
🔷 Considerations Before Using the Indicator:
Sample Size: The companion strategy's backtest produced 100 closed trades — at the commonly used floor for statistical relevance, not far above it. The win rate and profit factor reflect favorable conditions over the test window; treat them as indicative, not a forward-performance guarantee.
Lower-Timeframe Sensitivity: The trigger runs on a 3-minute RSI. Lower timeframes generate more signals but are more sensitive to noise and fees. Confirm trade frequency and fee drag fit your execution venue.
Stop Loss Discipline: The 8% Stop Loss is the defining risk control. With base plus three averaging orders, maximum deployed capital is ~1,250 USDT (12.5% of the default reference equity); an 8% stop on that bounds the worst-case loss to roughly 1% of equity. Keep the stop enabled — removing it converts this into an unbounded martingale short.
Trend Risk: Fading overbought conditions works best in ranges and choppy regimes. In a strong sustained uptrend the short can hit the 8% stop repeatedly. The RSI-crossing-down trigger reduces but does not eliminate this.
Cross Detection Granularity: Entries, AO fills, and exits are evaluated on bar close. A bar that spikes through a level and returns within the same bar may be missed by design — this matches realistic polling behavior and avoids over-signaling on intra-bar wicks.
Live vs Historical State: The virtual position state is rebuilt from chart history each time the indicator is recompiled. If added mid-deployment or if the live bot diverges (manual interventions, partial fills), the indicator state may not match the live bot. Toggle the indicator off and on to reset.
Backtesting Note: This is an indicator, not a strategy. There is no built-in P&L tester — but the live Total PnL counter gives a running approximation. For full metrics over a ~2.8-month sample (100 closed trades, 87.00% win rate, 2.11% max drawdown, profit factor 1.955, +2.08% net return), use the companion strategy version on identical parameters. Note: those metrics were generated with a 5m RSI trigger; this indicator defaults to a 3m RSI trigger, which will produce a different signal cadence.
🔷 How to Use It:
🔸 Add the indicator to a SOL / USDT chart (3m chart recommended to match the RSI trigger).
🔸 Review the RSI trigger level, the averaging-order count/deviation/size, the Take Profit, Trailing, and Stop Loss percentages. Defaults mirror the source DCA Bot configuration with the RSI moved to 3m.
🔸 Set Base Order Size and AO sizes to match your bot's configuration (the avg-entry display becomes meaningful when virtual sizing matches real sizing).
🔸 In the DCA Bot Webhook group, paste the Bot ID, Email Token, and Pair (QUOTE_BASE format, e.g., USDT_SOL).
🔸 Create an alert on the indicator with "Any alert() function call". Paste the DCA Bot's webhook URL into the alert's Webhook field. The indicator will emit JSON payloads for entry, each averaging order, and the TP/SL exit — formatted for direct DCA Bot consumption.
🔷 INDICATOR SETTINGS
Base Order Size (USDT): Virtual order size for the avg-entry / open-PnL computation.
Averaging Orders per Trade: Number of safety orders (default 3).
First AO Size (USDT): Virtual size of each averaging order (uniform by default).
Deviation to First AO (%) / Deviation Step Multiplier: Spacing of the AO ladder above base entry. Defaults to uniform +1% steps.
Order Size Multiplier: Per-rung size scaling (1.0 = uniform).
RSI Timeframe / Length / Crossing Down Level: The RSI(9) crossing-down trigger (default 3m).
Take Profit (%) / Trailing (%): TP distance below average entry and the trailing retrace that closes the position.
Stop Loss (%): Hard stop above average entry.
Active Window: Optional date filter — when ON, the indicator only fires signals between From and To dates.
DCA Bot Webhook: Bot ID, Email Token, and Pair fields injected into every alert payload.
Visualization: Toggle DCA Ladder, Avg / TP / SL plot lines, fill labels, signal triangles, status table.
Brand Watermark: Configurable text, position, size, and transparency.
👨🏻💻💭 We hope this tool helps enhance your trading. Your feedback is invaluable, so feel free to share any suggestions for improvements or new features you'd like to see implemented.
__
The information and publications within the 3Commas TradingView account are not meant to be and do not constitute financial, investment, trading, or other types of advice or recommendations supplied or endorsed by 3Commas and any of the parties acting on behalf of 3Commas, including its employees, contractors, ambassadors, etc. Indicador
Indicador

Indicador