Indicador
Indicador

Indicador

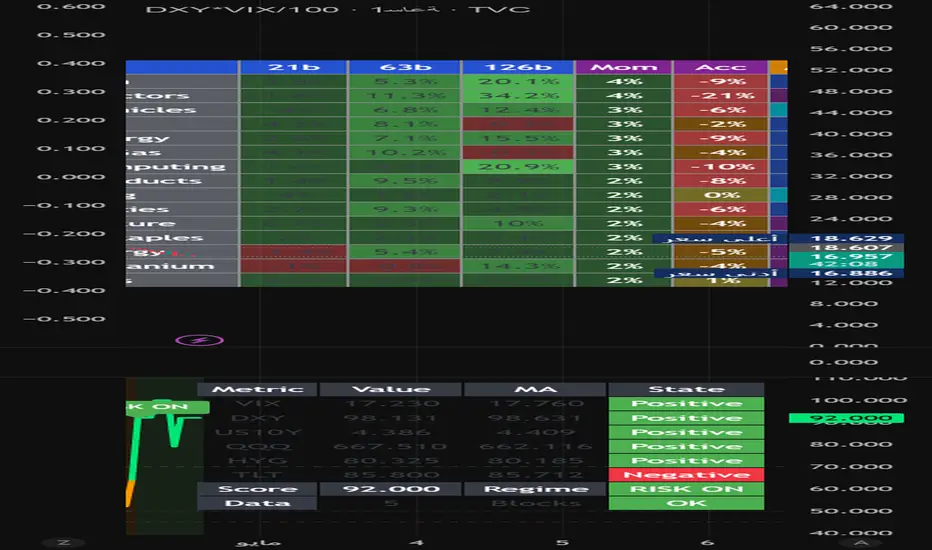
Macro Regime 2EMA Pro Strategy [VIX-DXY]Macro Regime 2EMA Pro Strategy
Macro Regime 2EMA Pro Strategy is a trend-following system that evaluates market direction not only through price action, but also through broader macro risk conditions.
The strategy combines VIX (volatility), DXY (US Dollar strength), and optionally USDT Dominance with a dual EMA trend filter (EMA50 and EMA200) to identify more favorable trading environments.
Strategy Approach
This system does not focus on finding frequent entry signals.
The objective is not to predict the market, but to participate only when conditions are aligned.
The structure is built around four layers:
Macro Regime → Permission to trade
Trend Filter → Direction
Entry → Timing
Exit & Risk → Actual performance
This separation helps keep the system stable and avoids unnecessary complexity.
Macro Regime Engine
The system evaluates market conditions using:
VIX → market fear and volatility
DXY → dollar strength and capital flow
USDT Dominance → crypto liquidity direction
Each component produces a state:
Risk-On → bullish environment
Risk-Off → bearish environment
Warning → conflicting signals
Neutral → no clear direction
These states are combined using a simple voting mechanism.
Trades are only allowed when macro conditions are aligned.
Multi-Timeframe Structure
The strategy uses two timeframes:
Main timeframe → defines the overall direction
Confirm timeframe → filters the signals
This structure helps reduce noise and avoid weak setups.
All higher timeframe data is handled using confirmed values to prevent repainting.
Price-Based Entry Logic
Entries are intentionally simple:
Price above both EMA50 and EMA200 → Long
Price below both EMA50 and EMA200 → Short
This keeps the system aligned with the trend and avoids overfitting.
Exit and Risk Management
This is the core of the strategy.
The system includes:
Initial stop loss to define risk
Trailing stop to protect profits during trends
Break-even to reduce risk after favorable movement
Optional partial take profit
Optional time-based exit
The goal is to keep losses controlled and allow winners to develop.
Data Reliability
Higher timeframe data is confirmed and non-repainting.
Signals are generated on bar close.
No visible-range or chart-dependent logic is used.
This ensures consistency between backtest and live behavior.
Alerts and Automation
The strategy supports JSON-based alerts.
It can be used with webhook and automated trading systems.
By default, signals are triggered once per bar close.
Use Cases
Best suited for:
BTC and ETH
Trending altcoins
Higher timeframes such as 4H and above
Stocks
The strategy can also be used on equities, with some adjustments.
USDT Dominance is generally not relevant in stock markets.
VIX and DXY tend to have stronger influence.
Stocks may have lower volatility and session gaps.
For this reason, wider stops, higher timeframes, and a more patient approach are typically required.
Limitations
The strategy may struggle in:
Sideways markets
Low volatility conditions
Illiquid assets
Backtest Notes
Results depend on the selected asset, timeframe, and market conditions.
Standard candles are recommended.
Trading fees and slippage should be included.
Settings
The inputs are not fixed rules, but tools that shape how the system behaves.
Tighter configurations result in fewer but more selective trades.
Looser configurations increase activity but may also increase variability.
Observing how the system behaves across different conditions is more useful than trying to optimize for a single result.
General Settings Philosophy
There is no single “best” configuration for this strategy.
The goal is not to find the perfect setting for the past, but to build a structure that behaves consistently across different market environments.
A common mistake is constantly adjusting parameters to fit historical data.
While this may look good on past charts, it often does not hold up in live conditions.
A more reliable approach is to observe how the system behaves across different scenarios.
Strategy Philosophy
We do not try to predict the market.
We focus on participating only when conditions are aligned.
The system emphasizes macro alignment, structural trend confirmation, and controlled risk. Estratégia

Zero to Hero + Buy / Sell Labels + DashboardZero to Hero is a comprehensive market-readiness meter that distills five powerful technical factors into a single, easy‑to‑read Hero Score (0‑100). It helps you avoid low‑probability chop and only trade when the odds are stacked in your favour. The indicator draws clear entry signals, dynamic stop‑loss and take‑profit levels, and a vibrant dashboard so you always know whether the market is in “hero” mode or still a “zero”.
How It Works
The Hero Score is built from five independent components, each contributing up to 20 points:
Trend Alignment – Price above fast & slow EMAs, and EMAs stacked correctly.
Momentum – RSI in the healthy zone (50‑70 for longs).
Volume – Volume above its moving average, confirming participation.
Volatility – ATR% inside a “Goldilocks” range (not too quiet, not too wild).
Price Structure – Higher highs/higher lows (bullish) or lower highs/lower lows (bearish) based on pivot points.
The Bull Hero Score measures readiness for long trades; the Bear Hero Score does the same for shorts.
When a score crosses your chosen threshold (default 80 for longs, 20 for shorts), the indicator issues a non‑repainting signal.
What You’ll See on the Chart
Buy / Sell Labels – “🦸 HERO LONG” or “🦹 HERO SHORT” appear when the setup is confirmed.
Stop‑Loss & Take‑Profit Lines – Automatically placed at 1.5× ATR and 2.5× ATR from entry (customisable).
Risk‑Reward Shading – A translucent grey box between stop and target makes your trade plan instantly visible.
Hero Meter – A lower‑pane histogram shows the Hero Scores building up, with threshold lines for quick visual reference.
Info Dashboard – A colourful, easy‑to‑read table in the top‑right corner showing all five component scores, ATR%, volume ratio, and your current stop/target when a signal is active.
How to Use It
Wait until the dashboard says “🦸 LONG” or “🦹 SHORT”.
Check the dashboard – all five components should be showing green or positive values.
Enter the trade in the direction indicated.
Set your stop exactly where the red dashed line is drawn.
Take profit at the green dashed line.
Do nothing when the dashboard says “⚪ WAIT”. Patience is the edge.
Inputs & Customisation
All thresholds can be adjusted via the settings panel:
Hero Long / Short Threshold – Sensitivity of signals (default 80 / 20).
EMA lengths – Fast & Slow EMAs for trend detection.
RSI period – Used in momentum scoring.
Volume & Volatility filters – Minimum volume ratio, acceptable ATR% range.
Risk Management – ATR multiplier for stop‑loss and take‑profit.
Dashboard toggle – Show/hide the info panel.
Best For
Swing & position traders who want high‑confidence setups.
Intraday traders looking to filter out low‑volume chop.
Any market – stocks, forex, crypto, indices.
All timeframes (works best on 15min – daily).
Important Notes
Signals are non‑repainting (confirmed on bar close).
No indicator predicts the future – this tool highlights high‑probability conditions only.
Always use proper risk management.
Past performance does not guarantee future results.
Risk Disclaimer
This indicator is provided for educational purposes only. It does not constitute financial advice. Trading involves substantial risk of loss. Always do your own analysis and never trade with money you cannot afford to lose.
Take your trading from zero to hero – only when the market gives you the green light.
Indicador

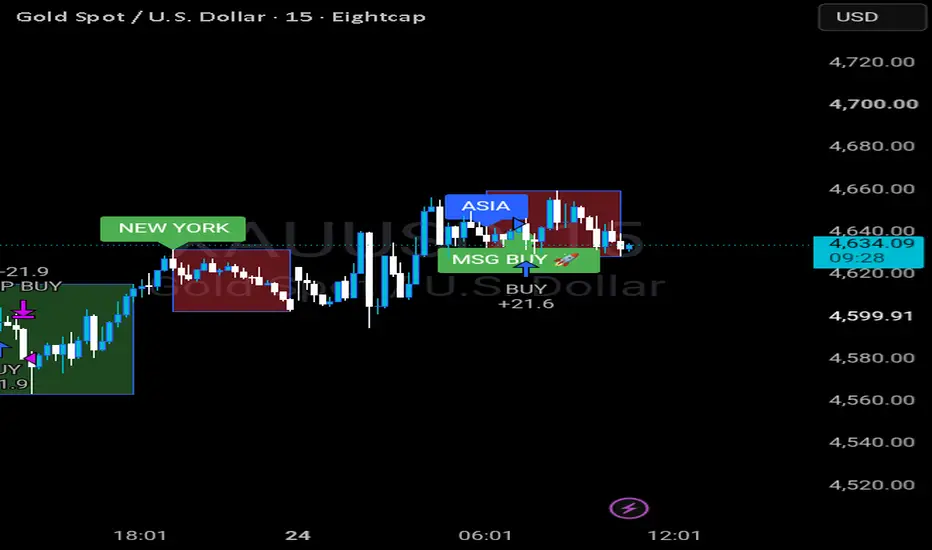
Time zoneI wrote a small indicator for myself that draws time zones and it is convenient to edit them through the settings.
I've tried a lot that I didn't find inconvenient or overloaded.
Opportunities:
1 - Allocation of a time range, the one that is convenient for you in terms of currency volatility.
2 - Adjusting the color of the periods.
3 - Display in the upper right corner of the time until the close of trading according to your timings.
Maybe it will be convenient for someone, use it, share it. Over time, I will add functionality here that will improve the convenience.
--------
Написал небольшой индикатор для себя, который отрисовывает временные зоны и их удобно править через настройки.
Перепробовал множество, которые мне не показались не удобными и перегруженными.
Возможности:
1 - Выделение временного диапазона, того, который вам удобен по волатильности валют.
2 - Корректировка цвета периодов.
3 - Отображение в правом верхнем углу времени до закрытия торгов по вашим таймингам.
Может кому то будет удобно, пользуйтесь, делитесь. Со временем добавлю сюда функционала, который будет улучшать удобство. Indicador

Xander Scalping Strategy [Price Action + Confirmation]🚀 Xander Scalping Strategy
by @wijayanto_ok
A multi-confirmation scalping strategy combining trend filtering, dynamic support/resistance, Stochastic RSI momentum, and volume confirmation — with visual Risk/Reward estimation for disciplined trading.
================================================================================
📌 OVERVIEW
================================================================================
Xander Scalping Strategy is a Price Action-based trading tool designed for traders who prioritize high-probability, multi-layer confirmation before entry. It helps identify:
✅ Trend Direction using EMA 13/21 crossover
✅ Dynamic Support & Resistance from confirmed swing highs/lows
✅ Precision Entry Signals via Stochastic RSI + Volume spike confirmation
✅ Visual Risk/Reward Estimator for smarter position management
🎯 Best For: Timeframes 5m – 1H | Liquid assets (Forex majors, BTC/ETH, Indices)
================================================================================
✨ KEY FEATURES
================================================================================
🔹 1. Trend Filter (EMA 13/21)
---------------------------------
• Fast EMA (13) & Slow EMA (21) with dynamic coloring:
🟢 Green = Uptrend | 🔴 Red = Downtrend | ⚪ Gray = Sideways
• Real-time trend label in top-right corner for quick reference
🔹 2. Dynamic Support & Resistance
---------------------------------
• Auto-detects Swing High/Low using ta.pivothigh() / ta.pivotlow()
• Horizontal S/R lines extended to the right (real-time visualization)
• Updates automatically when new swings are confirmed
⚠️ Note: 1-candle lag for pivot confirmation = non-repainting logic
🔹 3. Multi-Layer Entry Confirmation
---------------------------------
Component | Settings | Purpose
-------------------|---------------------------------------|---------------------------
Stochastic RSI | RSI Len: 14, %K: 3, %D: 3, OB: 80, OS: 20 | Momentum timing & reversal signals
Volume Filter | Avg Volume (20-period) | Filters low-liquidity false signals
Price Action | Pullback to EMA zone OR bounce/reject at S/R | Confirms structural alignment
✅ BUY Signal Conditions:
1. Uptrend (EMA 13 > EMA 21)
2. Price pulls back to EMA zone OR bounces from Support
3. StochRSI crosses UP from Oversold (<20)
4. Volume > 20-period average
→ Green "BUY" arrow appears below candle
✅ SELL Signal Conditions:
1. Downtrend (EMA 13 < EMA 21)
2. Price pulls back to EMA zone OR rejects from Resistance
3. StochRSI crosses DOWN from Overbought (>80)
4. Volume > 20-period average
→ Red "SELL" arrow appears above candle
🔹 4. Visual Risk/Reward Table (Top-Right)
---------------------------------
Metric | Description
----------|--------------------------------------------------
Status | Current trend or active signal (LONG/SHORT/UPTREND/DOWNTREND)
Est. RR | Estimated Risk:Reward ratio based on latest swing levels
💡 Tip: Use RR ≥ 1:1.5 as an additional filter for higher-quality entries.
🔹 5. Alert System
---------------------------------
• 🔔 "Xander Buy Signal" — Triggered when all BUY conditions met
• 🔔 "Xander Sell Signal" — Triggered when all SELL conditions met
• Compatible with TradingView alerts (popup, email, webhook, SMS)
================================================================================
⚙️ HOW TO USE
================================================================================
🔧 Setup:
1. Apply script to chart with timeframe 5m, 15m, or 1H
2. Recommended assets:
• Forex: EURUSD, GBPUSD, USDJPY
• Crypto: BTCUSDT, ETHUSDT
• Indices: US30, NAS100, SPX500
🎯 LONG Entry Setup:
1. Confirm "UPTREND 🟢" label is visible
2. Wait for pullback to EMA 13-21 zone OR bounce from green Support line
3. Confirm: Green BUY arrow appears + candle closes bullish
4. StochRSI: Crosses up from <20 zone
5. Volume: Bar higher than 20-period average
📍 Stop Loss: Below nearest lastSwingLow
🎯 Take Profit: Nearest lastSwingHigh OR RR target ≥1:1.5
🎯 SHORT Entry Setup:
1. Confirm "DOWNTREND 🔴" label is visible
2. Wait for pullback to EMA 13-21 zone OR rejection from red Resistance line
3. Confirm: Red SELL arrow appears + candle closes bearish
4. StochRSI: Crosses down from >80 zone
5. Volume: Bar higher than 20-period average
📍 Stop Loss: Above nearest lastSwingHigh
🎯 Take Profit: Nearest lastSwingLow OR RR target ≥1:1.5
⚠️ Recommended Filters:
❌ Avoid trading when label shows "SIDEWAYS ⚪"
❌ Skip signals with Est. RR < 1:1
❌ Avoid entries 5 min before/after high-impact news events
✅ Always confirm with candlestick patterns (pinbar, engulfing, etc.)
================================================================================
🔍 TECHNICAL NOTES (Advanced Users)
================================================================================
📐 Pivot Detection (Non-Repainting):
ph = ta.pivothigh(high, lookbackPeriod, lookbackPeriod)
pl = ta.pivotlow(low, lookbackPeriod, lookbackPeriod)
• Requires rightBars = lookbackPeriod for confirmation → NO REPAINTING
• New swing confirmed only after N candles close to the right
• Recommended: lookbackPeriod = 50 for significant swings; 20-30 for responsive signals
📊 Stochastic RSI Calculation:
rsiSource = ta.rsi(close, 14)
stoch = (rsiSource - lowestRSI) / (highestRSI - lowestRSI) * 100
%K = ta.sma(stoch, 3), %D = ta.sma(%K, 3)
• Measures relative momentum within 0–100 range
• Crosses at extremes (20/80) offer high-probability reversal signals
📈 Risk/Reward Estimation:
// For BUY:
risk = close - lastSwingLow
reward = lastSwingHigh - close
RR = reward / risk
• Uses latest confirmed swing levels as reference for SL/TP
⚠️ Estimates only — always adjust to real-time market structure
================================================================================
⚠️ DISCLAIMER & RISK WARNING
================================================================================
🚨 IMPORTANT: This script is an analytical tool only. It does NOT guarantee profits or replace sound trading judgment.
1. Backtest First: Test in demo mode for 2–4 weeks before live trading.
2. No Holy Grail: No strategy wins 100%. Manage expectations and use strict money management.
3. Market Conditions: Performs best in trending markets. May underperform in extreme sideways or news-driven volatility.
4. Non-Repainting: Signals appear only after candle close and pivot confirmation. Minor 1-candle lag on swing detection is intentional for reliability.
5. Always Use Stop Loss: Never trade without predefined risk protection.
🔹 Trading forex, crypto, and derivatives carries substantial risk of loss. Trade only with capital you can afford to lose.
================================================================================
🔄 VERSION HISTORY
================================================================================
Version | Date | Changes
--------|------------|--------------------------------------------------
1.0 | May 2026 | Initial release: EMA + S/R + StochRSI + Volume + RR Table
================================================================================
💬 FEEDBACK & SUPPORT
================================================================================
• 🛠 Found a bug? Report with screenshot + timeframe + asset for faster resolution.
• 💡 Have an improvement idea? Comment below or DM @wijayanto_ok.
• 🌟 Enjoying the script? A like/follow helps support future updates!
"Plan your trade, trade your plan. Consistency > Perfection."
— Xander Scalping Philosophy
================================================================================
🔖 TAGS (For Search Optimization)
================================================================================
scalping, price-action, ema, support-resistance, stochastic-rsi, volume, risk-reward, swing-trading, confirmation, non-repainting, tradingview, pine-script
================================================================================
✅ PRE-PUBLISH CHECKLIST
================================================================================
Tested on 3+ assets & timeframes
All inputs have sensible defaults
Code is well-commented & structured
Risk disclaimer included
Alert conditions defined
No unwanted repainting logic
Documentation complete & professional
================================================================================
🙏 Thank you for using Xander Scalping Strategy!
Happy trading, and may your RR always be in your favor. 🎯📈
================================================================================ Indicador

Indicador
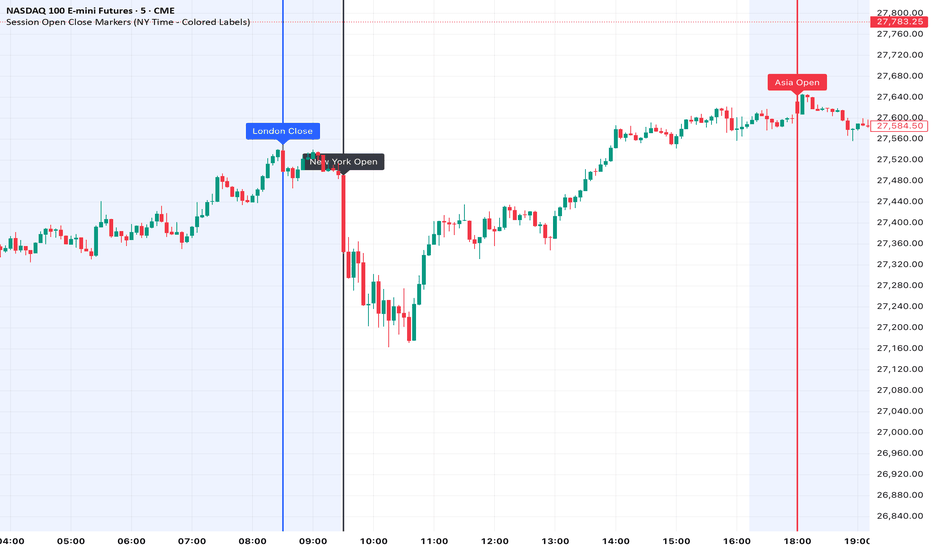
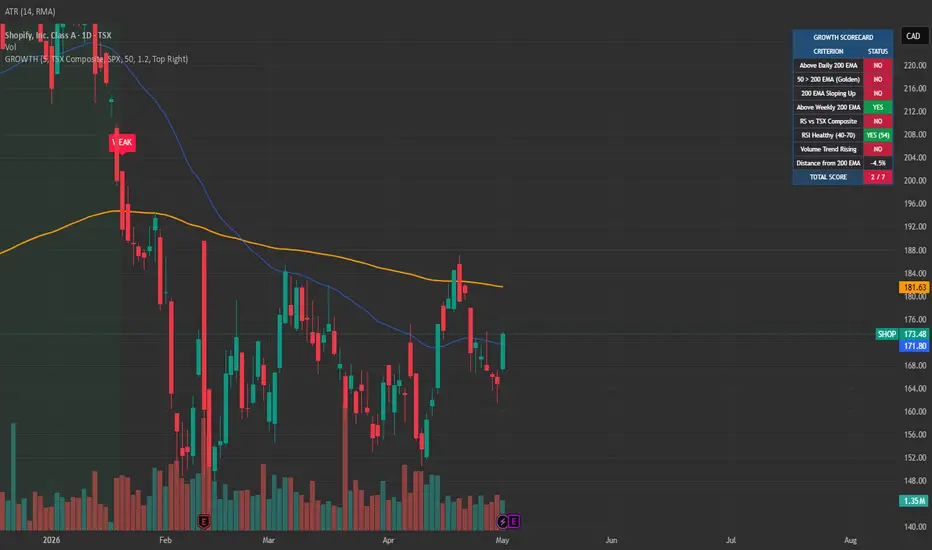
Long-Term Growth Stock ScorerLong-Term Growth Stock Scorer plots a 7-criterion scoring system on any stock, identifying high-quality growth setups and signaling 200 EMA retest entries. Designed for long-term investors building positions in trending stocks with confirmed strength across trend, momentum, and participation.
THE 7-CRITERION SCORECARD
Each stock is scored 0-7 based on:
Price above daily 200 EMA — primary trend
50 EMA above 200 EMA — golden cross alignment
200 EMA sloping up — confirmed long-term uptrend
Price above weekly 200 EMA — multi-timeframe confirmation
Relative strength vs benchmark (S&P 500, NASDAQ 100, TSX Composite, FTSE, ASX, Russell 2000, or any custom symbol)
RSI in healthy range (40-70) — momentum quality, not exhausted
Volume trend rising — institutional participation expanding
SIGNALS
BUY label fires when a qualified stock (score >= threshold) retests its 200 EMA on volume
WEAK label fires when a held position drops below the qualification threshold
Background highlight when current score is in the qualified zone
Three built-in alerts: buy signal, score weakening, and score strengthening (entering the qualified zone)
FEATURES
Configurable benchmark index — works for any major market or custom symbol
Live dashboard showing each criterion's pass/fail status, current RSI value, and distance from 200 EMA
Six dashboard position options
Adjustable minimum score threshold (default 5/7)
Volume confirmation toggle for retest signals
HOW TO USE
Run on any stock chart on the daily timeframe. Set your benchmark to match the stock's market (S&P 500 for US stocks, TSX Composite for Canadian stocks, etc.). Use the dashboard to scan watchlist stocks for current qualification. When a qualified stock retests its 200 EMA on rising volume, the BUY signal fires.
Best used as a confirmation layer alongside fundamental analysis — strong technical setups need strong businesses underneath.
Open-source. Feedback and forks welcome. Indicador

Indicador
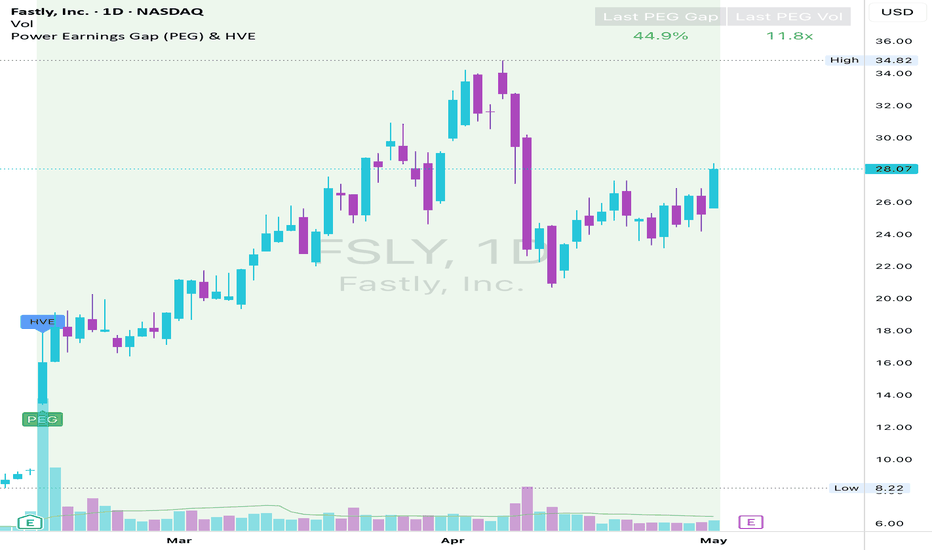
Gold Levels Dashboard
Dashboard for full setup entry SL TP support
Key levels: R3, R2, R1, Pivot, S1, S2, S3, MAJR (Major Support), SAR (Parabolic SAR)
Trade setup: Entry, SL, TP1, TP2, TP3
Multi-timeframe bias: Daily, 4H, 1H, 15M
Indicator scorecard: RSI, MACD, ADX, etc.
Pivot points (calculated from previous day's OHLC)
Parabolic SAR
RSI, MACD, ADX for bias determination
EMA for trend bias per timeframe
Table display with colored cells like the image Indicador

Indicador

Indicador

Indicador
Indicador

Estratégia

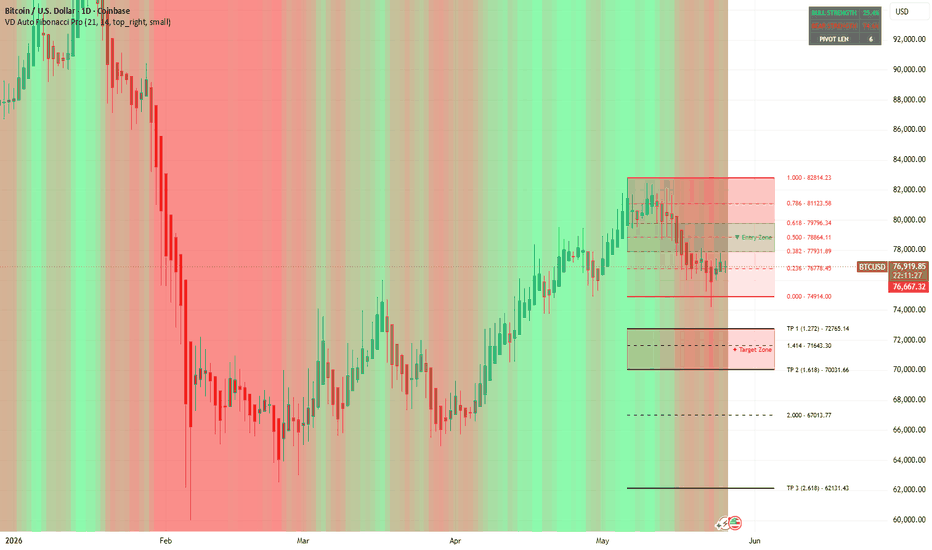
A+ IFVG Entry Model - SNIPE + HTF PRO TARGETS V2The PJ Style A+ IFVG Entry Model – SNIPE + HTF is a rule-based trading indicator designed to identify high-probability intraday and swing opportunities using liquidity concepts, displacement, and imbalance analysis. It operationalizes a structured entry model centered on market behavior commonly associated with institutional order flow.
Core Methodology
The indicator scans for a specific sequence of events:
Liquidity Sweep
Price takes out prior highs or lows, signaling potential stop runs and liquidity collection.
Displacement Move
A strong directional expansion confirms intent, indicating that market participants are committing to a move.
Fair Value Gap (FVG) / Inversion FVG (IFVG)
The presence of an imbalance highlights inefficiencies in price delivery, which often act as continuation zones.
Confirmation
Entries are only validated once price action confirms direction through candle structure, reducing premature signals.
Entry Types
The script distinguishes between two strategic entry profiles:
SNIPE Entries
Designed for short-term execution
Triggered immediately following the core model conditions
Targets nearby liquidity levels for quicker profit-taking
Ideal for lower timeframes and active trade management
HTF Bias Entries (Runner Trades)
Filtered by higher timeframe directional bias using a moving average framework
Intended to capture extended moves (“runners”)
Targets broader liquidity zones using an expanded lookback range
Suitable for holding positions longer with trend alignment
Risk Management
"UPDATED" The model incorporates dynamic, liquidity-based risk controls:
Stop Loss Placement
Positioned beyond the most recent sweep or protected structure, with an ATR-based buffer to account for volatility.
Profit Targets
Derived from real liquidity zones (recent highs/lows or extended ranges), rather than arbitrary fixed distances.
Risk-to-Reward Filter
Optional validation ensures trades meet a minimum reward-to-risk threshold before being signaled.
Additional Features
Automated FVG Visualization for identifying imbalance zones directly on the chart
Sweep Markers (SH / SL) to highlight liquidity events
Cooldown Mechanism to prevent signal clustering and overtrading
Customizable Parameters for timeframe adaptability and strategy refinement
Alert Conditions for real-time trade monitoring and automation support
Use Case
This indicator is intended for traders who rely on price action, liquidity theory, and structured execution models. It emphasizes discipline, consistency, and contextual decision-making rather than signal overdependence, making it suitable as both a standalone tool and a confirmation layer within a broader trading framework. Indicador

Indicador

Indicador

Indicador

Indicador

Indicador
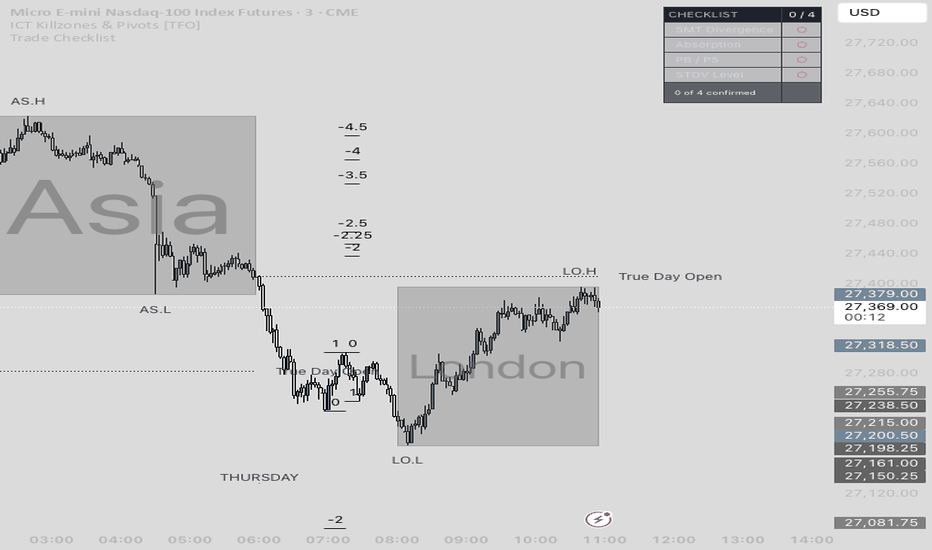
Market Entropy IndexMarket Entropy Index (MEI)
Most risk indicators react to price. They measure what has already happened. The Market Entropy Index takes a different approach: it measures the structural organization of the market itself, identifying fragility before it becomes visible in price. When sector participation narrows, when sectors stop agreeing on direction, and when credit markets become complacent, the MEI detects these precursor conditions. It applies information theoretic entropy to three independent dimensions of market structure, producing a single composite that distinguishes broad, healthy markets from concentrated, fragile ones. This makes it a leading indicator of structural risk, not a coincident crash detector.
What entropy means in financial markets
Entropy, as formalized by Shannon (1948), quantifies uncertainty in a probability distribution. In information theory, a distribution where all outcomes are equally likely has maximum entropy. A distribution concentrated on a single outcome has minimum entropy. Applied to financial markets, this framework has been used in two distinct ways that should not be confused.
The first is temporal return entropy: measuring how the distribution of an index's daily returns changes over time. Risso (2008) showed that Shannon entropy of stock market return distributions drops before financial crashes, as returns become more extreme and less uniformly distributed. Zunino et al. (2009) found that permutation entropy of return series tracks market efficiency and deteriorates during stress. Gu (2017) extended this to multiple time scales. These studies all measure the statistical properties of a single return series over time.
The second is cross-sectional entropy, which is what the MEI uses. Instead of asking "how are returns distributed over time?", it asks "how is market activity distributed across sectors right now?" When all nine S&P 500 GICS sectors contribute equally to market movement, the entropy of their return distribution reaches its theoretical maximum: roughly log2(9) = 3.17 bits. This corresponds to broad, healthy participation. When movement concentrates in two or three sectors while the rest are flat, entropy drops. The market relies on a narrow base.
These two types of entropy can move in opposite directions. During an acute crash, temporal return entropy drops (Risso's finding: returns become extreme and non-normal). But cross-sectional breadth entropy often rises, because all sectors sell off together, producing a more uniform distribution across the cross-section. The MEI does not measure temporal return entropy. It measures cross-sectional breadth entropy and two related structural conditions. This distinction matters for interpretation (see the section on what the MEI does not do).
How the MEI is constructed
The indicator combines three dimensions, each measuring a distinct aspect of market fragility. All three were validated through statistical screening with Bonferroni correction across seven different parameter configurations to guard against data-mining bias.
Sector Breadth Concentration (weight: 0.40)
This is the primary dimension. It computes the Shannon entropy of the distribution of smoothed absolute returns across nine GICS sector ETFs (XLB, XLE, XLF, XLI, XLK, XLP, XLU, XLV, XLY) over a 21-day rolling window. The entropy value is normalized to the theoretical maximum so it ranges from 0 (all activity in one sector) to 1 (perfectly uniform distribution).
The critical finding from backtesting: low sector entropy (concentrated breadth) is the danger condition, not high entropy. When market movement narrows to a few sectors, the rally or sell-off lacks structural support. This is consistent with the well-documented market breadth divergence effect: narrow rallies tend to precede corrections. In our testing, the low-entropy tercile showed significantly worse forward returns than the high-entropy tercile across a 21-day horizon (spread = +1.18%, t = 5.81, p = 7.3e-09, Bonferroni-significant in all seven parameter configurations).
Sector Directional Discord (weight: 0.30)
This dimension measures the fraction of sectors that agree on daily direction (all up or all down), averaged over 21 days. When eight of nine sectors move in the same direction, concordance is high, indicating a coherent market. When sectors split nearly evenly between positive and negative days, concordance drops, signaling confusion, rotation, or conflicting macro forces.
Low concordance (high discord) is the danger condition. Sectors disagreeing on direction means the market lacks conviction and is vulnerable to dislocations. This dimension was Bonferroni-significant in five of seven parameter configurations (21d: spread = +0.97%, t = 5.20, p = 2.2e-07).
Credit Complacency (weight: 0.30)
The third dimension measures the rolling standard deviation of the daily return spread between iShares High Yield Corporate Bond ETF (HYG) and iShares Investment Grade Corporate Bond ETF (LQD), normalized by its 252-day average. This ratio captures how volatile credit spreads are relative to their recent history.
Low credit spread volatility is the danger condition. When credit markets are calm and spreads barely move, it often reflects complacent risk pricing. The empirical parallel is well-supported: Gilchrist and Zakrajsek (2012) showed that credit spread dynamics, specifically the excess bond premium, predict economic downturns and equity returns. In our testing, this dimension produced the strongest individual t-statistic (63d: spread = +1.89%, t = 6.73, p = 2.2e-11, Bonferroni-significant in three of seven configurations).
Signal processing
Each dimension is z-scored over a 252-day lookback and clipped at three standard deviations. The z-scores are sign-inverted so that high values consistently indicate danger across all three dimensions. After weighting, the composite is re-standardized over 252 days to restore the variance lost through averaging weakly correlated signals. The result is scaled to a 0-10 range (5.0 + z * 2.0) and smoothed with a Kaufman Adaptive Moving Average (Kaufman, 2013). The KAMA adjusts its smoothing speed based on the efficiency ratio of the composite: during clear regime transitions, it responds quickly; during choppy sideways periods, it filters noise. A minimum smoothing constant floor prevents the filter from becoming excessively sluggish.
How to read the MEI
0 to 3: Low Risk. All three dimensions read safe. Sectors participate broadly, agree on direction, and credit markets are actively pricing risk. These conditions are historically associated with favorable forward equity returns.
3 to 7: Normal. No structural signal in either direction. The market is in equilibrium. This is the expected reading roughly two-thirds of the time.
7 to 10: Elevated Risk. One or more dimensions show stress. Sector participation is narrowing, directional agreement is breaking down, or credit markets have become complacent. The higher the reading, the more dimensions agree on risk.
The dashboard shows each dimension individually, so you can diagnose what is driving the composite. The historical percentile tells you where the current reading sits relative to the past 252 days. The trend direction (with arrow symbols) shows whether risk is rising or falling.
What the MEI detects and what it does not
The MEI is a leading indicator of structural fragility, not a coincident crash detector. It measures conditions that build up before market stress: narrowing sector participation, loss of directional agreement, and complacent credit pricing. These are precursor conditions. They describe a market that has become structurally fragile, not one that is already falling apart.
During an acute sell off, the MEI typically drops toward the green zone. This is not a malfunction. When all sectors sell off together, breadth entropy actually increases (uniform distribution across sectors), concordance rises (all sectors agree on the down direction), and credit spread volatility spikes (the opposite of complacency). All three dimensions read "safe" precisely because the structural fragility has already resolved through the sell-off itself.
The practical implication: the MEI is most useful in the quiet periods before stress, when markets look calm but the underlying structure is deteriorating. If the MEI reads 8 while the SPX is making new highs, that is a warning worth paying attention to. If the MEI reads 2 during a violent correction, that means the correction is broad-based and structural participation is actually healthy, which is historically a better setup for recovery than a narrow, concentrated decline.
How to use it in practice
The MEI is a regime monitor, not a timing signal. It answers the question "what kind of market are we in?" rather than "should I buy or sell today?" The most productive way to use it:
As a confluence filter: combine the MEI with your existing trend-following or mean-reversion strategy. When the MEI reads above 7, tighten stops, reduce position sizes, or require stronger entry signals. When it reads below 3, conditions favor taking positions.
As an allocation tool: for portfolio managers running multi-asset or tactical allocation, the MEI provides a daily structural risk reading that can scale equity exposure. Reduce equity allocation when the composite is elevated, increase when it is low.
As a diagnostic tool: enable the individual components (Breadth Concentration, Directional Discord, Credit Complacency) to understand what is driving the composite. If only one dimension is elevated while the others are normal, the risk may be localized. If all three converge, the structural case is stronger.
For monitoring credit conditions: the Credit Complacency dimension alone serves as a real-time gauge of credit market risk pricing. Low readings (complacency) have historically preceded episodes of spread widening.
Quant fund applications
For systematic portfolio managers and quantitative research teams, the MEI framework offers several practical applications.
As a regime classifier for conditional strategies: most equity strategies behave differently in ordered versus disordered markets. Momentum strategies, for example, tend to work well when breadth entropy is high (broad participation) and poorly when it is low (concentrated leadership). The MEI provides a daily regime classification that can condition strategy selection or parameter adjustment. In our backtesting, the composite showed a spread of +2.86% (21-day forward returns, t = 5.91) in high-volatility regimes, offering a quantitatively meaningful signal for regime-conditional allocation.
As a risk budget input: the three z-scored danger signals can feed directly into a risk budgeting framework. When breadth_danger or credit_danger exceeds one standard deviation, the risk model can automatically reduce gross exposure or hedge tail risk. The low cross-correlation between dimensions (breadth-credit: rho = -0.07, breadth-discord: rho = 0.20) means each dimension adds genuine incremental information to the risk estimate.
As an alpha decay monitor: sector concentration (low breadth entropy) is one mechanism through which crowded trades develop. When the breadth dimension rises, it may indicate that a previously broad factor exposure has narrowed to a few names or sectors, which is a warning sign for factor crowding and potential alpha decay.
As a multi-asset overlay: the framework extends naturally beyond equities. The same entropy-based approach can be applied to any cross-section of assets (currencies, commodities, fixed income sectors) to detect concentration and complacency.
Limitations
This indicator has clear boundaries that users should understand.
It detects fragility, not crashes. The MEI measures structural precursors (concentration, complacency, discord) that build up before stress events. During acute sell-offs, the indicator typically drops because the conditions it measures dissolve once panic selling is broad-based. Do not expect the MEI to read red during a crash. Expect it to read red before one.
The signal is regime-dependent. In high-volatility and bear markets, the composite works as designed: high readings correspond to worse forward returns, low readings to better. In calm, trending bull markets, the relationship weakens and can reverse. This is because the "danger" conditions (concentrated breadth, credit complacency) can persist for extended periods during healthy trends without leading to corrections. Weight MEI readings more heavily when realized volatility is already elevated.
It is designed for the S&P 500. The sector ETFs and credit instruments are U.S.-specific. Applying the indicator to other indices or asset classes without modifying the data sources would not be methodologically sound.
It requires a daily timeframe. The cross-sector entropy and credit spread calculations require daily closing prices. Intraday data introduces noise that degrades the signal quality.
It needs historical depth. The z-score normalization uses a 252-day lookback. Results during the first year of data should be treated with caution.
It is not a standalone system. No single indicator captures all relevant market dynamics. The MEI measures structural conditions. It does not measure momentum, valuation, sentiment, or liquidity directly. Use it alongside other analytical tools.
References
Gilchrist, S. and Zakrajsek, E. (2012) 'Credit Spreads and Business Cycle Fluctuations', American Economic Review, 102(4), pp. 1692-1720.
Gu, R. (2017) 'Multiscale Shannon entropy and its application in the stock market', Physica A, 484, pp. 215-224.
Kaufman, P.J. (2013) Trading Systems and Methods. 5th edn. Hoboken: Wiley.
Risso, W.A. (2008) 'The informational efficiency and the financial crashes', Research in International Business and Finance, 22(3), pp. 396-408.
Shannon, C.E. (1948) 'A Mathematical Theory of Communication', Bell System Technical Journal, 27(3), pp. 379-423.
Zunino, L., Zanin, M., Tabak, B.M., Perez, D.G. and Rosso, O.A. (2009) 'Forbidden patterns, permutation entropy and stock market inefficiency', Physica A, 388(14), pp. 2854-2864.
Indicador