Aaryan EPS/ SalesAaryan EPS/ Sales
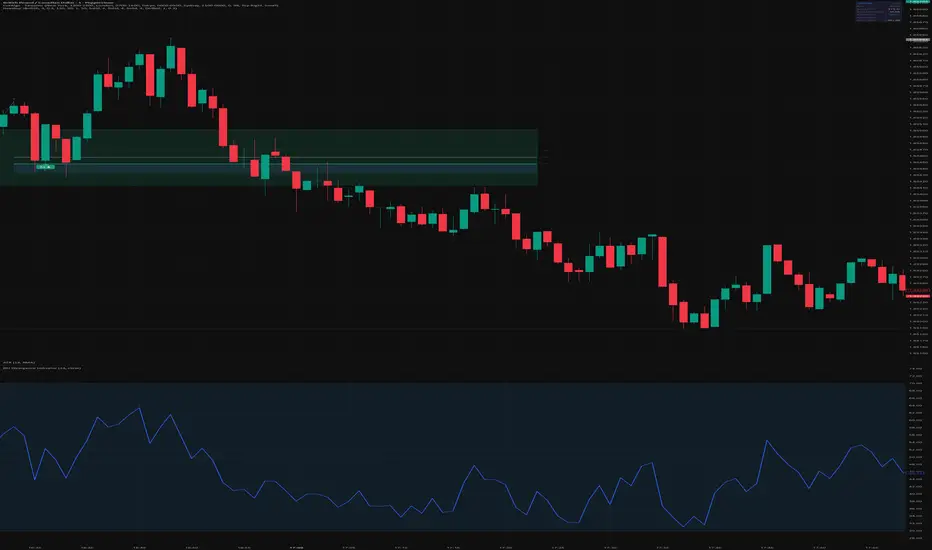
A comprehensive earnings and sales overlay that puts fundamental data directly on your price chart — quarterly results at a glance without leaving the chart window.
What it shows
The indicator displays two data tables and result-day labels on the chart:
Yearly Table shows EPS, year-over-year EPS growth, Sales (in Cr), year-over-year Sales growth, OPM%, PE, ROE, and EV/EBITDA for up to N years. Market cap is displayed in the header.
Quarterly Table shows EPS with QoQ growth
Indicador