NICS Yesterday Box PRONICS Yesterday Box PRO
NICS Yesterday Box PRO automatically plots the previous trading day's High, Low, and Midpoint, providing clean institutional reference levels for intraday trading.
Designed for Smart Money Concepts (SMC), ICT, price action, futures, forex, crypto, indices, and commodities.
Features
• Automatic Yesterday High (YH)
• Automatic Yesterday Low (YL)
• Automatic Yesterday Mid (50%)
• Auto-refresh at the beginning of every trading day
• Optional line extension
• Customizable colors and line width
• Lightweight and optimized Pine Script v6 implementation
Best Used For
• Intraday support & resistance
• Liquidity targets
• Market structure analysis
• Breakout confirmation
• Mean reversion setups
• ICT / SMC trading models
• Session-based trading
Markets
Works on all TradingView-supported markets:
• Forex
• Cryptocurrency
• Stocks
• Futures
• Commodities
• Indices
Recommended Timeframes
Optimized for:
• 1 Minute
• 3 Minute
• 5 Minute
• 15 Minute
• 30 Minute
• 1 Hour
About NICS
NICS (Neural Intelligent Cognitive System) develops professional AI-powered trading tools and institutional market analysis solutions for discretionary and systematic traders.
© AI Byte Consult Ltd.
NICS AI Ecosystem
Indicador

Indicador

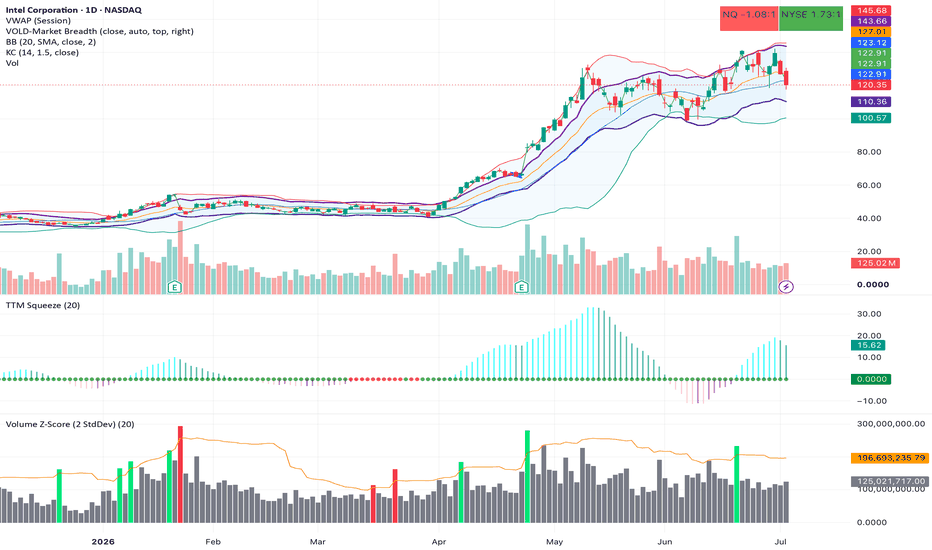
Volume Z-Score (2 StdDev)Here's a ready-to-use description for the publish listing:
---
**Volume Z-Score (2 StdDev) — Sell-off vs. Buying Volume Outliers**
This indicator flags statistically unusual volume days by calculating a z-score: how many standard deviations today's volume is from its rolling 20-period average. Rather than relying on a fixed "unusual volume" threshold that doesn't adapt across different stocks or volatility regimes, this calculates the mean and standard deviation dynamically, so the "outlier" bar scales naturally with each symbol's own typical volume behavior.
**How it works:**
- Volume bars are plotted as columns, color-coded by both magnitude and direction:
- **Gray** — normal volume, within 2 standard deviations of the 20-period average
- **Lime green** — volume is 2+ standard deviations above average AND the bar closed up (buying/accumulation pressure)
- **Red** — volume is 2+ standard deviations above average AND the bar closed down (selling/distribution pressure)
- An orange threshold line plots the actual 2-standard-deviation level (average + 2×stdDev), so you can see the dynamic cutoff directly rather than trusting the color alone
- Two separate alert conditions are included: one for sell-off volume outliers, one for buying volume outliers, so you can set alerts independently for either direction
**How to use it:**
Best paired with a volatility-compression indicator like the TTM Squeeze — a squeeze release confirmed by a same-day green (or red) volume outlier here is a stronger signal than a squeeze release with unremarkable volume. Works on any timeframe and any symbol; the 20-period lookback can be adjusted in settings to suit shorter or longer-term analysis.
**Settings:**
- Lookback Length (default 20) — the period used to calculate the rolling average and standard deviation of volume
**Disclaimer:** This is a volatility/volume analysis tool, not a standalone trading system. It does not predict direction with certainty and should be combined with price action, trend context, and proper risk management. Past patterns do not guarantee future results.
Indicador

Indicador
DCA + DRIP Simulator [WynTrader]DCA + DRIP Simulator
Hello my friend
This tool simulates real effect of an investment plan when a disciplined DCA+DRIP strategy compounds growth, compared to simply investing and pocketing the dividends. It applies to all kind of security with or without dividend paid, so you can compare what tickers you want..
This isn't a simplified estimate. It reads real price, dividend, and split data directly from TradingView — bar by bar, month by month — and reconstructs what a real investor would have experienced. Apply it to any security — dividend-paying or not, stock, ETF, closed-end fund — and see the picture side by side: with DRIP and no DRIP.
█ CONCEPTS
This indicator illustrates clearly that DCA+DRIP can build more wealth over time than a standard monthly investment approach where dividends are simply cashed out with no plan in mind.
— Dollar Cost Averaging (DCA) means investing a consistent amount every single month, no matter what the market does. When prices drop, your money buys more shares automatically. Over time, this discipline lowers your average cost and keeps emotion out of the equation.
— Dividend Re-Investment Plan (DRIP) means every dividend payment goes straight back into buying more shares, instead of sitting idle. Those extra shares generate their own dividends, which buy more shares — a compounding effect that grows the longer you stay invested.
Together, DCA + DRIP compound together over time.
█ HOW IT WORKS
Set your chart to MONTHLY intervals, else the table is set to zero.
Once configured, the indicator reads price, dividend, and split data directly from TradingView and simulates what a real investor would have experienced: buying every month (DCA), collecting dividends, reinvesting them automatically (DRIP) and adjust data with Splits.
█ FEATURES
Configurable DCA Parameters
Set your initial deposit, monthly contribution, and an optional annual DCA increase (e.g. +5%/yr to reflect salary growth and inflation over time). A withholding tax rate can also be applied for US-listed securities (e.g. 15% for ZQQ).
Flexible Date Range
The simulation runs from your chosen: a) Number of years to date; b) Start date to date; c) Visible chart from Start/End dates of your chart screen.
Side-by-Side Comparison
Every result is shown in two columns simultaneously — With DRIP and No DRIP. Capital, monthly dividend income, total dividends received, net gain, and share count — all at a glance.
Fully Customizable Table Display
Position, text size, and all colors are adjustable directly from the settings panel, so the table fits cleanly on any chart layout.
█ CONCLUSION
Load this indicator on any security — stock, ETF, closed-end fund, with or without dividends. DCA+DRIP Simulator applies to all of them, though DRIP's effect is most visible on dividend-paying securities, where reinvested dividends compound over time.
The difference between With DRIP and No DRIP can be significant over time.
█ WynTrader
I am not a Pine Script programmer — I am an investor who builds tools to support my own analysis, and maybe helps others. A few anomalies may have slipped through and there is likely room for improvement.
Hope you find this little tool useful. Enjoy!
WynTrader Indicador

Indicador

Silver Bullet & First/Last FVGIt is designed around the popular ICT (Inner Circle Trader) "Silver Bullet" concepts. Its main purpose is to highlight specific time-based trading windows on your chart and automatically detect and isolate the most significant Fair Value Gaps (FVGs) that form within those windows.
Here is a breakdown of its functionality:
1. Specific Time Sessions
The script monitors three specific 1-hour time windows (defaulting to New York time, but adjustable):
London Silver Bullet: 03:00 - 04:00
New York AM Silver Bullet: 10:00 - 11:00
New York PM Silver Bullet: 14:00 - 15:00
Each of these sessions can be toggled on/off individually, and their border colors customized.
2. Session Range Highlighting
When one of these 1-hour sessions begins, the script starts tracking the absolute Highest and Lowest price reached during that hour.
Once the session ends, it draws a large, semi-transparent box encapsulating that entire 1-hour price action range.
The box is labeled in the bottom right corner (e.g., "Lon SB" or "NY AM SB") so you can easily visually identify the Silver Bullet hour in hindsight.
3. First and Last FVG Detection
This is the most unique feature of the script. While standard indicators highlight every FVG, this script filters them based on the Silver Bullet sessions:
It continuously looks for standard 3-candle Fair Value Gaps (both bullish and bearish).
However, it only plots FVGs if they occur inside one of the active Silver Bullet sessions.
Furthermore, to reduce clutter, it only stores and plots the First FVG and the Last FVG that formed during that specific 1-hour window.
It automatically extends the boxes of these specific FVGs to match the right edge (end time) of the Silver Bullet session box.
4. Memory and Optimization
To prevent TradingView from throwing "too many drawings" errors or causing lag on your chart:
It uses a custom data structure (SBSessionData) to manage the state of each session cleanly.
At the start of every new day, it runs a cleanup function (clearDrawings()) that deletes older session boxes and FVGs if they exceed the user-defined sb_lookback limit (default 100 historical boxes). Indicador

Indicador

Indicador

Pivot Trendlines with Breaks and Zones [HG] - profitgangThis script builds on HoanGhetti's Pivot Trendlines with Breaks concept and their
SimpleTrendlines library (HoanGhetti/SimpleTrendlines/4).
Credit: Original trendline/pivot-break logic and library © HoanGhetti.
What this version adds:
- Dynamic support/resistance zones (shaded boxes) around each trendline
- Live-updating price labels on trendlines
- Extended horizontal S/R lines with price tags
- Configurable zone width and extension length
HOW IT WORKS
The script detects swing pivots using a configurable lookback length, then draws a trendline connecting each new pivot low (support) to the previous one, and each new pivot high (resistance) to the previous one. When price closes through one of these trendlines, it's flagged as a breakout and the line locks in place at the break point. On top of that base logic, this version tracks the live trendline price and continuously redraws a shaded zone around it (width set as a % of price) so you get a visual buffer instead of a single hairline level. Price labels update on every bar to show the exact numeric support/resistance value, and optional extended horizontal lines project the most recent pivot level forward so you can see it well ahead of current price.
HOW TO USE IT
Use the support/resistance zones as areas to watch for reaction, rejection, or a breakout rather than exact levels — the zone width gives you room for wicks and noise instead of expecting price to respect a single price point. On lower timeframes (1-5 min), tighten the zone width and pivot length for faster, more reactive levels; on higher timeframes, widen both for cleaner, less noisy structure. A break of the trendline with the "Br" label suggests the prior support/resistance has failed and price may continue in that direction — combine it with volume or your own confirmation signal before entering, since trendline breaks alone can be prone to false signals in choppy conditions. Indicador

Volume Force FieldVolume Force Field — TradingView publication kit
Volume Force Field turns a volume profile into a force map. A normal profile shows you where value is. This overlay shows you the net pull on price at every level — the slope of the volume landscape toward the nearest magnet — and then it measures, on your own history, whether that pull actually leads price. One plain-language panel tells a non-technical trader what it means at a glance.
What it plots
The force field — coloured bands across price. Green means price at that level is being drawn up toward a high-volume magnet; red means drawn down. Band opacity scales with how much volume sits there.
POC and magnets — the yellow line is the Point of Control (the single strongest magnet); green lines are secondary magnets; dashed red lines are low-volume ridges that price tends to cross quickly.
Value Area — the shaded band holding your chosen % of volume around the POC: the range where trade has been accepted.
Value centre ± band — a moving equilibrium (rolling VWAP / adaptive MA / EMA) with a σ band: the drift level price is pulled back toward.
Guidance panel — plain English: the current bias (pulling up / down / balanced), location vs value (inside / stretched above / stretched below), the nearest magnet and distance, and one line on what to watch.
Past signal marks — small triangles wherever the net pull historically turned strongly up or down, so you can eyeball how the field has behaved.
Why these components are one tool (not several indicators stacked)
Each part answers a question the others cannot, and removing any one breaks the read:
Volume kernel density builds a smooth value landscape whose peaks are magnets. Optional lower-timeframe slicing distributes each bar's volume across its true intrabar path; an optional half-life lets recent volume outweigh old, so the field is a living map, not a flat lookback.
The density gradient turns that landscape into a force — the direction and steepness of attraction at each level, which a plain density cloud never exposes.
The Value Area frames where price is accepted versus stretched, so the force is read in context.
The moving value centre adds the mean-reversion pull toward equilibrium.
The calibration harness back-measures the whole thesis: when the pull is strong, did price actually travel toward the magnet more often than the base rate? It reports Hit %, Base % and Edge.
Density is a picture; the gradient makes it a force; the Value Area frames it; the centre adds drift; the harness keeps it honest. Together they are one decision object.
How to use it
Read the guidance panel first — it states the bias, where price sits versus value, the nearest magnet, and what to watch. On the chart, treat green bands as upward pull toward the magnet above and red as downward pull; the POC and magnet lines are targets; dashed lines are fast low-volume gaps; the Value Area is the accepted range; the centre ± band is the drift equilibrium. Turn on the Calibration table and read Edge: a strong pull with a positive, matured Edge is the context this tool is built to surface. An Edge near zero means the attraction is not exploitable on that symbol/timeframe — that is useful information, not a trade trigger. This is a context map, not a signal generator; combine it with your own risk and execution rules.
Universal across markets
Price source and volume feed are inputs, so it runs on any symbol. Instruments without real volume fall back automatically to a price-density field. Default settings target an index-futures 1-minute chart; change the lookback, centre and slice resolution to suit other assets and timeframes.
Originality
The building blocks are standard and credited below; the original work is the coupling and the rendering — a volume kernel density whose gradient is drawn as a directional force field, fused with a Value Area and a moving value centre, with magnet/ridge extraction and a forward base-rate harness that reports each strong-pull setup's realised Edge instead of asserting that magnets work. No third-party Pine code is reused.
Concept credit
Kernel density estimation — Emanuel Parzen (1962) and Murray Rosenblatt (1956); bandwidth rule — B. W. Silverman (1986). Point of Control / Value Area / Market Profile — J. Peter Steidlmayer. Moving-equilibrium ("price in a moving potential") market models — Hideki Takayasu, Takayuki Mizuno and Tsutomu Watanabe. Not affiliated with, nor endorsed by, any third party.
Honesty / limitations
No tick or order-book tape is available to scripts, so the density is built from OHLCV and optional lower-timeframe slices — a proxy, not the true traded distribution. Lower-timeframe slices exist only for recent bars; older bars use bar price automatically. "Force" is a hypothesis the Edge stat exists to falsify. The harness uses a light proxy of the field (the full grid cannot be recomputed on every bar), so it tests the idea rather than the exact drawn object. Like any volume profile, the last (forming) bar's field refreshes in real time; on closed bars it is fixed. Edge figures are in-sample, close-to-close, without costs — a study aid, not a verified backtest. Nothing here predicts price.
Disclaimer
For research and educational purposes only. This script is not financial advice, not a recommendation, and not a guarantee of future results. Indicators describe past behaviour; they do not predict the future. Trading carries risk of loss. Test on out-of-sample data and make your own decisions. The author accepts no liability for any use of this script. Indicador

Auction & Liquidity Command Center Volume Profile, MeasuredAuction & Liquidity Command Center — Volume Profile, Measured
The levels traders already use — prior POC, value area, naked POCs, prior day high/low, session AVWAP, HVN/LVN — each scored by its measured reaction on this chart: how often price rejects vs breaks, and what the fade has been worth in R. Levels with evidence, not levels with vibes. Never a buy or sell.
What it does
Every structure tool draws levels. None of them measures what happens when price gets there. This tool builds the session-anchored auction map with profile-grade accuracy, detects qualified touches of every level, resolves each touch through a triple-barrier outcome, and pools the results by level TYPE into a live scoreboard: pPOC +0.01R · rej 50% · n156. You see not just where the levels are, but which kinds of levels have actually meant something on this chart — and which are coin flips.
The components, and why they are combined
This is a deliberate synthesis of four parts, each covering the previous one's weakness:
A profile-grade level engine (Market Profile — J. P. Steidlmayer). Nine level types from the session volume-at-price profile and session extremes: prior POC, prior VAH/VAL (classical two-row 70% expansion), naked POCs (prior POCs never revisited), prior day high/low, the session's anchored VWAP, and HVN/LVN volume nodes (prominence-filtered local extremes). Accuracy choices: each bar's volume is distributed range-proportionally across the rows it overlaps (not binned at one point); POC ties break toward the session center. Weakness left open: a drawn level says nothing about whether it matters.
A qualified-touch detector. A level must be ARMED — price fully away from it by at least k×ATR — before a touch of it can count, and it disarms after every touch. Chop sitting on a line cannot enter the record. Approach direction is stored with every event. Weakness left open: a touch is not an outcome.
Triple-barrier outcome resolution (outcome labelling — M. López de Prado). From each touch: REJECT if price moves m×ATR back the way it came first, BREAK if it moves m×ATR through first, TIMEOUT after T bars. Purity rules: barriers are fixed at the ATR of the touch moment; evaluation starts the bar after the touch; a bar hitting both barriers is a timeout, never a guess. Weakness left open: one level's history is n = 1.
Per-TYPE pooling with honesty gates. Statistics pool by level type, never by individual line — a type is a real sample. A type shows no score until a minimum number of its touches have resolved (default 20); until then it reads BUILDING with its count. Timeouts are reported in n but excluded from the reject/break ratio. Fade expectancy = (rejects − breaks) / (rejects + breaks), in R.
How to read it
Rails are colored and styled by type (solid profile levels, dashed day levels, dotted volume nodes, violet naked POCs); each label carries its type's live score or its BUILDING count.
Evidence on the chart: a gray • at every qualified touch, then ○ (teal) where the touch rejected and ✕ (amber) where it broke. Every number on the scoreboard can be audited against the chart.
Dashboard: nearest level and its score, with a plain-language verdict (tends to hold / coin flip / tends to break) so the read needs no statistics background; per-type scoreboard (fade R · reject % · n) for all nine types; touch counts; the exact engine settings in the NOTE row.
Honest expectations: most types on most charts score near zero — that is the truthful baseline, and seeing it protects you from folklore. The value is in the exceptions this chart's own history reveals (for example, day extremes often carry a modest positive fade expectancy while POC retests are a coin flip), and in knowing the difference.
How to use it
Use the scoreboard to weight your own playbook: give more respect to touches of types that have measured well here, less to types that grade as noise — and size accordingly. The "Touch of a MEASURED level" alert fires only when price reaches a type with a real sample behind it. This is context about where price reactions have had structure — never a direction, never an entry signal.
Non-repaint & universality
Profiles, POC/VA/nodes and day levels commit only at session close on confirmed bars; touches and outcomes resolve on confirmed bars; the AVWAP is cumulative within its session. Nothing repaints. The script requests no external data of any kind — no lower timeframes, no security calls — so it runs identically on every plan and every symbol with volume.
Use on any market
Volume source, profile rows, value-area %, node thresholds, arm distance, barriers and sample gates are all inputs. Defaults suit liquid intraday index futures; intraday timeframes give the engine the most touches to learn from.
Originality & credits
The synthesis — a range-proportional session profile, qualified-touch detection, touch-time-ATR triple-barrier outcomes, and per-type pooled reaction statistics displayed as a live scoreboard — is original work for this publication. Concept credits: Market Profile / point of control / value area — J. Peter Steidlmayer; naked (virgin) POC — market-profile literature; anchored VWAP — as popularised in modern trading literature; triple-barrier outcome labelling — M. López de Prado. Implementation and charting design are the author's own.
Disclaimer
Research and education only. NOT financial advice, NOT a signal service, NOT a guarantee of future results. Reaction statistics are empirical frequencies from this chart's limited history, pooled per level type; they change with regime and sample, and a positive expectancy is not a promise. Validate independently and manage your own risk. Indicador

Indicador
Session Value Ribbon [EXCAVO]Anchored volume-weighted mean with a harmonic value ribbon and HTF confluence
The Session Value Ribbon plots a volume-weighted mean of price and a volatility-scaled sigma envelope, then partitions the space between them into a harmonic value ribbon (0.236, 0.382, 0.5, 0.618, 0.786). Three anchor modes let the wave adapt to any chart: Rolling (a sliding N-bar window, default), Timeframe (classical anchored VWAP that resets each session), and Date (fixed anchor). A second accumulator on a slower reference timeframe runs the same math and plots as an HTF confluence line for multi-scale reads.
This is not a basic VWAP indicator. The ribbon layers, the volatility-regime scaling of the sigma bands, the HTF confluence overlay, and the auto-resolver that picks the anchor from the chart timeframe turn a single-line mean into a full value map of the current session.
━━━━━━━━━━━━━━━━━━━━━━━━━━━━━━━━━━━━━━━
▸ HOW TO USE
Step 1 → Add the indicator. The anchored mean, sigma envelope
and value ribbon draw immediately on whatever anchor
mode is selected (Rolling by default).
Step 2 → Read the mean as fair value for the active anchor.
Price above the mean = participants are bidding higher
than the anchor-window average; price below = lower.
Step 3 → Watch the outer sigma bands. A close beyond them
means price is stretched from fair value; the ribbon
layers below act as pullback shelves.
Step 4 → Use ribbon layers as intraday shelves. The 0.5 layer
is the midpoint between mean and outer band; the 0.236
layer sits close to the mean; the 0.786 layer sits
close to the outer band. Look for stalls and false
breaks at each layer.
Step 5 → Cross-check with the HTF confluence line. When the
primary mean and the HTF mean converge, price is in a
multi-scale value zone; when they diverge, one session
is running ahead of the other.
Step 6 → Read the dashboard for anchor mode, current mean,
distance from mean in sigmas, slope regime and bar
count since the anchor.
━━━━━━━━━━━━━━━━━━━━━━━━━━━━━━━━━━━━━━━
▸ HOW IT CALCULATES
◆ Volume-Weighted Mean
The mean is a running weighted average of the selected price source. Weights come from volume with three modes: Full uses raw volume (classical MIDAS weighting), Root uses the square root of volume (dampens single-bar spikes so one huge candle cannot drag the mean), and None uses equal weight (the mean degenerates to a plain arithmetic average of the source).
◆ Anchor Modes
Rolling accumulates over a sliding N-bar window (default 200 bars), so the wave is always N bars long regardless of chart timeframe. Timeframe resets the accumulator on each boundary of the chosen anchor timeframe (Daily by default), matching the behaviour of a classical anchored VWAP. Date locks the anchor to a specific timestamp and keeps accumulating forever after.
◆ Sigma Envelope
Sigma is computed from the anchor-window weighted variance, E − (E )². The outer bands are drawn at ±sigmaMultiplier × sigma around the mean. Optional Volatility Regime Adjust multiplies sigma by an ATR-relative factor, bounded between 0.7x and 1.4x, so the bands breathe with the current activity state, giving tighter bands in quiet regimes and wider bands in wild ones.
◆ Harmonic Value Ribbon
The space between the mean and each outer band is split into harmonic layers at 0.236, 0.382, 0.5, 0.618 and 0.786 of the sigma distance. The ribbon is rendered as a progressive-opacity fill, not as separate labelled lines, so the eye reads a continuous value gradient instead of a stack of horizontal ledger lines.
◆ HTF Confluence Layer
A second accumulator runs the exact same math on the next slower anchor timeframe (Rolling with a longer window when the primary is Rolling; the next-slower TF step when the primary is Timeframe). The HTF mean plots as a thin coloured line. When the primary mean and the HTF mean align, price is in a multi-scale value zone.
◆ Slope-Based Regime Classifier
The classifier measures the slope of the primary mean over the slope-lookback window and normalises it by ATR. If |slope|/ATR exceeds the slope threshold (default 0.05 xATR), the ribbon and mean tint bull or bear. Below the threshold the regime is flat and the palette stays neutral.
━━━━━━━━━━━━━━━━━━━━━━━━━━━━━━━━━━━━━━━
▸ WHAT MAKES IT DIFFERENT
◆ Chart-Timeframe Auto-Resolver
The anchor timeframe is resolved automatically from the chart timeframe, so the wave shape stays consistent across intraday, swing and position TFs without manual tuning.
◆ Volatility-Regime Scaling
The sigma envelope adapts to activity state instead of being fixed at a static multiplier. Tight regimes contract the bands, wild regimes widen them, with a bounded 0.7x to 1.4x multiplier so the visual stays stable.
◆ Harmonic Ribbon as Progressive Fill
The intra-band space is drawn as a smooth value gradient rather than a stack of horizontal lines. Layer count is user-selectable (Harmonic 3, 5 or 7).
◆ HTF Confluence Overlay
A second anchored mean on the next slower timeframe plots as a companion line so multi-scale value alignment is visible without a second indicator on the chart.
◆ Distance-In-Sigma Readout
A right-edge readout reports the current mean and the current distance from mean in sigmas, so the extreme readings are legible without measuring.
◆ EXCAVO Overlay Visual
Chart-anchored overlay only, with no pane oscillator and no floating badges. The wave, ribbon and HTF line share a single tonal palette that stays out of the way of price action.
━━━━━━━━━━━━━━━━━━━━━━━━━━━━━━━━━━━━━━━
▸ DASHBOARD
Real-time panel (top right by default) with all key metrics:
Anchor - active anchor mode with its parameter (Rolling N, Timeframe TF, or Date)
Mean - current value of the anchored mean
Distance - price distance from mean in sigmas, signed
Regime - Up / Down / Flat classification from the slope-based regime engine
Bars in Anchor - bar count since the anchor started accumulating
Legend table (bottom left) explains every glyph and colour used on the chart. Toggle in Dashboard settings.
━━━━━━━━━━━━━━━━━━━━━━━━━━━━━━━━━━━━━━━
▸ SETTINGS
Anchor
Anchor Mode - Rolling (default), Timeframe, or Date
Rolling Length (bars) - 200 (window used in Rolling mode)
Anchor Timeframe - D (used in Timeframe mode)
Anchor Date - 01 Jan 2025 (used in Date mode)
Source
Price Source - (H+L+C)/3 (typical price)
Volume Weight - Full (raw volume) - Root (square root of volume) - None (equal weight)
Sigma Bands
Sigma Multiplier - 2.0 (band distance in sigmas)
Volatility Regime Adjust - OFF (ATR-scaled sigma with 0.7x-1.4x bounds)
Value Ribbon
Show Value Ribbon - ON
Ribbon Set - Harmonic 5 (0.236 / 0.382 / 0.5 / 0.618 / 0.786)
Ribbon Opacity Base - 80
Show Zone Fill - ON
Zone Fill Opacity - 88
HTF Confluence
Enable HTF Confluence - ON (draws a second mean from the next slower anchor)
Regime Coloring
Slope Regime Coloring - ON
Slope Lookback - 20 bars
Slope Threshold (xATR) - 0.05
Visualization
Bull Color - deep blue
Bear Color - red
Flat Color - neutral grey
HTF Confluence Color - amber
Show Right-Edge Readout - ON
Dashboard
Show Dashboard - ON
Dashboard Position - Top Right
Show Legend - ON
━━━━━━━━━━━━━━━━━━━━━━━━━━━━━━━━━━━━━━━
▸ ALERTS
Directional alerts only.
Price Crossed Above Anchored Mean - close crosses over the primary anchored mean
Price Crossed Below Anchored Mean - close crosses under the primary anchored mean
━━━━━━━━━━━━━━━━━━━━━━━━━━━━━━━━━━━━━━━
Built on MIDAS anchored VWAP (Paul Levine, 1990s), extended with three anchor modes (Rolling / Timeframe / Date), selectable volume weighting, volatility-regime scaling of the sigma bands, a harmonic ribbon rendered as a progressive-opacity fill, an HTF confluence layer, a slope-based regime classifier, and a right-edge distance-in-sigma readout.
Best regards,
EXCAVO
Disclaimer
Trading involves significant risk. This indicator is a technical analysis tool
and does not constitute financial advice, investment recommendations, or a
guarantee of future results. Past indicator behavior does not guarantee future
performance. Always use proper risk management and your own judgment.
Indicador

xKen-t COT Index & Extremes (Native)Overview
COT Index & Extremes (Native) turns Commitments of Traders positioning into a single, decision-ready sentiment reading. It fetches CFTC COT data directly, converts a chosen trader group's net position into a 0–100 index that shows where current positioning sits within its own historical range, and flags when that positioning reaches a bullish or bearish extreme. The goal is to replace "eyeballing" raw COT lines with a defined, repeatable number.
The concept behind it
Raw COT net positions are hard to act on because "a lot" or "a little" only means something relative to an asset's own history. This script applies a position-in-range normalization (in the spirit of a Williams %R calculation, but applied to positioning rather than price): it takes the selected group's net position (long minus short) and measures where today's value falls between its lowest and highest readings over a lookback window, scaled 0–100. A reading near 100 means positioning is at the top of its historical range; near 0, the bottom. Two windows are used together — a short (26-week) read for the current swing in sentiment and a long (~3-year, 156-week) read for the structural picture.
Extremes are then defined mechanically: at or above 80 = an extreme in that group's positioning (bullish bias for commercials), at or below 20 = the opposite extreme (bearish bias). This makes "extreme" a number you can journal and alert on, not a subjective judgment.
What it does
- Fetches CFTC COT data natively and auto-resolves the correct futures contract from the chart's symbol — no need to wire in another indicator as a data source.
- Builds the net position for the selected trader group and normalizes it to the 0–100 index (short and long lookbacks).
- Marks the bullish/bearish extreme threshold zones and states a plain bias: BULLISH, BEARISH, or NO EDGE.
- Lets you switch between Commercial, Non-Commercial, and Retail (non-reportable) groups. Note these read differently — commercial hedgers are commonly used as a contrarian ("smart money") read at extremes, while non-commercials and retail are the crowd typically faded at extremes.
- Fires alerts when the index crosses into a bullish or bearish extreme.
When a symbol has no CFTC data (cash indices, most single stocks, crypto, exotic crosses), it clearly states "NO COT — use the futures symbol" and prompts you, instead of silently plotting a misleading line off price.
- Displays a panel confirming the resolved CFTC code, the active trader group, and whether the chart is on the correct (weekly) timeframe.
What's original here
Most COT tools plot raw net positions or require you to wire in another indicator's data. This one is self-contained and reframes the data for decision-making through three things: (1) it fetches CFTC Commitment of Traders data natively via TradingView's COT library and auto-resolves the correct contract from the chart's futures symbol, so no source-wiring is needed; (2) it converts a chosen trader group's net position (long − short) into a 0–100 "position-in-range" index — a Williams-style normalization showing where current positioning sits within its own historical range over a short (26w) and long (~3y) lookback — so an "extreme" becomes a defined number (≥80 / ≤20) instead of a visual guess; and (3) it switches cleanly between Commercial, Non-Commercial, and Retail groups and states a plain bullish/bearish/neutral bias from the index. When a symbol has no CFTC data (cash indices, most stocks, exotic crosses) it says so and prompts for the futures symbol, rather than silently plotting noise. A panel confirms the resolved CFTC code, the group, and whether you're on the correct weekly timeframe.
How to use it
1. Open a weekly chart of the futures symbol (e.g. 6E1!, GC1!, DX1!, ES1!, 6N1!) — not the cash index or spot pair. COT is weekly data, and the lookbacks are counted in weekly bars.
2. Read the index and bias. ≥80 = bullish extreme, ≤20 = bearish extreme, mid-range = no positioning edge.
3. Use it as directional context, confirmed by your own entry method, levels, and risk management.
4. If the panel shows no code, enter the 6-digit CFTC code manually in settings, or switch to the contract's futures symbol.
Inputs
Trader group (Commercial / Non-Commercial / Retail) · optional CFTC code override · include-options toggle · short and long lookbacks · bullish/bearish thresholds · display and shading options.
Attribution
COT data access uses TradingView's official LibraryCOT. This script's original contribution is the index construction, bias logic, no-data handling, and presentation built on top of that data.
Limitations and disclaimer
COT is weekly, reported with a lag, and only exists for CFTC-reported futures — so this is context, not a timing signal, and it will not read non-CFTC instruments. Positioning extremes indicate potential, not certainty, and can persist for extended periods. This is an analysis tool, not financial advice. Always confirm with your own analysis and manage risk. Indicador

Indicador

COT Heatmap [invincible3]COT Heatmap
COT Heatmap is a professional Commitment of Traders dashboard designed to visualize historical positioning pressure between two selected markets, currencies, commodities, indices, or crypto futures. The indicator converts weekly COT positioning data into an easy-to-read heatmap table, allowing traders to compare Non-Commercial and Commercial positioning strength, extremes, long/short participation, and A-B spread pressure directly on the chart.
The tool is built for macro, forex, commodities, futures, and intermarket analysis. It can automatically detect the current chart symbol or allow the user to manually select Pair A and Pair B from a predefined COT market list.
-----------------------------------------------------------------------------------------------
Main Features
Historical COT heatmap table
Auto symbol detection from the chart
Manual Pair A / Pair B selection
Futures Only or Futures + Options data mode
Non-Commercial, Commercial, or Both participant modes
Separate metric control for Pair A and Pair B
Historical weekly values displayed by date
Adjustable table size, position, start date, and number of periods
Heatmap coloring for fast visual interpretation
Optional A-B positioning spread columns
-----------------------------------------------------------------------------------------------
Data Source
The indicator uses weekly COT data through TradingView’s COT Library.
Available data modes:
Futures Only
Uses futures positioning data only.
Futures and Options
Uses combined futures and options positioning data.
The indicator uses Legacy COT report categories:
Non-Commercial Positions
Commercial Positions
Open Interest
All COT calculations are performed on the weekly timeframe.
-----------------------------------------------------------------------------------------------
Participant Modes
The indicator supports three participant display modes:
Non-Commercial Only
Shows speculative positioning metrics.
Commercial Only
Shows hedger/commercial positioning metrics.
Both
Shows both Non-Commercial and Commercial metrics side by side.
-----------------------------------------------------------------------------------------------
Core Positioning Formulas
For each selected market:
Open Interest
OI = Total Open Interest
Non-Commercial Net Position
NC Net = NC Long − NC Short
Commercial Net Position
Commercial Net = Commercial Long − Commercial Short
Long Change
Long Change = Current Long − Previous Week Long
Short Change
Short Change = Current Short − Previous Week Short
Net Change
Net Change = Long Change − Short Change
-----------------------------------------------------------------------------------------------
Long% and Short% Formulas
The indicator normalizes long and short positions against open interest.
Long Percentage
Long% = Long Positions / Open Interest × 100
Short Percentage
Short% = Short Positions / Open Interest × 100
These values show how much of total open interest is held on the long or short side by a specific participant group.
-----------------------------------------------------------------------------------------------
Flip% Formula
Flip% measures the net long/short bias as a percentage of open interest.
Flip%
Flip% = Long% − Short%
Interpretation:
Positive Flip% = participant group is net long
Negative Flip% = participant group is net short
Higher positive values show stronger bullish positioning
Lower negative values show stronger bearish positioning
Example:
If Non-Commercial Long% = 42%
and Non-Commercial Short% = 25%
Then:
NC Flip% = 42 − 25 = +17%
This means Non-Commercial traders are net long by 17% of open interest.
-----------------------------------------------------------------------------------------------
Difference Metrics
The indicator compares Non-Commercial and Commercial net positioning.
Non-Commercial Difference
NC Difference = NC Net − Commercial Net
This measures how strongly speculative positioning differs from commercial positioning.
Commercial Difference
Commercial Difference = Commercial Net − NC Net
This is the inverse view, useful when analyzing commercial hedger pressure.
-----------------------------------------------------------------------------------------------
Diff13 / Diff26 / Diff52 Formulas
The Diff columns are stochastic-style normalized scores of the positioning difference over different historical windows.
Stochastic Positioning Score
Stoch(X, Length) =
(X − Lowest(X, Length)) / (Highest(X, Length) − Lowest(X, Length)) × 100
If the range is zero, the value returns 50.
Where:
X = selected positioning series
Length = 13, 26, or 52 weeks
NC Diff13 *
NC Diff13 = Stoch(NC Difference, 13)
NC Diff26
NC Diff26 = Stoch(NC Difference, 26)
NC Diff52
NC Diff52 = Stoch(NC Difference, 52)
Commercial Diff13
Commercial Diff13 = Stoch(Commercial Difference, 13)
Commercial Diff26
Commercial Diff26 = Stoch(Commercial Difference, 26)
Commercial Diff52
Commercial Diff52 = Stoch(Commercial Difference, 52)
Interpretation:
Values near 100 show positioning is near the upper extreme of the selected lookback period
Values near 50 show neutral/mid-range positioning
Values near 0 show positioning is near the lower extreme of the selected lookback period
-----------------------------------------------------------------------------------------------
COT Index Formulas
The COT Index measures where current net positioning stands relative to its own historical range.
COT Index
COT Index =
(Current Net Position − Lowest Net Position over N weeks) /
(Highest Net Position over N weeks − Lowest Net Position over N weeks) × 100
If the range is zero, the value returns 50.
-----------------------------------------------------------------------------------------------
Non-Commercial COT Index
NC Index 52
NCIdx52 = Stoch(NC Net, 52)
This shows where current Non-Commercial net positioning stands within its 1-year range.
NC Index 156
NCIdx156 = Stoch(NC Net, 156)
This shows where current Non-Commercial net positioning stands within its 3-year range.
-----------------------------------------------------------------------------------------------
Commercial COT Index
Commercial Index 52
ComIdx52 = Stoch(Commercial Net, 52)
This shows where current Commercial net positioning stands within its 1-year range.
Commercial Index 156
ComIdx156 = Stoch(Commercial Net, 156)
This shows where current Commercial net positioning stands within its 3-year range.
-----------------------------------------------------------------------------------------------
A-B Spread Formulas
The indicator can also compare Pair A and Pair B positioning directly.
A-B Non-Commercial Flip%
A-B NC Flip% = Pair A NC Flip% − Pair B NC Flip%
A-B Commercial Flip%
A-B Commercial Flip% = Pair A Commercial Flip% − Pair B Commercial Flip%
Interpretation:
Positive A-B Flip% means Pair A has stronger positioning than Pair B
Negative A-B Flip% means Pair B has stronger positioning than Pair A
Useful for forex pair analysis, relative commodity analysis, and intermarket comparison
Example:
If EUR NC Flip% = +20%
and USD NC Flip% = +5%
Then:
EUR − USD NC Flip% = +15%
This suggests stronger speculative positioning in EUR relative to USD.
-----------------------------------------------------------------------------------------------
Heatmap Color Logic
The table uses color gradients to make positioning extremes easy to identify.
For score-based columns such as Diff13, Diff26, Diff52, NCIdx52, NCIdx156, ComIdx52, and ComIdx156:
High values move toward the positive color
Mid-range values move toward the neutral color
Low values move toward the negative color
Default colors:
Positive: Blue
Neutral: Pink
Negative: Red
For Long% columns:
Higher Long% is treated as stronger
Lower Long% is treated as weaker
For Short% columns:
Higher Short% is treated as weaker
Lower Short% is treated as stronger
For Flip% columns:
The heatmap uses a signed scale.
Signed Heatmap Normalization
Normalized Flip Value =
(Flip% + Flip Scale) / (2 × Flip Scale)
The value is clamped between 0 and 1.
Default Flip Scale = 35%
This means:
+35% or above = strong positive color
0% = neutral color
−35% or below = strong negative color
-----------------------------------------------------------------------------------------------
How to Read the Table
Each row represents one weekly COT snapshot.
The Date column shows the COT week.
Pair A and Pair B are displayed in separate grouped sections. Each section can include Non-Commercial metrics, Commercial metrics, or both, depending on user settings.
Important interpretation guidelines:
Diff13 / Diff26 / Diff52
Shows short-term, medium-term, and 1-year positioning extremes between Non-Commercial and Commercial groups.
NCIdx52 / NCIdx156
Shows whether speculative positioning is historically stretched or depressed.
ComIdx52 / ComIdx156
Shows whether commercial hedger positioning is historically stretched or depressed.
Long%
Shows the long-side participation as a percentage of open interest.
Short%
Shows the short-side participation as a percentage of open interest.
Flip%
Shows the net directional bias after subtracting short exposure from long exposure.
A-B Flip%
Shows relative positioning pressure between the two selected markets.
-----------------------------------------------------------------------------------------------
Example Use Cases
Forex Analysis
Use Pair A and Pair B to compare currency futures positioning.
Example:
Pair A = EUR
Pair B = USD
This allows EUR/USD positioning analysis using COT data.
Commodity Analysis
Compare metals, energy, or agricultural markets.
Example:
Pair A = Gold
Pair B = Silver
This helps identify relative speculative or commercial positioning strength.
Index Analysis
Compare equity index futures.
Example:
Pair A = NASDAQ
Pair B = S&P 500
This can help identify relative risk appetite and index positioning rotation.
Macro Sentiment Analysis
Use Non-Commercial positioning to track speculative crowding and Commercial positioning to observe hedging pressure.
-----------------------------------------------------------------------------------------------
Notes
COT data is weekly and is not designed for intraday signals. This indicator is best used as a macro positioning tool, sentiment confirmation tool, or higher-timeframe market context dashboard.
The heatmap does not generate direct buy or sell signals. Instead, it provides a structured view of positioning extremes, participant behavior, and relative strength between selected COT markets.
Extreme readings can remain extreme for long periods, so COT data should be combined with price action, trend structure, volatility, liquidity, and broader market context.
-----------------------------------------------------------------------------------------------
Summary
COT Historical Heatmap transforms weekly Commitment of Traders data into a clean, customizable, and visually intuitive positioning dashboard. By combining Net Positioning, Long%, Short%, Flip%, COT Index, Difference Scores, and A-B relative spread analysis, it helps traders understand how Non-Commercial and Commercial participants are positioned across major futures markets.
Indicador

Stocks: Dashboard [invincible3]Stocks Dashboard is a professional all-in-one stock analysis dashboard built directly for TradingView charts. It is designed to help investors, traders, and analysts quickly evaluate a stock using a combination of fundamental strength, valuation, financial health, income quality, shareholder return, and price momentum.
The indicator displays a clean table-based dashboard on the chart and converts raw financial and technical data into easy-to-read category scores. Instead of checking many separate financial ratios manually, this dashboard organizes the most important stock metrics into structured sections and gives a clear visual overview of the company’s current condition.
The dashboard includes composite scoring for Quality, Value, Growth, Financial Health, Income / Shareholder Return, and Momentum. Each category is scored from 0 to 100 and classified using simple rating labels such as Elite, Strong, Fair, Weak, or Risk. This allows users to quickly compare the strength and weakness of a stock across multiple dimensions.
The Valuation section includes important valuation metrics such as P/E TTM, Forward P/E, PEG Ratio, P/S, P/B, EV/EBITDA, EV/Sales, Earnings Yield, Operating Earnings Yield, Graham Price, Graham Number Upside, EPS TTM, and BVPS. These metrics help identify whether a stock may be expensive, fairly valued, or potentially undervalued.
The Quality section focuses on profitability and business efficiency. It includes ROE, Asset Return / ROA, ROIC, Piotroski F-Score, Gross Margin, Operating Margin, Net Margin, EBITDA Margin, and Free Cash Flow Margin. These values help evaluate how efficiently the company generates profits from its assets, equity, capital, revenue, and operations.
The Growth section tracks the company’s expansion profile using Revenue Growth, EPS Growth, and Sustainable Growth Rate. These metrics help users understand whether the business is improving, stagnating, or losing earnings momentum.
The Financial Health section evaluates balance sheet strength and risk. It includes Debt / Equity, Debt / Assets, Debt / EBITDA, Net Debt / EBITDA, Cash / Debt, Current Ratio, Quick Ratio, Interest Coverage, Altman Z-Score, Operating Cash Flow, and Free Cash Flow. This section is useful for identifying companies with strong liquidity, manageable debt, and lower financial risk.
The Income / Return section is designed for dividend and shareholder-return analysis. It includes Dividend Yield, Payout Ratio, Free Cash Flow Yield, DPS, Buyback Yield, and Buyback Ratio. These metrics help investors evaluate whether a company is returning value to shareholders through dividends, buybacks, and cash generation.
The Momentum section adds a technical view of the stock. It includes RSI 14, 1-month return, 3-month return, 6-month return, 12-month return, 6-month relative strength versus a selected benchmark, 12-month relative strength versus a selected benchmark, volatility, and moving-average trend using the 20, 50, and 200 daily moving averages.
The Snapshot section provides a quick summary of the selected stock, including current price, market capitalization, enterprise value, 52-week position, and distance from the 52-week high. This gives users a fast overview of where the stock is trading relative to its recent range.
Users can customize the stock symbol, benchmark/index symbol, financial period, table position, text size, color theme, and visible sections. The dashboard supports multiple professional themes, including Dark Terminal, Light Terminal, Emerald Pro, Royal Blue, and Amber Desk. Users can also enable or disable colored score backgrounds, score bars, alternating rows, colorful section headers, and directional symbols.
This indicator is useful for:
* Long-term stock analysis
* Fundamental screening
* Valuation comparison
* Dividend and shareholder-return review
* Financial health analysis
* Momentum confirmation
* Relative strength comparison against an index or benchmark
* Building a structured watchlist review process
The goal of this dashboard is to provide a fast, organized, and visually professional stock overview without requiring users to switch between multiple financial websites or separate indicators. It combines fundamental data and technical momentum into one compact chart-based table, making it easier to identify strong, weak, undervalued, overvalued, or financially risky stocks.
Note: The dashboard uses TradingView’s available financial data. Some metrics may appear unavailable depending on the selected symbol, exchange, market, or financial data coverage. This tool is intended for analysis and research purposes only and should not be considered financial advice.
Indicador

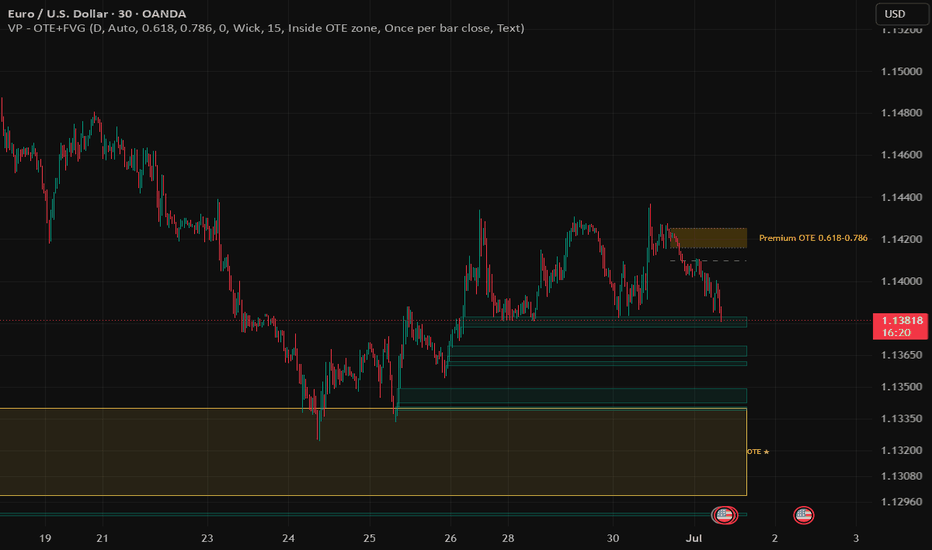
Fib OTE + FVG Confluence [Viprasol]Fib OTE + FVG Confluence — high-probability ICT entries where two edges agree
═══════════════════════════════════════════════════════════
THE IDEA
═══════════════════════════════════════════════════════════
A Fair Value Gap is a good entry zone. An OTE (Optimal Trade Entry) retracement is a
good entry zone. But an FVG that sits INSIDE the OTE — that's the setup ICT traders
actually wait for. This tool maps the higher-timeframe OTE / premium-discount zone,
detects Fair Value Gaps, and does the one thing that matters: it highlights and ALERTS
you when price taps an FVG that lands inside the OTE.
═══════════════════════════════════════════════════════════
HOW IT WORKS
═══════════════════════════════════════════════════════════
1. HTF OTE MAP — From the previous candle range of your chosen higher timeframe
(non-repainting), it builds the Fibonacci map: the OTE band (default 0.618-0.786),
the equilibrium line (0.5) that splits premium from discount, and a directional bias
(Auto from the last HTF candle, or force Long/Short). In a long bias the OTE sits in
discount (below equilibrium) — where you want to buy; in a short bias it sits in
premium.
2. FAIR VALUE GAPS — Standard 3-candle imbalances (bullish `low > high `, bearish
`high < low `), with an optional displacement filter and a minimum-size filter to
cut noise. Each gap is drawn as a box and tracked until filled (Wick / Close /
Average mitigation).
3. CONFLUENCE — the point of the tool. A gap is "confluent" when it overlaps the OTE
band (strict) or, in the looser mode, when a bullish gap sits in discount / a bearish
gap sits in premium. Confluent gaps are highlighted with a ★. Turn on "Show ONLY
Confluent FVGs" and the chart reduces to just the high-probability zones.
4. ALERTS — Get notified when price TAPS a confluent FVG (and optionally when one
forms). One alert, delivered via app / email / SMS / webhook (Text or JSON message).
═══════════════════════════════════════════════════════════
ALERTS SETUP
═══════════════════════════════════════════════════════════
Create one alert → Condition: "Fib OTE + FVG Confluence" → "Any alert() function call",
then pick your delivery (app/email/SMS/webhook) in the dialog. Switch Message Format to
"JSON (webhook)" for bot/automation-friendly output. Messages carry direction, event
(FORMED/TAPPED), and the gap's price range.
═══════════════════════════════════════════════════════════
SETTINGS
═══════════════════════════════════════════════════════════
• HTF Fibonacci / OTE: timeframe, bias (Auto/Long/Short), OTE start/end, show map, colors.
• Fair Value Gaps: min gap %, displacement filter, fill mode, show-only-confluent, colors, box extend.
• Confluence & Alerts: confluence rule (Inside OTE / Favored half), highlight color, form/tap
alert toggles, frequency (once-per-bar-close = no repaint), Text/JSON.
═══════════════════════════════════════════════════════════
HOW TO USE
═══════════════════════════════════════════════════════════
1. Set the OTE higher timeframe (e.g. Daily on an intraday chart).
2. Let Auto bias pick direction, or force Long/Short to your plan.
3. Enable "Show ONLY Confluent FVGs" to see just gaps inside the OTE.
4. Create the alert and wait for a tap of a ★ confluent gap — that's your cue to do
your own analysis and manage risk.
═══════════════════════════════════════════════════════════
LIMITATIONS — PLEASE READ
═══════════════════════════════════════════════════════════
• This is an awareness / confluence tool, not a strategy or signal service — no buy/sell
calls. A confluent tap is a location of interest, not a guarantee.
• The OTE map uses the previous HTF candle range and updates as new HTF candles form;
it reflects current context, not a fixed historical grid.
• FVGs are detected on the chart timeframe; confluence is judged against the OTE active
when each gap forms.
• Not financial advice. Trade at your own risk.
═══════════════════════════════════════════════════════════
CREDITS & ORIGINALITY
═══════════════════════════════════════════════════════════
Fair Value Gaps, OTE, and premium/discount are public ICT concepts. All code here — the
non-repainting HTF OTE map, the FVG detection and mitigation, the confluence logic, and
the alert engine — is original Viprasol work written from the standard definitions. No
third-party Pine code is reused.
Indicador
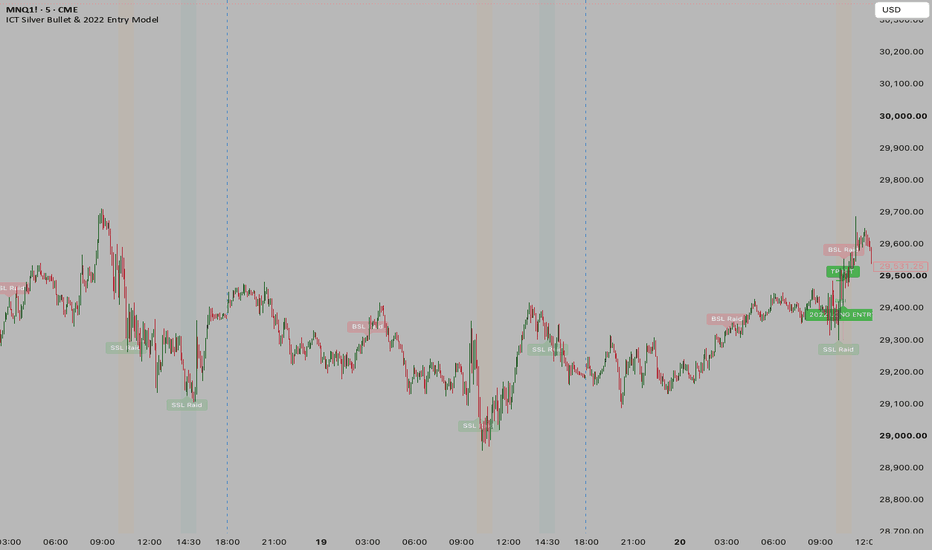
ICT Silver Bullet & 2022 Entry ModelThis script is a fully automated algorithmic scanner and trade visualizer for the ICT 2022 Mentorship Entry Model, specifically programmed to only look for setups during the Silver Bullet time windows.
Here is a breakdown of how the engine works from top to bottom:
1. Time & Sessions Engine
The script begins by shading your chart background for the three specific "Silver Bullet" execution hours (EST):
London: 03:00 - 04:00 (Silver)
New York AM: 10:00 - 11:00 (Orange)
New York PM: 14:00 - 15:00 (Teal) The script will strictly ignore any price action outside of these three windows.
2. The 5-Phase State Machine
Inside those sessions, the script runs a rigid 5-step sequence to validate the 2022 Model. It will cancel the setup if the sequence is broken.
Phase 1: Liquidity Raid (The Stop Run) The script tracks historical Swing Highs (Buy-Side Liquidity) and Swing Lows (Sell-Side Liquidity). If price sweeps one of these levels, it prints a "BSL Raid" or "SSL Raid" label. Crucially, it nullifies that specific liquidity level immediately after it's swept so you don't get duplicate labels on every single candle.
Phase 2: Market Structure Shift (ChoCh) Upon sweeping liquidity, the script identifies the exact minor swing point that formed just prior to the sweep. It waits for price to aggressively reverse and close past that level. When it does, it plots a line and a "ChoCh" (Change of Character / MSS) label.
Phase 3: Displacement FVG Detection The leg that breaks structure must show institutional displacement. The script scans the exact 3-5 candles that broke the ChoCh level to find a Fair Value Gap (SIBI for shorts, BISI for longs). If it finds one, it draws the gap box on your chart.
Phase 4: Trade Execution The script waits for price to retrace and tap the open boundary of the FVG. The moment price touches it, the script prints a "2022 SHORT ENTRY" or "2022 LONG ENTRY" label.
Phase 5: Trade Management & Visualizer (The code block you highlighted) Upon entry, the script transitions into a live trade manager:
Stop Loss (SL): It calculates an SL exactly 1 tick above the absolute peak of the Liquidity Raid. It draws a solid red line and a red risk box.
Take Profit (TP): By default, it targets the opposing major liquidity pool on the chart. If you toggle it off in settings, it defaults to a strict 1:2 Risk-to-Reward ratio. It draws a solid green line and a green reward box.
Live Tracking: The script physically extends these red and green boxes forward bar-by-bar until price hits either the SL line or the TP line. Once hit, it closes the trade, prints "SL HIT" or "TP HIT", and resets the engine to look for the next setup. Indicador
Bias & Sweep Dashboard1. Inputs & Configuration
Timeframes: Allows you to set the Higher Time Frame (HTF) (default: Daily / D) and the Intermediate/Lower Time Frame (ITF) (default: 4H / 240).
Sweep Settings: Features a customizable Swing Lookback input (default: 10 bars) to determine the structural swing points.
Table Settings: Allows configuration of the visual dashboard placement on the screen (Top Right, Bottom Left, etc.) along with background and text color styling.
2. Detection Logic
Pivots & Liquidity Sweeps:
Finds swing highs and swing lows using ta.pivothigh() and ta.pivotlow().
A Sweep is triggered when a candle's wick breaks past a key swing high/low, but the candle close returns back inside (denoting rejection of liquidity).
Uses request.security() to evaluate these sweeps on your defined HTF and ITF timeframes.
Inversions:
Tracks Fair Value Gaps (FVGs).
An Inversion is triggered when the price closes completely through a recent opposing FVG (e.g. closing above a Bearish FVG, or closing below a Bullish FVG).
Trend Bias:
Calculates trend direction using a standard EMA crossover (50 EMA vs 200 EMA) to decide if the baseline market environment is Bullish, Bearish, or Neutral.
3. Visual Dashboard (Table UI)
At the final bar (barstate.islast), the script builds a 2x4 table panel displaying:
Bias: Displayed as "Bullish" (green), "Bearish" (red), or "Neutral" (gray).
HTF Sweep: Shows ✅ if an HTF sweep is active, else ❌.
ITF Sweep: Shows ✅ if an ITF sweep is active, else ❌.
Inversion: Shows ✅ if an FVG Inversion has occurred, else ❌. Indicador

Adaptive Structural Trail Order Flow, Imbalance & RegimeAdaptive Structural Trail — Order Flow, Imbalance & Regime
What it is
Adaptive Structural Trail is a single, self-contained market-structure framework that re-clocks the chart by participation instead of time, marks the imbalances that real activity leaves behind, lets order flow decide which of those levels still matter, asks a regime filter whether trending behaviour can be trusted right now, and trails the strongest surviving level as an adaptive stop — all summarised in a plain-language dashboard that tells you, at a glance, whether the picture says ride, wait, or stand aside.
It is designed to be market-agnostic: every raw input (price, volume, and the volatility-index reference) is user-selectable, so the same logic runs on index futures, equities, FX, crypto or commodities without touching the code. Defaults are set for NIFTY index futures; change the volatility symbol and (if needed) the volume source for other instruments.
Why the components are combined (this is one tool, not a bundle)
Each layer measures a different facet of one process — activity creating structure, structure decaying or being defended, and a regime deciding whether to act. They are not independent indicators stacked for visual effect; remove any one and the others lose their meaning:
Delta clock (the substrate). A virtual bar closes only when cumulative signed volume becomes statistically significant (σ × a multiplier). Every downstream reading is therefore spaced by participation, not by the clock — a quiet 10 minutes and a violent 10 seconds are treated differently, which is the whole point.
Imbalance / fair-value-gap detection runs on those virtual bars, so a level is recorded only where genuine activity gapped price, not on arbitrary time bars.
Order-flow lifecycle (charge → decay → breaker/dead). When price returns to a level, delta adjudicates the outcome: absorbed-and-defended levels are reborn as breakers; levels that are surged through are killed. Flow decides what structure survives.
Regime gate (efficiency ratio + volatility burst). This routes everything. The trail is shown and signals arm only where trend behaviour is statistically credible; in range/transition/high-volatility states the tool deliberately stands aside.
Confidence fusion. Structure strength, cumulative-delta slope and flow toxicity (VPIN) are blended into one confidence number, which the dashboard converts into a plain instruction.
That coupling — a volume-significance clock feeding imbalance detection whose survival is adjudicated by order flow and gated by regime, fused into a single trailing level and a decision read-out — is the original contribution here.
How to use it
Add it to any liquid instrument. It is built for intraday timeframes (1–15 min is the sweet spot on index futures).
Read the dashboard top-down: the ACTION banner is the headline (e.g. LONG · ride the trail, RANGE · stand aside). Below it: bias + confidence, market state, the actual trail-stop price, order flow, flow toxicity, volatility context, and a plain "what to do" line.
Treat the coloured trail as a structure-based stop while the market state is a trend; when the state leaves trend, the trail disappears by design.
The imbalance zones show where unfilled activity sits; fresh, tapped and breaker levels are colour-coded (see the on-chart legend).
Edge-calibration panel (bottom-right): for transparency it scores past signals against a regime-matched base rate and reports EDGE = Hit − Base with a 95% confidence interval. Read the Edge column, not the raw hit-rate. This is descriptive of the past on your symbol — not a backtest and not a forward guarantee.
Key-info panel (top-left): instrument, timeframe, the live data source (see honesty note), threshold, ATR and level counts.
Honest note on data (please read)
TradingView exposes no true tick-by-tick aggressor delta and cannot build custom bars, so delta here is a proxy: signed intrabar volume taken from the finest lower timeframe your data plan returns — 1-second where available, otherwise 1-minute — falling back to bar-shape when no lower-timeframe data exists. The live source is shown as "Delta source" in the Key-info panel, so you always know which mode is active. Non-repaint: the delta clock advances and structure/regime/signals resolve only on confirmed bars; the trail line itself updates within the forming bar as a current estimate.
Originality
The novelty is the synthesis and coupling, not any single classical block. A participation clock is used to gate imbalance detection; order flow is used to adjudicate level survival; regime is used to route the entire read; and the whole thing collapses into one trailing level plus a decision dashboard and a self-calibration panel. Every raw input is user-selectable so the framework generalises across markets.
Concept credits
This tool synthesises well-established, publicly documented ideas; credit to their originators:
Information / volume-driven bars & VPIN flow toxicity — Marcos López de Prado; Easley, López de Prado & O'Hara.
Efficiency Ratio (trend vs. noise) — Perry J. Kaufman.
Trade-side classification (tick rule) — Lee & Ready.
Market impact & absorption (square-root law) — Almgren; Tóth & Bouchaud.
Wilson score interval (small-sample proportion CI) — E. B. Wilson.
Imbalance / fair-value-gap and trailing-stop concepts are long-standing, widely used market-structure ideas. The synthesis and the Pine implementation are the author's own.
Exported outputs (for use in other scripts)
Available via input.source() in any other indicator, with clean generic names: Bias Score (signed conviction, ±10), Trail Stop, Trail Direction, Regime State, Confidence, Leading Strength, CVD Slope, Flow Toxicity, Cumulative Delta, Volatility ROC, Volatility Bias.
Disclaimer
For research and education only. This is an analytical tool — not financial advice, not a signal service, and not a guarantee of future results. No indicator has an inherent edge; validate with your own testing, apply realistic costs, and manage risk. You are solely responsible for your trading decisions. Indicador

Indicador