TF: Smooth Trend Follower with Volume Sparks (STF)TradingFlow: Smooth Trend Follower with Volume Sparks (STF)
STF keeps the active trend visible with a trailing dotted line and a soft shadow between the line and price. Optional Volume Sparks add a second gradient that brightens when volume becomes unusually active during the trend.
Use STF to read trend direction, follow pullbacks toward the trailing boundary, and spot changes in market participation without adding more panels to the chart.
The Trend Line
• Smoothed range distance: STF smooths each bar's high-low range with a Hull moving average. This creates a responsive price distance while filtering short-term noise.
• Fixed or adaptive factor: the range distance is multiplied by the Base Factor. With ATR adaptation enabled, the factor rises or falls with current ATR relative to its average, within the selected minimum and maximum limits.
• Trailing bands: upper and lower bands ratchet behind price. A close through the opposite band changes the trend direction.
• Visual offset: the dotted line and start marker can be moved away from candles by an ATR-based distance. The offset changes the display, not the trend calculation.
Reading STF
• Green line below price: an active uptrend. Pullbacks toward the line show how closely price is testing the trailing boundary.
• Red line above price: an active downtrend. Rallies toward the line show the same test from the opposite direction.
• Start marker: a circle marks a confirmed direction change at the close of the bar.
• Trend shadow: the pale fill makes the distance between price and the active boundary easy to see.
When price and the line move together with a steady gap, the trend is progressing cleanly. A fast move back toward the line deserves attention, especially near a prior high, low, breakout level, or other visible structure.
Volume Sparks
Volume Sparks rank each bar's volume within the selected lookback. Because the reading is relative, it adapts to the symbol and timeframe automatically.
• Sparks mode: highlights bars above the selected volume percentile. The strongest readings produce the brightest pulses.
• Continuous mode: keeps a light participation layer visible and varies its intensity with the volume rank.
• Gradient: the pulse is strongest at the dotted trend line and fades toward price. Green or red continues to show trend direction; brightness shows volume intensity.
Volume Sparks measure activity, not trade direction. Read a bright pulse together with the candle and nearby structure. On symbols with missing, sparse, or unchanging volume, the layer switches itself off while STF continues normally.
A Simple Reading Process
1. Read the line's color and position to establish the current direction.
2. Check whether price is extending, tracking the line, or pulling back toward it.
3. Use a Volume Spark to locate bars where participation expanded.
4. At a direction change, compare the confirmed marker with nearby price structure.
5. Set the alert that matches the trend event you want to follow.
---
TradingFlow: Smooth Trend Follower with Volume Sparks (STF)
STF 用一條會跟著趨勢推進的虛線,加上價格與虛線之間的淡色陰影,讓目前方向一眼就能看懂。開啟 Volume Sparks 後,趨勢區內會多一層量能漸層;成交量明顯升溫時,顏色也會跟著變亮。
STF 適合拿來看趨勢方向、觀察價格拉回追蹤線的深度,也能直接在主圖上看到量能何時突然放大,不必一直切換到副圖。
趨勢線
• 平滑波幅: 先用 Hull 移動平均處理每根 K 棒的高低差,濾掉短線雜訊,同時保留對波動變化的反應速度。
• 固定或自適應倍數: 平滑波幅會乘上 Base Factor。開啟 ATR 自適應後,倍數會跟著目前 ATR 相對於平均 ATR 的高低調整,並限制在設定的上下限之間。
• 追蹤軌道: 上、下軌道會沿著價格單向推進。收盤價穿過另一側軌道時,趨勢方向切換。
• 視覺偏移: 可用 ATR 距離把虛線和起始圓點移離 K 棒。這項設定只改變畫面,不會改變訊號。
STF 怎麼看
• 價格下方的綠色虛線: 目前是上升趨勢。價格拉回虛線時,可以直接看出這次回測有多深。
• 價格上方的紅色虛線: 目前是下降趨勢。反彈靠近虛線時,也是同樣的觀察方式。
• 起始圓點: K 棒收盤確認方向切換後,圓點會標出新趨勢的起點。
• 趨勢陰影: 淡色區塊把價格到追蹤線的距離直接畫出來。
價格和虛線維持穩定距離、一起往同一方向推進,通常是比較順的走法。價格快速回到虛線附近時,就要多看一眼,尤其是剛好碰到前高、前低、突破位或其他明顯結構的位置。
Volume Sparks(量能脈衝)
量能脈衝會把每根 K 棒的成交量放進指定回看區間,計算它目前落在哪個百分位。用相對排名取代固定數字後,不同商品和週期都能用同一套邏輯判讀。
• Sparks 模式: 只有成交量超過設定的百分位門檻才會亮起。排名越高,脈衝越明顯。
• Continuous 模式: 持續保留一層淡淡的量能顯示,再依成交量排名調整深淺。
• 漸層方向: 顏色在虛線附近最強,往價格方向逐漸淡出。綠色和紅色負責表示趨勢方向,亮度則表示量能強弱。
量能脈衝看的是活躍程度,不是買賣方向。看到明顯脈衝時,搭配當根 K 棒和附近結構一起看就好。遇到沒有成交量、資料太零散或成交量長期不變的商品,這一層會自動隱藏,STF 趨勢線照常運作。
實際看圖流程
1. 先看虛線顏色和它在價格的哪一側,確認目前方向。
2. 看價格是在加速遠離、沿著虛線推進,還是拉回測試虛線。
3. 量能脈衝亮起時,留意參與度放大的 K 棒。
4. 方向切換時,把收盤確認圓點和附近價格結構放在一起看。
5. 依照想追蹤的事件設定提醒。
---
TradingFlow: Smooth Trend Follower with Volume Sparks (STF)
STFは、トレンドを追う点線と、価格との間を埋める薄いシェードで現在の方向を見やすくします。Volume Sparksをオンにすると、トレンド領域に出来高のグラデーションが重なり、普段より商いが活発なバーが明るく表示されます。
トレンド方向、ラインへの押し・戻り、出来高の盛り上がりをメインチャートだけでまとめて確認できます。
トレンドライン
• 平滑化した値幅: 各バーの高値と安値の差をHull移動平均でならし、細かなノイズを抑えながら値動きの変化を捉えます。
• 固定または適応ファクター: 平滑化した値幅にBase Factorを掛けます。ATR適応をオンにすると、現在のATRと平均ATRの比率に合わせてファクターが動き、設定した上下限の範囲に収まります。
• トレーリングバンド: 上下のバンドは価格の後ろを一方向に追います。終値が反対側のバンドを抜けると、トレンド方向が切り替わります。
• 表示オフセット: ATRベースの距離で点線と開始マーカーをローソク足から離せます。変わるのは表示位置だけで、シグナルには影響しません。
STFの見方
• 価格の下にある緑の点線: 上昇トレンドです。押しがラインへどこまで近づいたかを確認できます。
• 価格の上にある赤の点線: 下降トレンドです。戻りがラインへ近づく場面も同じように見ます。
• 開始マーカー: 終値で方向転換が確定すると、丸印が新しいトレンドの始まりを示します。
• トレンドシェード: 価格とトレーリングラインの距離を薄い色で表示します。
価格とラインが一定の間隔を保ちながら同じ方向へ進むと、トレンドの流れがつかみやすくなります。価格が急にラインへ戻る場面では、直近の高値・安値やブレイク水準など、周辺の値動きも合わせて確認します。
Volume Sparks(出来高ハイライト)
出来高ハイライトは、各バーの出来高が設定した期間内でどの水準にあるかをパーセンタイルで表示します。固定値ではなく相対順位なので、銘柄や時間足が変わっても同じ考え方で使えます。
• Sparksモード: 出来高が設定したパーセンタイルを超えたバーだけを強調します。順位が高いほど明るくなります。
• Continuousモード: 薄い出来高レイヤーを常時表示し、順位に合わせて濃さを変えます。
• グラデーション: 点線の近くで最も濃く、価格へ向かって薄くなります。緑と赤はトレンド方向、明るさは出来高の強さを表します。
この表示が見ているのは出来高の活発さです。強く光ったバーは、そのローソク足と周辺の値動きと合わせて読みます。出来高がない、データがまばら、または出来高が変化しない銘柄では自動的に非表示になり、STFのトレンドラインはそのまま動作します。
基本の見方
1. 点線の色と位置から現在の方向を確認します。
2. 価格がラインから離れているか、ラインに沿っているか、ラインへ戻っているかを見ます。
3. 出来高ハイライトが強まったバーで、市場参加が増えた場所を確認します。
4. 方向転換では、終値確定のマーカーと周辺の価格構造を合わせて見ます。
5. 追いたいトレンドイベントに合わせてアラートを設定します。
Indicador

MA Trend Ribbon# MA Trend Ribbon
## Overview
MA Trend Ribbon is a trend-following overlay that sits directly on the price chart. It draws a band made of six moving-average lines stacked from fastest to slowest. The band fills with color to show whether the market is leaning up or down, and it prints clear BUY and SELL labels at the moments the trend flips. It can also read the entire ribbon from a higher timeframe, so a lower-timeframe chart can be traded in line with the broader trend. The goal is a single, easy-to-read picture of trend direction and the points where that direction changes.
## What It Shows
- **The ribbon** — six moving averages of increasing length, drawn together as a colored band. When the band tilts and expands upward the trend is up; when it rolls over and expands downward the trend is down. A band that pinches flat signals a market with little direction.
- **The color** — the entire ribbon turns one color for an up-trend and another for a down-trend, so direction reads at a glance without studying the individual lines.
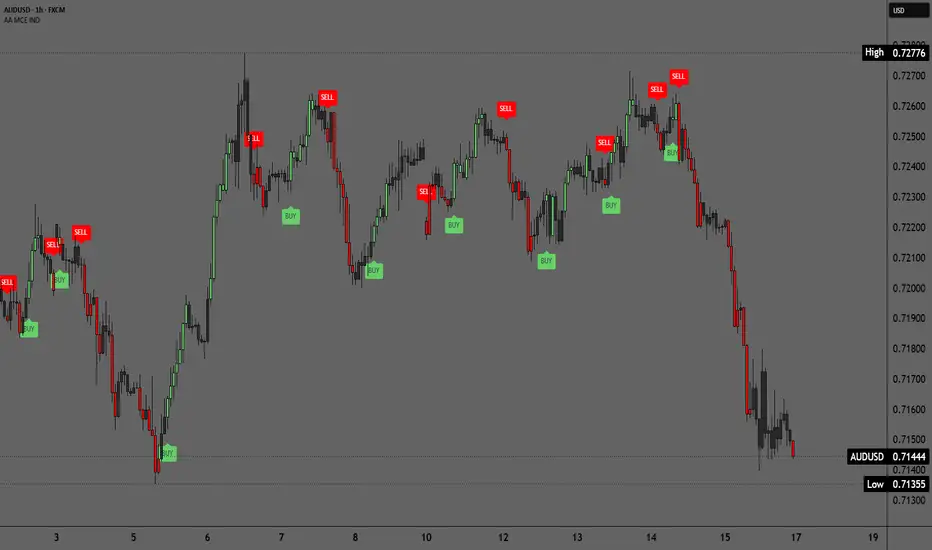
- **The labels** — a BUY label marks the bar where the trend turns up, and a SELL label marks the bar where the trend turns down. By default the labels ride the ribbon itself, sitting just outside the band; they can instead be pinned to the price candles. A label always appears on the same bar the ribbon changes color, so the two never disagree.
- **Optional bar coloring** — price bars can be tinted to match the trend for an even faster read.
- **Alerts** — built-in alerts announce each new BUY and SELL so the chart does not have to be watched constantly.
## The Structure Timeframe
The ribbon can be calculated on a timeframe other than the one being viewed. Left blank, it simply uses the chart's own timeframe. Set to a higher timeframe, the whole ribbon — its lines, its color, and its signals — is drawn from that broader view and displayed on the current chart. This makes it possible to watch a fast chart while keeping every reading aligned to a slower, more meaningful trend.
Two things are worth knowing when a higher timeframe is selected. The ribbon will look stepped, because each higher-timeframe value holds flat across the smaller bars until the larger bar completes. And the most recent portion can shift while the current higher-timeframe bar is still forming, settling once that bar closes; the confirm-on-close option keeps alerts from acting before it settles.
## How Direction Is Decided
The ribbon offers two ways to define the trend, chosen from a single setting:
- **Ribbon Flip** — the trend is up while the fastest line sits above the slowest line, and down when it drops below. This waits for the whole ribbon to turn over, giving steadier, less frequent signals.
- **Fastest MA Slope** — the trend is up the moment the fastest line starts rising and down the moment it starts falling. This reacts earlier and produces more signals.
Whichever method is selected controls both the ribbon color and the labels, keeping the visual and the signals in step.
## Choice of Averages
The ribbon is not limited to one style of average. A dropdown selects the type used for all six lines, ranging from smooth-and-steady to fast-and-reactive. Smoother types change direction later but hold trends more calmly. Faster types change direction sooner but shift more often. Because every line uses the same base length regardless of the type chosen, the base length usually deserves a fresh look after switching types, since the same number behaves differently from one average to the next.
The default type is volume-weighted, which leans on the bars that trade the most. On symbols whose data feed does not carry real volume, a volume-weighted average may behave unpredictably; on those markets one of the price-only types is the better choice.
## Optional Polish
Two extra touches can be switched on to make trends easier to judge, and both are off by default so the standard look stays clean:
- **Momentum-scaled ribbon** — the fill grows more solid as the band expands during a strong trend and fades as it compresses in a quiet market, so strong moves stand out and flat stretches recede.
- **Price-to-ribbon fill** — a soft shade fills the gap between price and the ribbon, making pullbacks toward the band easy to spot.
---
## User Inputs
### Structure
- **Structure Timeframe** — the timeframe the entire ribbon is calculated on. Blank uses the chart's own timeframe. A higher selection draws that higher timeframe's ribbon and signals on the current chart. Default is blank.
### Moving Average
- **Source** — the price used for the calculation. Default is the closing price. Other choices include the open, high, low, or an average of these.
- **MA Type** — the style of average used for every line in the ribbon. Ten options are available, from the smoothest and steadiest to the fastest and most reactive: Simple, Exponential, Weighted, Hull, Wilder's, Volume-Weighted, Double Exponential, Triple Exponential, Arnaud Legoux, and Least Squares. Default is Volume-Weighted.
- **Base MA Length** — the length of the fastest line in the ribbon. Smaller values make the whole ribbon quicker to react; larger values make it slower and smoother. Default is 40.
- **Ribbon Spacing** — the amount added to each line's length as the ribbon steps from fastest to slowest. Smaller values pack the six lines into a tight band; larger values spread them apart so the band widens and narrows more dramatically. Default is 8.
### Advanced MA Inputs
These settings apply only to specific average types and are ignored by the rest.
- **ALMA Offset** — applies only when the Arnaud Legoux type is selected. Higher values make that average track price more closely; lower values make it smoother. Default is 0.85.
- **ALMA Sigma** — applies only when the Arnaud Legoux type is selected. Larger values produce a smoother line; smaller values follow price more closely. Default is 6.
- **LSMA Offset** — applies only when the Least Squares type is selected. Shifts that line forward or backward by a set number of bars. Default is 0.
### Signals
- **Signal Trigger** — chooses how the trend is defined, either Ribbon Flip (steadier, later) or Fastest MA Slope (earlier, more frequent). Default is Ribbon Flip.
- **Show Buy/Sell Labels** — turns the BUY and SELL labels on or off. Default is on.
- **Label Position** — chooses where labels sit. Ribbon attaches them to the band, just below the lowest line for a buy and just above the highest for a sell, so they travel with the ribbon. Bar pins them to the candles instead, below the low for a buy and above the high for a sell. Default is Ribbon.
- **Label ATR Offset** — sets how far a label sits from the ribbon in Ribbon mode, scaled to recent price movement so the gap stays consistent in calm and volatile markets. A value of zero places the label right on the band; larger values push it further away. Has no effect in Bar mode. Default is 0.5.
- **Color Bars By Trend** — tints the price bars to match the current trend color. Default is off.
- **Confirm Signals On Bar Close** — when on, alerts wait until a bar has fully closed before firing, so a signal cannot appear and then disappear before the bar finishes. Labels still show while the bar is forming. Default is on.
### Style
- **Bullish Color** — the color of the ribbon and labels during an up-trend.
- **Bearish Color** — the color of the ribbon and labels during a down-trend.
- **Ribbon Fill Transparency** — how see-through the shaded band is, from solid to invisible. Default is 78.
- **Ribbon Line Width** — the thickness of each ribbon line. Default is 1.
- **Label Size** — the text size of the BUY and SELL labels, from tiny to large. Default is Normal.
### Visual Polish
- **Momentum-Scaled Ribbon** — when on, the fill grows more solid as the ribbon expands and fades as it compresses, so trend strength is reflected in the shading. Default is off.
- **Strong-Trend Fill Transparency** — the solidity of the fill at full ribbon expansion when the scaling above is on. Lower is more solid. Default is 38.
- **Momentum Normalization Length** — how many bars are used to judge how wide the ribbon is now compared with its recent range. Shorter values react faster to changes in strength; longer values give a steadier scale. Default is 100.
- **Fill Price To Ribbon** — shades the gap between price and the ribbon to highlight pullbacks. Default is off.
- **Price Fill Transparency** — how subtle that price-to-ribbon shading is. Higher is fainter. Default is 88.
---
## Best Use
The ribbon works best as a trend filter rather than a stand-alone entry system. Trends are followed most cleanly when trades lean in the direction of the ribbon color, using the labels to mark the turning points. Reading the ribbon from a higher Structure Timeframe while entering on a faster chart is a natural way to keep trades aligned with the larger trend. In quiet, sideways markets the ribbon will change color back and forth and produce more frequent, less reliable signals; the Ribbon Flip setting and a wider spacing reduce this, at the cost of later entries. Faster average types and tighter spacing suit active, short-term charts, while smoother types and wider spacing suit calmer, longer-term views. Indicador

Dynamic Grid Indicator [BigBeluga]🔵 OVERVIEW
The Dynamic Grid Indicator is an advanced technical indicator created by BigBeluga to map volatility-based grid channels across price charts while simultaneously plotting a synchronized multi-level oscillator pane. Traditional envelope indicators often use static standard deviation bands that fail to adjust to shifting trend momentum or localized price congestion. In order to provide a solution to this problem, this indicator combines a Hull Moving Average (HMA) central baseline with Average True Range (ATR) multiplier steps, automatically fading channel lines and generating precise crossover signals when price interacts with structural grid borders.
The indicator aims to visualize volatility expansion, compression, and overextended momentum zones. The core element of its calculation involves measuring price distance from the central baseline scaled by volatility steps defined as:
centerLine = ta.hma(close, hmaLength)
oscValue = atrVal != 0 ? (close - centerLine) / atrVal : 0.0
where centerLine acts as the adaptive trend anchor, and oscValue normalizes deviations into standardized grid units. Higher values of numLevels and ATR multipliers allow the indicator to filter out localized market noise and isolate major overbought or oversold structural extremes.
🔵 FEATURES
The system utilizes a multi-layered matrix structure to provide actionable market intelligence:
1 — Dynamic HMA & ATR Grid Engine
Central Baseline Momentum: Tracks trend direction and baseline elasticity using customizable Hull Moving Average lengths via ta.hma(close, hmaLength)
Volatility Multiplier Steps: Projects up to 5 multi-tiered grid levels above and below the baseline scaled dynamically by ATR volatility.
2 — Proximity Fade & Edge Label Management
Smart Proximity Hiding: Automatically hides chart grid line segments when price approaches a level within a set percentage threshold using diff <= proxDist .
Right-Edge Price Tags: Automatically renders live numerical price tags and oscillator labels on the right edge of the chart using custom label management functions.
3 — Synchronized Oscillator Pane & Position Dashboard
Multi-Level Oscillator Fill: Projects a synchronized sub-pane oscillator complete with gradient fills and crossover signal annotations.
Position Scale Dashboard: Features an interactive table displaying real-time level states and oscillator positioning across the grid.
🔵 HOW TO USE
Apart from the basic visualization of volatility channels, this tool can also act in alternative ways to support decision-making:
Identify Channel Extremes: Monitor the outer grid levels (+3 to +5 / -3 to -5) to spot overextended market conditions where price is likely to revert or consolidate.
Trade Grid Crossovers: Look for confirmed crossover signals and direction labels (▲/▼) when price breaks across key grid boundaries to catch trend continuations.
Track Momentum via Oscillator: Observe the sub-pane oscillator line and gradient fill to gauge the strength of the current move relative to the volatility baseline.
🔵 NOTES
Why this implementation is unique:
It combines an overlay price grid with a synchronized, volatility-normalized oscillator pane in a single unified script.
The proximity fade engine keeps the chart clean by automatically removing line clutter directly under active price action.
The script is fully optimized for Pine Script version 6, utilizing advanced conditional plotting, multi-timeframe safety filters, and dynamic dashboard tables.
Indicador

Adaptive T3 Hull [BackQuant]Adaptive T3 Hull
Overview
Adaptive T3 Hull is a configurable trend-following overlay that combines the lag-compensation structure of a Hull-style moving average with T3 smoothing and several optional mechanisms designed specifically to control overshoot, hooks and oscillating tails.
A conventional Hull construction gains responsiveness by comparing a faster and slower smoother, extrapolating their difference, and then smoothing the result again. This can produce a very responsive trend estimate, but the same lag compensation responsible for that responsiveness can also create exaggerated curvature around sharp reversals.
Adaptive T3 Hull makes that trade-off directly controllable.
The indicator replaces the traditional weighted-moving-average Hull stages with T3 smoothers and expands the basic Hull architecture with:
Adjustable fast/slow length relationships.
Adjustable Hull lag compensation.
Configurable final smoothing geometry.
Curvature-sensitive tail damping.
Optional asymmetric damping around turns.
An adaptive T3 volume factor.
An optional ATR-based velocity limiter.
Optional final lag compensation.
Trend-strength-dependent ribbon intensity.
Tail and curvature diagnostics in the Data Window.
The result is not intended to reproduce a standard HMA exactly. It is a generalized Hull-style framework in which the user can explicitly control the balance between responsiveness, smoothness and overshoot.
Core idea
Most trend smoothers face the same fundamental compromise:
More smoothing reduces noise but increases lag.
More lag compensation improves responsiveness but can create overshoot.
The Hull concept addresses lag by comparing a fast smoother with a slower smoother and projecting the difference forward.
A generalized form can be written as:
Hull Raw = Fast + Compensation × (Fast - Slow)
If Compensation is zero:
Hull Raw = Fast
No additional lag compensation is applied.
If Compensation is one:
Hull Raw = 2 × Fast - Slow
This reproduces the familiar compensation structure used in the standard Hull Moving Average.
Values between zero and one provide partial compensation.
Adaptive T3 Hull defaults to a substantially smaller compensation value. This is deliberate. It reduces the tendency for the projected line to extend beyond the fast smoother during sharp changes in direction.
The remaining responsiveness can then be controlled using the fast-length ratio, T3 characteristics and optional final generalization rather than relying entirely on aggressive Hull extrapolation.
Processing chain
The complete indicator can be understood as the following sequence:
Select the source and main Hull Length.
Derive a fast T3 length from the Fast Length Ratio.
Derive a final smoothing length from a configurable power-law relationship.
Calculate fast and slow T3 smoothers.
Measure velocity and curvature of the fast T3.
Normalize curvature using ATR.
Optionally reduce the active T3 Volume Factor during high curvature.
Recalculate the fast and slow T3 legs with the adaptive factor.
Measure the active curvature state.
Optionally reduce Hull compensation when curvature increases.
Construct the compensated fast-minus-slow T3 Hull.
Smooth that result through another T3 stage.
Optionally apply a final generalized lag-compensation stage.
Optionally limit extreme one-bar movement using ATR.
Determine trend from the final line slope.
Build a smoothed one-bar-offset ribbon around the result.
Each stage affects a different part of the lag-versus-overshoot problem.
T3 smoothing
The T3 is a multi-stage recursive smoother constructed from a sequence of exponential moving averages.
The script calculates six EMA stages:
E1 = EMA(Source)
E2 = EMA(E1)
E3 = EMA(E2)
E4 = EMA(E3)
E5 = EMA(E4)
E6 = EMA(E5)
Those stages are then combined using coefficients derived from the T3 Volume Factor.
The final T3 has the general form:
T3 = C1×E6 + C2×E5 + C3×E4 + C4×E3
where C1 through C4 change with the Volume Factor.
This construction allows T3 smoothing to maintain substantial smoothness while using coefficient-based compensation to reduce some of the lag created by repeated EMA filtering.
Important: T3 Volume Factor does not use trading volume
Despite its name, the T3 Volume Factor is not calculated from market volume.
It is a coefficient controlling the internal T3 response.
Changing it does not incorporate:
Exchange volume.
Volume profile.
OBV.
Money flow.
It changes how aggressively the internal EMA stages are combined.
Higher values generally increase compensation and responsiveness, but can also increase overshoot.
Lower values generally produce a more restrained and smoother response.
This relationship is particularly important in this indicator because Hull compensation and T3 compensation can interact.
An aggressive T3 followed by aggressive Hull extrapolation can produce substantially more tail behaviour than either technique alone.
Why combine T3 and Hull logic?
Hull-style smoothing and T3 smoothing approach lag reduction differently.
The Hull architecture uses:
A fast smoother.
A slow smoother.
The difference between them.
A final smoothing stage.
T3 uses:
Multiple recursive EMA stages.
A coefficient-controlled combination of those stages.
Adaptive T3 Hull combines both ideas.
Instead of:
Fast WMA.
Slow WMA.
Final WMA.
the indicator uses:
Fast T3.
Slow T3.
Compensated difference.
Final T3.
This produces a smoother underlying structure while retaining the ability to compensate for lag.
However, combining two lag-reduction mechanisms also makes overshoot control more important. Much of the indicator is therefore devoted to regulating that compensation dynamically.
Hull Length
Hull Length establishes the main smoothing horizon.
It is used to derive:
The slow T3 length.
The fast T3 length.
The final smoothing length.
Lower values:
React more quickly.
Track shorter trend changes.
Increase sensitivity to local curvature.
Can generate more frequent directional flips.
Higher values:
Produce broader trend estimates.
Reduce short-term variation.
Increase response delay.
Generally produce more persistent regimes.
Unlike a standard HMA, the relationship between these three smoothing stages is not fixed.
Fast Length Ratio
The fast T3 length is calculated as:
Fast Length = Hull Length × Fast Length Ratio
with the result rounded to a valid integer.
In a conventional Hull structure, the fast stage normally uses approximately half the main length.
Therefore:
Fast Length Ratio = 0.50
reproduces the familiar half-length relationship.
The default configuration uses a larger ratio, making the fast leg closer in length to the slow leg.
This matters because the difference:
Fast T3 - Slow T3
is the quantity used for lag compensation.
If the fast and slow stages are very different:
Their separation can become larger.
Hull compensation becomes stronger.
The resulting line can react faster.
Overshoot potential increases.
If their lengths are closer:
Their separation becomes smaller.
The compensation term becomes more restrained.
The final line generally becomes smoother.
Fast Length Ratio is therefore another direct control over the aggressiveness of the Hull projection.
Hull Compensation
Hull Compensation controls how much of the fast-versus-slow difference is added back to the fast T3.
The underlying formula is:
Hull Raw = Fast T3 + Effective Compensation × (Fast T3 - Slow T3)
Before adaptive damping is applied, Effective Compensation begins from the Hull Compensation input.
Compensation = 0
The raw line becomes the fast T3 itself.
No Hull-style extrapolation occurs.
Compensation = 1
The calculation becomes:
2 × Fast T3 - Slow T3
which matches the standard Hull lag-compensation form.
Compensation between 0 and 1
Only part of the fast-slow separation is extrapolated.
This creates a middle ground between:
Pure fast smoothing.
Full Hull compensation.
Compensation above 1
The difference is extrapolated even more aggressively than a conventional Hull construction.
This can create a highly responsive line, but it also increases the likelihood of:
Overshoot.
Hooks.
Large tails after sharp turns.
The default is intentionally conservative relative to a standard Hull.
What are Hull tails?
Hull-style moving averages can develop a distinctive oscillating or hooked appearance around strong reversals.
This occurs because the lag-compensation term is effectively extrapolating the difference between two smoothers.
Imagine the fast smoother accelerating upward while the slow smoother is still catching up.
The difference:
Fast - Slow
becomes positive.
Adding that difference to the fast smoother projects the result even further upward.
When price abruptly reverses, the fast smoother begins turning first while the slow smoother remains elevated.
The compensation term can then change rapidly and cause the completed Hull to:
Extend beyond the fast line.
Hook sharply.
Reverse with excessive curvature.
This is not necessarily an error in the Hull formula. It is a consequence of aggressive lag compensation.
Adaptive T3 Hull includes several independent tools for reducing this behaviour.
Final Hull smoothing
After the fast and slow T3 legs are combined, the raw Hull is smoothed again.
The final smoothing length is calculated from:
Length^Hull Smoothing Exponent × Final Smoothing Multiplier
This generalizes the standard Hull square-root stage.
A conventional HMA normally uses approximately:
sqrt(Length)
which is equivalent to:
Length^0.50
before rounding.
Hull Smoothing Exponent
The Hull Smoothing Exponent controls how strongly the final smoothing length grows as the main Hull Length increases.
Exponent = 0.50
Reproduces the square-root relationship used in the conventional Hull construction.
Exponent below 0.50
Produces a shorter final smoothing stage, particularly at larger main lengths.
This generally:
Increases responsiveness.
Allows more of the compensated movement through.
Exponent above 0.50
Creates a longer final smoothing stage.
This generally:
Reduces local variation.
Smooths more aggressively.
Adds response delay.
The script allows this relationship to be generalized instead of forcing the standard square-root rule.
Final Smoothing
Final Smoothing applies an additional multiplier to the derived root length:
Final Length = Length^Exponent × Root Multiplier
This gives a second level of control over the final stage without changing the underlying power-law relationship.
Higher values:
Increase final smoothing.
Reduce local hooks.
Slow the line.
Lower values:
Decrease final smoothing.
Increase responsiveness.
Allow more short-term curvature through.
The Smoothing Exponent controls how smoothing scales with Hull Length.
The Final Smoothing multiplier controls the overall magnitude of that final stage.
Curvature measurement
Adaptive tail damping requires a way to determine when the fast T3 is changing direction unusually quickly.
The indicator first calculates velocity:
Velocity = Fast T3 - Previous Fast T3
Previous velocity is:
Previous Velocity = Previous Fast T3 - Fast T3 two bars ago
Curvature is then approximated as the absolute change in velocity:
Curvature = |Velocity - Previous Velocity|
This is a discrete second-difference concept.
Velocity describes how quickly the smoother is moving.
Curvature describes how quickly that velocity itself is changing.
For example:
A steadily rising line can have positive velocity but low curvature.
A line suddenly flattening after a strong rise can have high curvature.
A sharp reversal can produce very high curvature.
This makes curvature particularly useful for detecting the conditions in which Hull overshoot tends to appear.
ATR normalization
Raw curvature is not directly comparable across instruments.
A $10 curvature movement is enormous for one market and negligible for another.
The script therefore normalizes curvature using ATR:
Normalized Curvature = Curvature / ATR
The result is capped at 1.
This creates an adaptive pressure measure between approximately:
0 = little curvature relative to recent range.
1 = very large curvature relative to recent range.
ATR is calculated using the Damping Normalization length.
This normalized curvature drives several optional adaptive mechanisms.
Damping Normalization
Damping Normalization controls the ATR period used when converting curvature into a relative value.
Short values:
Make the normalization respond rapidly to current volatility.
Allow damping pressure to change quickly.
Longer values:
Create a more stable volatility baseline.
Reduce rapid changes in normalized curvature.
This setting does not smooth the final T3 Hull directly.
It changes how the adaptive systems interpret curvature.
Adaptive Tail Damping
Adaptive Tail Damping dynamically reduces Hull Compensation when curvature becomes large.
The process can be summarized as:
Effective Compensation = Hull Compensation × (1 - Damping Pressure × Damping Strength)
When curvature is low:
Damping Pressure approaches zero.
Effective Compensation remains close to the selected Hull Compensation.
When curvature becomes large:
Damping Pressure increases.
Effective Compensation is reduced.
This means the indicator deliberately removes some of its lag compensation precisely when the fast T3 is bending sharply.
Why reduce compensation during curvature?
Hull compensation is most useful when the fast and slow smoothers are moving consistently in the same directional structure.
During a smooth trend:
The fast line leads the slow line.
Their separation can be used to reduce lag.
During a sharp turn:
The fast line may reverse before the slow line.
Their separation can become a poor estimate of useful forward compensation.
Extrapolating the full difference can create overshoot.
Adaptive damping therefore treats high curvature as a reason to trust the Hull extrapolation less.
Damping Strength
Damping Strength determines how much curvature can reduce Hull compensation.
At zero:
Curvature has no effect on compensation.
As the value increases:
High-curvature events remove progressively more compensation.
The line becomes more restrained around sharp turns.
At a Damping Strength of 1 and maximum normalized curvature, compensation can theoretically be reduced all the way toward zero.
This does not stop the underlying T3 from moving.
It removes the additional Hull extrapolation.
Asymmetric Turn Damping
By default, curvature damping can apply whenever the fast T3 experiences significant curvature.
Asymmetric Turn Damping makes the condition more selective.
When enabled, damping pressure is only applied when the current velocity is moving against the previous directional pace.
Conceptually:
A previously rising fast T3 is damped when its upward velocity begins weakening or reversing.
A previously falling fast T3 is damped when its downward velocity begins weakening or reversing.
This allows strong acceleration in the existing direction to retain more compensation while focusing the damping mechanism around deceleration and turning behaviour.
The purpose is to distinguish:
Curvature caused by trend acceleration.
Curvature caused by trend exhaustion or reversal.
This can preserve responsiveness during strong continuation while still suppressing tails around turns.
Adaptive T3 Volume Factor
Adaptive T3 Volume Factor provides a second curvature-sensitive damping mechanism.
Instead of changing the Hull compensation, this feature changes the internal T3 coefficient itself.
The active factor is approximately:
Active VF = Base VF × (1 - Normalized Curvature × VF Damping Strength)
subject to the configured minimum.
When curvature is low:
Active VF remains near the selected T3 Volume Factor.
When curvature rises:
Active VF is reduced.
The T3 becomes less aggressively compensated.
This attacks overshoot earlier in the processing chain.
Hull damping versus VF damping
The two mechanisms affect different stages.
Adaptive Tail Damping
changes how much:
Fast T3 - Slow T3
is extrapolated.
Adaptive T3 Volume Factor
changes how the T3 smoothers themselves are constructed.
Using both means curvature can reduce:
The aggressiveness of each T3 leg.
The aggressiveness of the Hull compensation between those legs.
This can strongly suppress tails but may also reduce responsiveness.
The controls are therefore optional and independently adjustable.
VF Damping Strength
VF Damping Strength controls how strongly curvature reduces the T3 Volume Factor.
Higher values:
Produce larger reductions during sharp curvature.
Increase smoothing around turns.
Can reduce T3 overshoot more aggressively.
Lower values:
Keep Active VF closer to the base setting.
Preserve more of the original T3 response.
Minimum VF
Minimum VF prevents the adaptive mechanism from reducing the active coefficient indefinitely.
It defines the lower bound used when Adaptive T3 Volume Factor is active.
This keeps the filter within a controlled response range during extreme curvature.
If the selected base Volume Factor is already below the requested minimum, the script does not force it upward above the base value.
Generalize Final Hull
Generalize Final Hull adds another optional lag-compensation stage after the main T3 Hull has already been completed.
A second smoothed version of the completed Hull is calculated.
The final target then becomes:
Hull Target = Hull Base + Generalization × (Hull Base - Second Hull)
This uses the same broad idea as Hull compensation:
Compare a faster estimate with a slower version.
Add part of their difference back to the faster estimate.
At zero Generalization:
The stage has no effect.
As Generalization increases:
The final result becomes more responsive.
Lag is reduced further.
Overshoot potential increases.
This option exists because the earlier tail controls allow the user to reduce aggressive compensation in the main Hull construction and, if desired, reintroduce a smaller amount of controlled responsiveness at the end.
Generalization
Generalization controls the amount of final compensation.
Lower values create subtle lag reduction.
Higher values increasingly extrapolate the difference between the first and second completed Hull smoothers.
This feature should be considered one of the more aggressive responsiveness controls in the indicator.
If the objective is maximum tail suppression, it can be left disabled.
Velocity Limiter
The Velocity Limiter addresses a different problem.
Curvature damping changes how the line is calculated.
The Velocity Limiter places a direct cap on how far the completed line is allowed to move in one bar.
The maximum permitted movement is:
Maximum Step = ATR × Max ATR / Bar
The desired change is:
Delta = Hull Target - Previous T3 Hull
That change is clamped between:
-Maximum Step
+Maximum Step
The final T3 Hull then advances by only the permitted amount.
Why use a velocity limiter?
Occasionally, a large price shock or a combination of aggressive settings can cause the completed Hull target to jump sharply.
The limiter acts as a final mechanical speed limit.
It can reduce:
Single-bar jumps.
Extreme hooks.
Shock-driven movement.
However, this comes with a clear trade-off.
If the market genuinely reprices very quickly, the limiter deliberately prevents the trend line from following the full move immediately.
It therefore introduces controlled lag.
Max ATR / Bar
This setting determines the maximum permitted single-bar movement in ATR units.
For example:
0.35 allows the completed line to move by no more than 0.35 ATR in one bar.
Lower values:
Create stronger movement suppression.
Produce smoother transitions.
Can significantly delay response to genuine breaks.
Higher values:
Interfere less often.
Allow larger legitimate moves.
The limiter is disabled by default because it is a strong constraint.
How the tail controls work together
The script provides several different ways to reduce tail behaviour because overshoot can originate at multiple stages.
Fast Length Ratio
Reduces fast-versus-slow separation.
Hull Compensation
Directly controls extrapolation of that separation.
Final Smoothing
Smooths the compensated output more heavily.
Adaptive Tail Damping
Reduces Hull compensation during curvature.
Asymmetric Turn Damping
Restricts that damping mainly to deceleration and turning behaviour.
Adaptive T3 Volume Factor
Makes the underlying T3 calculations more conservative during curvature.
Velocity Limiter
Caps the final single-bar movement.
Generalization
Moves in the opposite direction by optionally adding some final lag compensation back.
These controls are intentionally modular.
A user does not need to enable all of them.
Default design philosophy
The default settings intentionally do not reproduce a standard Hull Moving Average.
A standard Hull-like configuration would approximately use:
Fast Length Ratio near 0.50.
Hull Compensation near 1.00.
Hull Smoothing Exponent near 0.50.
Final Smoothing near 1.00.
The default Adaptive T3 Hull uses a much more restrained compensation structure.
This shifts the design away from maximum lag cancellation and toward smoother trend tracking with reduced tail behaviour.
The advanced controls then allow users to progressively move the model toward either:
More responsiveness.
More stability.
Trend determination
Trend direction is determined directly from the slope of the completed T3 Hull.
If:
Current T3 Hull > Previous T3 Hull
the direction becomes bullish.
If:
Current T3 Hull < Previous T3 Hull
the direction becomes bearish.
If the line is unchanged:
The previous state persists.
The trend does not depend on price crossing the line.
It depends on whether the adaptive T3 Hull itself is rising or falling.
Long and short signals
A long signal occurs when direction changes into the bullish state.
A short signal occurs when direction changes into the bearish state.
The markers therefore identify:
A change in slope regime.
They do not represent:
Guaranteed entries.
Price targets.
Stop levels.
Because the signal is based on local slope, more responsive configurations will naturally produce more flips during sideways conditions.
Ribbon construction
The optional band is not a conventional upper-and-lower volatility channel.
The main line is the current T3 Hull.
The secondary ribbon reference is calculated from a smoothed version of the previous-bar T3 Hull :
Ribbon Reference = WMA(T3 Hull , Band Smoothing)
The area between these two lines is filled with a gradient.
This creates visual separation between:
The current adaptive trend estimate.
A delayed and smoothed reference to its prior values.
The band therefore functions as a trend ribbon rather than a statistical volatility envelope.
Band Smoothing
Band Smoothing controls the WMA applied to the one-bar-offset Hull series.
Lower values:
Keep the ribbon reference close to the main line.
Produce a tighter band.
Respond quickly to direction changes.
Higher values:
Create a slower reference.
Widen the visual separation during sustained movement.
Create a smoother ribbon.
This input affects the visualization only.
It does not change:
The T3 Hull calculation.
Trend direction.
Signals.
Trend Strength
The indicator also calculates a normalized trend-velocity measure for visualization.
Raw strength is based on:
|Current T3 Hull - Previous T3 Hull| / ATR
and is multiplied by the Strength Sensitivity input.
The result is capped at 1 and then smoothed with an EMA.
This produces a normalized value from approximately:
0 = very little line movement relative to ATR.
1 = strong line movement relative to ATR.
This is a measure of trend-line velocity , not a statistical probability that the trend will continue.
Strength Smoothing
Strength Smoothing controls how quickly the visual strength estimate changes.
Lower values:
React quickly to acceleration and deceleration.
Create faster ribbon-intensity changes.
Higher values:
Produce steadier strength visualization.
Reduce flickering in the gradient.
It does not affect the underlying trend calculation.
Strength Sensitivity
Strength Sensitivity determines how quickly line velocity reaches the maximum normalized strength.
Higher values:
Cause smaller ATR-normalized movement to appear strong.
Increase gradient intensity more easily.
Lower values:
Require greater movement before maximum visual intensity is reached.
Strength-Weighted Gradient
When disabled, the ribbon uses a fixed gradient transparency.
When enabled, gradient intensity changes with Trend Strength.
As the T3 Hull moves more quickly relative to ATR:
The near portion of the ribbon becomes more visible.
The broader gradient becomes stronger.
When trend velocity is weak:
The ribbon becomes more subdued.
This is purely a visualization feature.
It does not alter:
Direction.
Signals.
Smoothing.
Tail damping.
Trend candles
The indicator can recolor the main chart candles according to the active T3 Hull slope state.
Bullish trend = selected Long Color.
Bearish trend = selected Short Color.
The candle colour describes the indicator regime, not the individual candle’s own open-to-close direction.
A bearish candle can therefore remain bullish-coloured while the T3 Hull is still rising.
Tail diagnostics
Several internal values are exposed in TradingView’s Data Window.
These provide insight into how the adaptive model is currently behaving.
Effective Hull Compensation
Shows the compensation actually being used after adaptive tail damping.
If adaptive damping is disabled:
It remains equal to Hull Compensation.
If damping is active:
It falls below the base value when curvature pressure increases.
This is useful for seeing when the indicator is automatically becoming more conservative.
Active T3 Volume Factor
Shows the T3 coefficient currently being used.
If Adaptive T3 Volume Factor is disabled:
It remains equal to the base Volume Factor.
When enabled:
It can decrease during high curvature.
Normalized Curvature
Shows the current curvature estimate after ATR normalization.
Values closer to 1 represent greater changes in fast-T3 velocity relative to recent range.
Trend Strength
Shows the smoothed normalized T3 Hull velocity as a percentage.
This is the same quantity used by the optional Strength-Weighted Gradient.
Tail Overshoot
The script also measures whether the final T3 Hull has extended beyond the fast T3 in the direction of the fast/slow separation.
An upper overshoot occurs when:
Fast T3 is above Slow T3.
Completed T3 Hull is above Fast T3.
A lower overshoot occurs when:
Fast T3 is below Slow T3.
Completed T3 Hull is below Fast T3.
When this happens, Tail Overshoot reports:
|T3 Hull - Fast T3| / ATR
This expresses the size of the overshoot in ATR units.
A value of zero means the completed Hull is not currently beyond the fast T3 under that definition.
This diagnostic is particularly useful when tuning:
Hull Compensation.
Damping Strength.
Fast Length Ratio.
Adaptive VF.
Final Smoothing.
Generalization.
How to interpret the indicator
Rising T3 Hull
A rising line indicates a bullish trend state.
The model’s completed combination of T3 smoothing, Hull compensation and any active damping controls is moving upward.
Falling T3 Hull
A falling line indicates a bearish trend state.
Smooth persistent slope
A stable slope with few direction changes generally indicates a cleaner trend environment for this style of filter.
Frequent colour changes
Rapid bullish/bearish transitions generally indicate:
Sideways price action.
A very responsive configuration.
Insufficient smoothing for the current market.
High normalized curvature
High curvature means the fast T3’s velocity is changing rapidly relative to ATR.
If adaptive controls are enabled, this is where:
Hull compensation may decrease.
T3 Volume Factor may decrease.
High tail overshoot
A larger Tail Overshoot value indicates the completed Hull has moved materially beyond the fast T3.
If the objective is a less tail-heavy line, possible adjustments include:
Reduce Hull Compensation.
Increase Final Smoothing.
Increase Fast Length Ratio.
Increase Damping Strength.
Enable Adaptive T3 Volume Factor.
Reduce or disable Generalization.
Enable the Velocity Limiter.
How to use the indicator
1. Trend regime filter
The most direct use is as a slope-based regime filter:
Rising T3 Hull = bullish trend state.
Falling T3 Hull = bearish trend state.
This can be combined with independent entry logic.
2. Trend transition signals
Long and short markers identify when the adaptive line changes slope direction.
These can be used as:
Regime-change alerts.
Confirmation for another setup.
Potential trailing-exit conditions.
They are not standalone guarantees of a sustained reversal.
3. Pullback reference
During a persistent trend, the T3 Hull can act as a smoothed directional reference.
Price returning toward the line while the line continues to slope in the original direction may represent a pullback within the existing regime.
4. Ribbon expansion
The distance between the current T3 Hull and its delayed WMA reference can visually highlight persistent movement.
A stronger ribbon separation can occur when the current adaptive trend estimate is moving away from its delayed historical reference.
5. Tail tuning
The Data Window diagnostics allow the indicator to be treated as a filter-design tool.
Users can observe:
When compensation is being damped.
How strongly curvature is elevated.
Whether the completed line is overshooting.
How the active T3 coefficient changes.
This can make parameter changes easier to understand than tuning solely by appearance.
Suggested tuning approaches
Smooth / reduced-tail configuration
For a calmer trend line:
Use lower Hull Compensation.
Use a larger Fast Length Ratio.
Increase Final Smoothing.
Enable Adaptive Tail Damping.
Use moderate or higher Damping Strength.
Leave Generalization disabled.
If strong shocks still create large movements:
Enable the Velocity Limiter.
Responsive configuration
For faster behaviour:
Reduce Fast Length Ratio toward the traditional half-length relationship.
Increase Hull Compensation.
Reduce Final Smoothing.
Reduce the Hull Smoothing Exponent.
Use a more aggressive T3 Volume Factor.
These changes generally increase overshoot risk.
Adaptive configuration
For responsiveness in normal conditions with additional protection near turns:
Use moderate Hull Compensation.
Enable Adaptive Tail Damping.
Enable Asymmetric Turn Damping.
Optionally enable Adaptive T3 Volume Factor.
This allows stronger compensation during smooth directional movement while automatically reducing it when the line begins to decelerate or turn.
Maximum tail-control configuration
For very aggressive tail suppression:
Low Hull Compensation.
Higher Final Smoothing.
Adaptive Tail Damping enabled.
Higher Damping Strength.
Adaptive T3 Volume Factor enabled.
Generalization disabled.
Velocity Limiter enabled.
This can create a very stable line, but the cost is additional lag.
How this differs from a standard Hull Moving Average
A conventional HMA normally uses:
WMA at half length.
WMA at full length.
2 × Fast - Slow lag compensation.
Final WMA around sqrt(Length).
Adaptive T3 Hull changes every major part of that architecture:
T3 replaces WMA.
Fast Length Ratio is configurable.
Hull Compensation is configurable.
The final smoothing exponent is configurable.
Final smoothing has an additional multiplier.
Compensation can adapt to curvature.
T3 behaviour can adapt to curvature.
Final movement can be ATR-limited.
An additional generalized compensation stage can be enabled.
It is therefore better understood as a generalized adaptive Hull framework than as a conventional HMA with a different smoothing length.
How this differs from a normal T3
A standard T3 produces one smoothed price estimate from repeated EMA stages and a fixed Volume Factor.
Adaptive T3 Hull uses multiple T3 calculations in a Hull-style structure:
Fast T3.
Slow T3.
Compensated fast-slow projection.
Final T3 smoothing.
It can also dynamically alter the T3 factor according to curvature.
The T3 is therefore a building block inside the larger trend model.
How this differs from simply smoothing an HMA
Applying an additional moving average to an HMA can reduce its tails, but it also adds lag after the overshoot has already occurred.
Adaptive T3 Hull attacks the problem at several earlier stages.
It can:
Reduce the fast-slow separation.
Reduce compensation itself.
Reduce compensation specifically around sharp turns.
Reduce the T3 factor during curvature.
Change the final Hull smoothing geometry.
Limit extreme final movement.
This provides more control than applying one additional smoothing layer to a completed HMA.
Parameter interaction
Many settings interact strongly.
Fast Ratio + Hull Compensation
A low Fast Ratio creates greater separation between fast and slow legs.
Combining that with high Hull Compensation can produce aggressive extrapolation.
Hull Compensation + Adaptive Damping
Hull Compensation defines the maximum starting compensation.
Adaptive damping determines how much of it survives during curvature.
T3 Volume Factor + Hull Compensation
Both can contribute to lag reduction.
High values in both stages may amplify overshoot.
Final Smoothing + Generalization
Final Smoothing adds lag and stability.
Generalization removes some of that lag again.
Using both allows the user to create a smooth base and then selectively reintroduce responsiveness.
Adaptive VF + Adaptive Hull Damping
Both respond to curvature but at different stages.
Enabling both can create strong protection around turns.
Velocity Limiter + all other controls
The Velocity Limiter is applied near the end of the pipeline.
It can therefore override an aggressive target generated by the preceding calculations.
Input guide
Source
Price series used by the complete indicator.
Hull Length
Primary calculation horizon.
T3 Volume Factor
Controls the internal T3 coefficient structure. It does not use trading volume.
Hull Compensation
Controls how much of the fast-minus-slow T3 separation is added to the fast T3.
Final Smoothing
Multiplies the final Hull smoothing length.
Adaptive Tail Damping
Reduces Hull Compensation during high curvature.
Damping Strength
Controls the amount of compensation reduction.
Damping Normalization
ATR horizon used to normalize curvature.
Fast Length Ratio
Controls the fast T3 length relative to the main Hull Length.
Hull Smoothing Exponent
Controls the power-law relationship used to derive the final smoothing length.
Asymmetric Turn Damping
Restricts curvature damping primarily to deceleration and turning behaviour.
Adaptive T3 Volume Factor
Reduces the T3 coefficient during high curvature.
VF Damping Strength
Controls how strongly curvature reduces the active T3 factor.
Minimum VF
Limits how far the adaptive T3 factor can be reduced.
Velocity Limiter
Caps final one-bar T3 Hull movement using ATR.
Max ATR / Bar
Defines the maximum movement allowed by the Velocity Limiter.
Generalize Final Hull
Enables an additional lag-compensation stage after the main T3 Hull.
Generalization
Controls the strength of that final compensation.
Strength-Weighted Gradient
Allows ribbon intensity to vary with normalized T3 Hull velocity.
Strength Smoothing
Smooths the visual trend-strength measure.
Sensitivity
Controls how quickly ATR-normalized movement reaches maximum visual strength.
Band Smoothing
Controls the delayed WMA reference used to build the ribbon.
Strengths
Combines T3 smoothing with a generalized Hull framework.
Directly exposes Hull lag compensation as a user control.
Provides multiple independent methods for reducing oscillating tails.
Uses ATR-normalized curvature for adaptive behaviour.
Can distinguish general curvature from decelerating/turning curvature.
Can adapt the T3 coefficient as well as Hull compensation.
Allows the standard Hull square-root smoothing relationship to be generalized.
Includes an optional ATR-based velocity limiter.
Provides optional final lag compensation for advanced tuning.
Includes real-time tail and curvature diagnostics.
Provides trend-strength-reactive visualization without altering signals.
Limitations
The indicator remains a reactive trend filter rather than a predictive model.
Increasing lag compensation generally increases overshoot risk.
Aggressive tail suppression generally increases lag.
Slope-based signals can whipsaw in ranging markets.
The large number of controls creates many interacting parameter combinations.
Over-tuning parameters to one asset or historical period can reduce robustness elsewhere.
The Velocity Limiter can delay response to genuine price shocks.
Generalization can reintroduce overshoot that earlier damping stages removed.
Trend Strength measures line velocity, not probability of continuation.
Tail Overshoot is a diagnostic relative to the fast T3, not a trading signal.
Causality and real-time behaviour
The calculations use current and historical data without intentional future references.
The indicator can therefore be evaluated causally on completed bars.
However, on a live unfinished candle:
The source can change.
The T3 stages can change.
Curvature can change.
Adaptive compensation can change.
The final slope can change.
A long or short signal can appear or disappear before bar close.
Users requiring confirmed trend transitions should evaluate signals on completed candles.
Alerts
The indicator includes three alert conditions:
T3 Hull Long: the completed T3 Hull changes into a rising trend state.
T3 Hull Short: the completed T3 Hull changes into a falling trend state.
T3 Hull Signal: either directional transition occurs.
Summary
Adaptive T3 Hull is a generalized trend smoother built around the idea that Hull-style lag compensation does not need to be fixed.
The model begins with fast and slow T3 smoothers rather than traditional WMAs. Their difference is used to compensate the fast T3 for lag, but the amount of compensation is directly configurable.
This alone allows the user to move continuously between:
A restrained fast T3.
A partially compensated Hull structure.
A conventional 2×fast-minus-slow construction.
More aggressive extrapolation.
The final smoothing stage is also generalized. Instead of forcing the conventional square-root Hull relationship, the user can control both the smoothing exponent and a separate multiplier.
The adaptive systems then focus specifically on the behaviour that often makes Hull-style smoothers difficult to tune: oscillating tails around sharp turns.
The script measures changes in fast-T3 velocity, normalizes that curvature using ATR, and can use the result to:
Reduce Hull compensation.
Reduce the T3 Volume Factor.
Apply damping only around deceleration and turns.
An optional velocity limiter provides a final ATR-based cap on extreme one-bar movement, while an optional generalized compensation stage can reintroduce controlled responsiveness after the main smoothing process.
The final line determines trend through its slope, while a delayed WMA reference forms the optional ribbon. Ribbon intensity can also respond to normalized trend velocity.
Adaptive T3 Hull is therefore designed less as one fixed moving-average formula and more as a configurable filter architecture for exploring the trade-off between lag, smoothness, responsiveness and overshoot .
Its default configuration intentionally favors a less tail-heavy response than a conventional Hull construction, while the advanced controls allow users to move the model toward either greater responsiveness or stronger damping depending on the behaviour they want from the trend filter.
Indicador

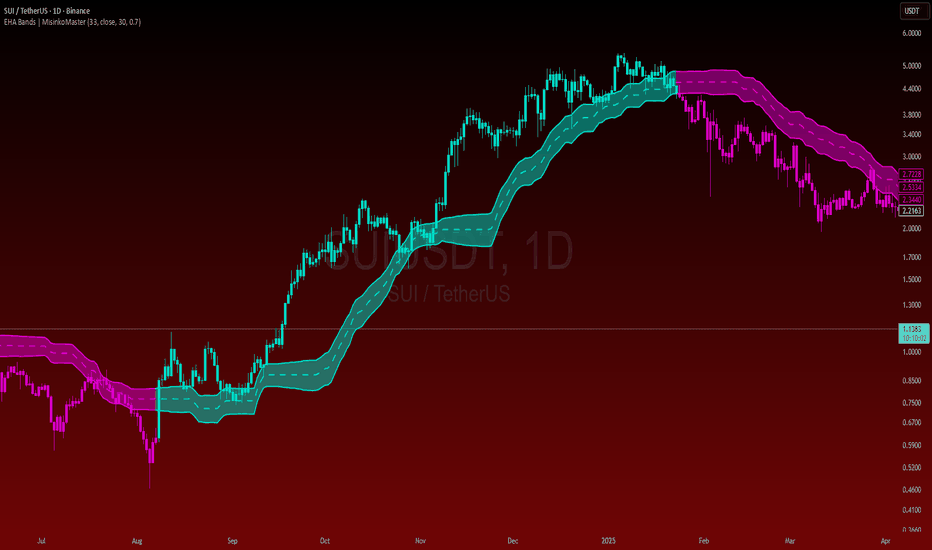
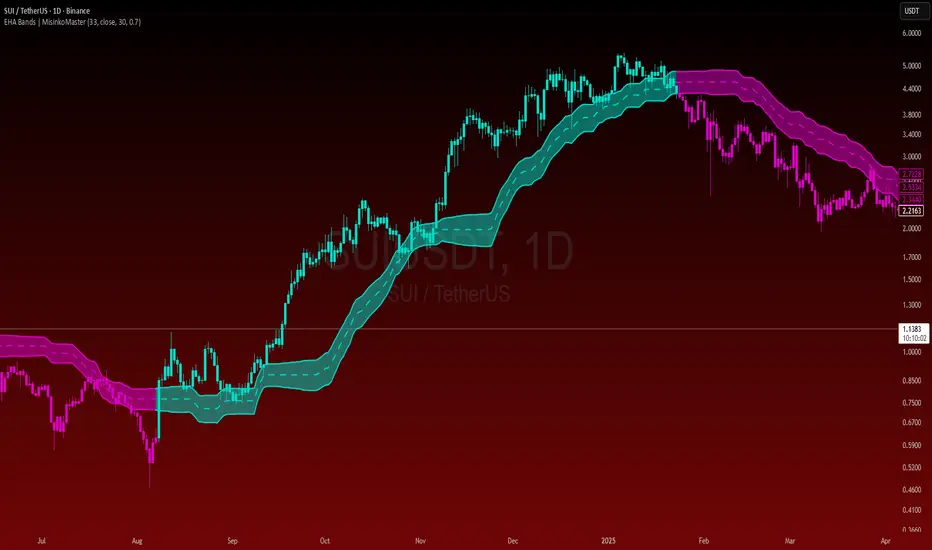
Hull ALMAHull ALMA | MisinkoMaster
The Hull ALMA (HALMA) is a low-lag, hybrid moving average engineered to solve one of technical analysis's oldest trade-offs: lag versus smoothness. Classical moving averages like the SMA or EMA suffer from heavy lag during fast trend changes, while ultra-responsive averages like the standard Hull Moving Average (HMA) are notoriously prone to overshooting and producing sharp noise during sideways consolidation.
By replacing the weighted moving average core of the classic Hull algorithm with Arnaud Legoux Moving Averages (ALMA), the Hull ALMA eliminates lag through Gaussian-weighted smoothing rather than simple linear weighting. The result is a fluid, low-latency trend line that tracks price shifts rapidly while filtering out false breakouts and market noise.
How It Works (The Core Architecture)
The indicator combines the mathematical structure of the Hull transformation with Gaussian curve filtering:
Half-Length and Full-Length Gaussian Smoothing: The algorithm calculates two baseline ALMAs—one over half the lookback period (hln_halma) and one over the full lookback period (len_halma).
Lag Reduction Transformation: Following the classic Hull formulation, the full-period ALMA is subtracted from twice the half-period ALMA (2 * ALMA_half - ALMA_full) to project price direction forward and neutralize lag.
Square-Root Gaussian Smoothing: The projected series is smoothed a final time using an ALMA calculated over the square root of the lookback period (sln_halma), producing an ultra-smooth curve without introducing phase delay.
Dual-Confirmation Trend Filter: The algorithm concurrently tracks standard HMA slope alongside HALMA slope to ensure structural alignment before confirming regime shifts.
Key Features
Gaussian-Weighted Lag Elimination: Replaces linear weighting with ALMA's Gaussian curve distribution, providing superior smoothness and reduced overshoot.
Dual-Moving-Average Confluence: Evaluates both HALMA and HMA slope agreement to confirm high-probability trend direction.
On-Chart Candle Morphing: Automatically recolors main price candles (vibrant cyan for bullish trends, vivid red for bearish trends) to maintain clear visual alignment with active indicator state.
Multi-Line Overlay: Plots both the primary HALMA curve and the complementary HMA baseline directly on your price pane for easy visualization of moving average dynamics.
Input Parameters & Optimization Guide
Source: Sets the input price series used for calculations (Default: OHLC4).
HALMA Length: Sets the baseline lookback window. A default of 70 bars balances macro trend tracking with short-term responsiveness (Default: 70).
Offset: Controls the Gaussian distribution offset within the ALMA engine. Higher values increase responsiveness to recent price changes (Default: 0.85).
Sigma: Controls the width of the Gaussian filter. Higher values sharpen the smoothing focus, while lower values broaden the window (Default: 6).
Trading Strategies & Execution
Dual-Slope Regime Shifts
Bullish Alignment: Confirmed when both the HALMA and standard HMA are sloping upward, turning price chart candles cyan.
Bearish Alignment: Confirmed when both the HALMA and standard HMA are sloping downward, turning price chart candles red.
Dynamic Support & Resistance
In established trends, the HALMA line serves as dynamic trailing support during bull moves and dynamic resistance during bear moves. Look for pullbacks toward the HALMA curve for low-risk continuation entries in the direction of the active trend state.
Disclaimer: Trading financial markets involves high risk. This technical script is designed as an informational analytical tool to support your rule-based mechanical execution system and does not constitute financial advice. Indicador

BIST30 to SP 500 ATR Momentum RiderBIST30 to S&P 500 — ATR Momentum Rider
BIST30 to S&P 500 — ATR Momentum Rider is a long-only daily strategy built to test a compact and auditable trend-following structure across index futures.
The name describes the research scope—from BIST30 to S&P 500 and other major index futures. It does not mean that the public parameters were optimized on BIST30. Parameter selection used Mini-DAX, E-mini S&P 500, E-mini Russell 2000, EURO STOXX 50, and Nikkei 225 Mini futures. Turkish index futures were kept outside parameter selection and used only as transferability stress tests.
Entry logic
The raw SET event occurs when HMA 8 > HMA 9 > HMA 20 becomes true for the first time. On that same daily close, the strategy calculates the three-day HMA20 slope in ATR units:
(HMA20 - HMA20 ) / (3 × ATR14)
The setup is accepted only when this value is at least -0.180 ATR per day. The threshold does not require a rising HMA20; it permits a mild decline and rejects setups where the slow trend is deteriorating more sharply. The filter is evaluated only on the first establishment of the HMA order. A rejected setup does not enter later inside the same uninterrupted regime.
An accepted setup creates a market order for the next available session open. The decision uses only values known at the daily close.
Exit logic
The strategy has one public exit stage:
K1-A: activation threshold. Maximum favorable excursion is divided by the ATR value known when the entry order is created. Default: 1.50 ATR.
K1-T: trail distance from the highest high observed during the campaign. Default: 5.75%.
K1-W: minimum waiting interval before a K1 close decision can act. Default: 4 sessions.
Once K1 is active, its absolute trail can only rise. An activation reached on the current bar becomes actionable from the next bar, so the activation bar cannot stop itself retroactively. A daily close at or below the active K1 line creates a market exit for the next available open. If a fresh accepted SET appears while a position is open, the campaign is refreshed at the next open.
Research process and held-out results
The K1 values were selected on January 2020–December 2023 data using equal-weight, percentage-normalized metrics across the five international contracts. Keeping the K1 engine fixed, the three-day slope threshold was then scanned from -0.400 to +0.050 ATR/day in 0.001 steps on the same development interval. The exact PF-priority plateau peak was -0.176; the operational value was rounded and locked at -0.180 to avoid publishing a fragile, over-precise threshold.
January 2024–July 2026 was not used to select the slope threshold. In this held-out interval:
Raw setups: 153
Accepted setups/trades: 102 (33.3% reduction)
Positive international instruments: 5 of 5
Median profit factor: 3.46 versus 1.94 without the slope filter
Median normalized net return: 39.3% versus 37.9% without the slope filter
Median return/max-drawdown ratio: 2.32 versus 2.16 without the slope filter
These figures use one adverse minimum tick per market fill and no commission, tax, funding, or roll cost. They are historical research results, not a forecast.
The held-out BIST stress test remained weak: the three Turkish contracts had a median profit factor of 0.77 with the slope filter. Therefore, this public version is better viewed as an international index-futures research strategy. It is not a replacement for a dedicated BIST30 live system.
Use the strategy on standard daily candles. Review each symbol's contract multiplier, session, continuous-contract construction, commissions, roll costs, and margin settings before interpreting Strategy Tester results. Changing the HMA, ATR, K1, or execution settings creates a different, unvalidated configuration.
This script is a research and educational tool, not investment advice. Past performance does not guarantee future results.
BIST30 to S&P 500 — ATR Momentum Rider
HMA 8/9/20 kuruluşunu, sabit ATR-normalize HMA20 eğim filtresini ve yalnız yukarı taşınan tek tepe trailini birleştiren açık kaynak, long yönlü günlük strateji.
BIST30 to S&P 500 — ATR Momentum Rider, farklı endeks vadelilerinde sade ve denetlenebilir bir trend takip yapısını sınamak amacıyla hazırlanmış, yalnız long çalışan günlük bir stratejidir.
İsim, araştırmanın BIST30'dan S&P 500'e ve diğer büyük endeks vadelilerine uzanan kapsamını anlatır. Açık kaynak parametrelerinin BIST30 üzerinde optimize edildiği anlamına gelmez. Parametre seçiminde Mini-DAX, E-mini S&P 500, E-mini Russell 2000, EURO STOXX 50 ve Nikkei 225 Mini vadeli kontratları kullanılmıştır. Türkiye endeks vadelileri parametre seçiminin dışında tutulmuş ve yalnız taşınabilirlik stres testi olarak değerlendirilmiştir.
Giriş mantığı
Ham SET olayı, HMA 8 > HMA 9 > HMA 20 sıralamasının ilk kez oluştuğu günlük kapanışta doğar. Strateji aynı kapanışta HMA20'nin üç günlük eğimini ATR cinsinden hesaplar:
(HMA20 - HMA20 ) / (3 × ATR14)
Kuruluş yalnız bu değer -0,180 ATR/gün veya daha yüksekse kabul edilir. Eşik HMA20'nin mutlaka yükselmesini istemez; hafif gerilemeye izin verir, yavaş trendin daha belirgin bozulduğu kuruluşları eler. Filtre yalnız HMA sıralamasının ilk kuruluşunda değerlendirilir. Reddedilen kuruluş, aynı kesintisiz rejimin sonraki günlerinde gecikmeli girişe dönüşmez.
Kabul edilen kuruluş, sonraki uygun seans açılışı için piyasa emri oluşturur. Karar yalnız günlük kapanışta bilinen değerlerle verilir.
Çıkış mantığı
Stratejide tek bir açık kaynak çıkış katmanı vardır:
K1-A: aktivasyon eşiği. Azami olumlu hareket, giriş emri oluşturulurken bilinen ATR değerine bölünür. Varsayılan: 1,50 ATR.
K1-T: kampanya boyunca görülen en yüksek fiyattan itibaren trail mesafesi. Varsayılan: %5,75.
K1-W: K1 kapanış kararının uygulanabilmesi için gereken asgari bekleme süresi. Varsayılan: 4 seans.
K1 aktif olduktan sonra mutlak trail seviyesi yalnız yukarı hareket eder. Bir barda ulaşılan aktivasyon eşiği sonraki bardan itibaren uygulanabilir; aktivasyon barı geriye dönük biçimde kendi kendisini durduramaz. Günlük kapanış aktif K1 çizgisinde veya altında gerçekleşirse sonraki uygun açılış için piyasa çıkışı oluşturulur. Pozisyon açıkken yeni ve kabul edilmiş bir SET doğarsa kampanya sonraki açılışta yenilenir.
Araştırma süreci ve ayrılmış dönem sonuçları
K1 değerleri Ocak 2020–Aralık 2023 döneminde beş yabancı kontrat üzerinde; endeksler eşit ağırlıklı ve fiyat ölçekleri yüzdeyle normalize edilerek seçildi. K1 motoru sabit tutulduktan sonra üç günlük eğim eşiği aynı geliştirme döneminde -0,400 ile +0,050 ATR/gün arasında 0,001 adımla tarandı. PF öncelikli platonun matematiksel tepe noktası -0,176 oldu; aşırı hassas bir değer yayımlamamak için operasyonel eşik -0,180 olarak yuvarlanıp sabitlendi.
Ocak 2024–Temmuz 2026 dönemi eğim eşiğinin seçiminde kullanılmadı. Bu ayrılmış dönemde:
Ham kuruluş: 153
Kabul edilen kuruluş/işlem: 102 (%33,3 azalış)
Pozitif yabancı endeks: 5/5
Medyan profit factor: eğim filtresi olmadan 1,94, filtreyle 3,46
Medyan normalize net getiri: filtresiz %37,9, filtreyle %39,3
Medyan getiri/azami düşüş oranı: filtresiz 2,16, filtreyle 2,32
Bu rakamlar her piyasa dolumunda bir minimum fiyat adımı ters slippage içerir; komisyon, vergi, fonlama ve vade geçiş maliyeti içermez. Tarihsel araştırma sonucudur, gelecek tahmini değildir.
BIST stres testi zayıf kalmıştır: eğim filtresiyle üç Türkiye kontratının medyan profit factor değeri 0,77 olmuştur. Bu nedenle açık kaynak sürümü yabancı endeks vadelileri için bir araştırma stratejisi olarak değerlendirmek daha doğrudur; özel BIST30 canlı motorunun yerine geçmez.
Stratejiyi standart günlük mumlarda kullanın. Strategy Tester sonucunu yorumlamadan önce sembolün kontrat çarpanını, seansını, sürekli-vade oluşturma yöntemini, komisyonunu, vade geçiş maliyetini ve teminat ayarlarını kontrol edin. HMA, ATR, K1 veya emir yürütme ayarlarını değiştirmek doğrulanmamış farklı bir model oluşturur.
Bu kod araştırma ve eğitim amaçlıdır; yatırım tavsiyesi değildir. Geçmiş performans gelecekteki sonuçları garanti etmez. Estratégia

RibbonFlux MA - Adaptive Flow [AFD]
Your averages are stacked and pointing the same way - but is that move widening, just holding, or already compressing?
Every MA ribbon on the shelf draws the same two or three lines and floods the gap with one colour at one opacity. So a ribbon that has pulled four ATR apart and is still separating looks exactly like a ribbon that has collapsed onto itself. The fill never tells you anything the lines didn't, which is why most people end up reading the lines and ignoring the shading entirely.
RibbonFlux makes the space between the lines carry the information. The gap is measured against ATR, ranked against its own recent history, and the shading answers to that: it deepens while the legs separate in agreement, and drains to a restrained neutral the moment they compress or lose their order. Same averages you already read - the space between them now states which of four conditions it is in.
WHY IT MATTERS
Separation and compression are the two things an MA ribbon actually knows, and the standard ribbon throws both away by drawing them identically. RibbonFlux spends its whole visual budget on that one distinction. It describes geometry already on your chart - never a prediction of what comes next, and never an instruction to act.
AT A GLANCE
Three independent averages - Lead, Base, and an optional Third. Each picks its own method, length (2-250) and price source, and a single enabled average still draws on its own.
Eight methods per slot - EMA, SMA, WMA, VWMA, HMA, RMA (Wilder), McGinley Dynamic, Fibonacci EMA Composite. Mixed freely: an HMA Lead over an EMA Base over an RMA Third is a valid setup.
Seven price sources per slot - Open, High, Low, Close, HL2, HLC3, OHLC4. Set per average rather than globally, and always on the chart timeframe.
The Flow Phase Engine - four conditions drive the fill's colour and depth: coherent expansion, stable flow, compression, mixed structure. Display only, and they never touch the MA values.
Each leg measured separately - Lead/Base and Base/Third are scored independently, so one fill can be compressing while the other expands. A single-opacity ribbon cannot show that.
Twelve palettes - Ocean, Indigo, Ember, Mono, Forest, Gold, Violet, Orderflow, Midnight, Copper, Arctic, Carbon. Or set Line color mode to Custom for a fixed colour per average, independent of the flow.
Line width and line style - 1 to 4 pixels, and Solid, Stepped, Dotted or Crosses. Applied to every core line and both halo tiers together, so the whole system thins or thickens as one.
Optional flow candles - bodies, wicks and borders take the relationship colour. Off by default, and under Adaptive dynamics they turn neutral during compression along with the ribbon.
Deliberately quiet - seven plots, two fills, one optional candle overlay. No alerts, no arrows, no dashboard, no labels, no boxes, no trendlines, nothing else drawn.
THE FOUR FLOW PHASES
Each leg of the ribbon is classified on every bar, and its own fill responds. Nothing here produces an event, and no phase ranks, scores or grades the market.
Coherent expansion - the enabled averages are in order, sloping the same way, and that leg is widening. Deepest shading: the phase factor is 1.00.
Stable flow - in order and sloping together, but the leg is not widening. Held back at 0.75.
Compression - the leg's ATR-normalized spacing sits in the bottom fifth of its own last 100 bars. Restrained neutral colour, and a phase factor of 0.00, which leaves depth at its 0.35 floor.
Mixed structure - the ordering or the slope agreement has broken. Restrained neutral colour, minimal shading at 0.25.
Compression uses a deadband, not a single threshold: a leg enters compression at a percent rank of 20 or below and only leaves it at 30 or above, so a leg hovering near one number does not flicker between two appearances. Before 100 bars of history exist, no leg is classified as compressed.
THE MECHANICS, STATED PLAINLY
ATR spacing = abs(faster average - slower average) / max(ATR(14), one tick)
leg depth = 0.35 + 0.65 x clamp(ATR spacing, 0, 1) x phase factor, then EMA-smoothed over the Flow response length
compression: enter at percent rank <= 20 over 100 bars, leave at >= 30
ordered: Lead > Base (> Third), or Lead < Base (< Third)
Flow response sets one number used three ways - the slope lookback, the expansion lookback, and the smoothing length: Quick is 2 bars, Balanced 3, Smooth 5. Setting Ribbon dynamics to Fixed bypasses the engine and holds each fill at the opacity you selected.
HOW IT DIFFERS FROM A STANDARD MA RIBBON
The fill is measured, not decorative - opacity is a function of ATR-normalized spacing and phase, recomputed every bar. A conventional ribbon fills the gap at a constant tone however wide or narrow it is.
Both legs are scored on their own terms - the Lead/Base fill and the Base/Third fill can disagree, so compression in the inner leg does not mute the outer one, or the reverse.
Compression is relative to the instrument, and sticky - a percent rank of its own history with a 20/30 deadband, not a fixed price or tick distance. It travels across symbols and timeframes without retuning.
Two methods a ribbon rarely offers - McGinley Dynamic and a Fibonacci EMA Composite. The composite is the equal-weight mean of five EMAs at Fibonacci-scaled periods; McGinley scales its own step by the fourth power of the price ratio.
The arithmetic ships with an independent open-source reference implementation - every documented formula is reproducible rather than asserted. A trust signal, not the pitch: what you are here for is the ribbon, not the tests.
THE VISUALS
Lead and Base - a crisp core line plus two restrained halo tiers each. At the default width of 2 the Lead halos are 6 and 4 pixels and the Base halos 5 and 3; Line width scales all of it together.
Glow - Off, Soft, Balanced, Rich, with opacity following Lead/Base spacing independently of the ribbon. So the lines themselves brighten as the pair separates, with a floor so they never vanish.
Ribbon shading - Off, Soft, Balanced, Rich sets the maximum depth the Flow Phases then modulate. Off removes both fills and leaves the lines.
A valid Third MA - one crisp line plus its own Base-to-Third shade. It also joins the ordering and slope tests, so enabling it makes coherence a three-line condition.
Line style - Stepped holds each value until the next bar. Dotted and Crosses place one mark per bar, so spacing follows bar width and opens up as you zoom in. Pine's plot() has no stroked dotted or dashed line, and this script uses no drawing objects to fake one.
Layering - the lines and fills draw in front of the candles, not behind them. Deliberate, so the optional flow candles can colour wicks and borders as well as bodies; if it reads heavy, Line width 1 or Glow Soft thins it.
HOW TO USE IT
Start with the defaults - Close EMA 9 over Close EMA 21, Ocean, Balanced glow and shading, Adaptive dynamics. Chosen for readability, not tuned as trading parameters.
Enable the Third MA for slower context - it defaults to Close EMA 50. Ordering then requires all three in sequence, a stricter condition than two.
Reach for Flow response first - Quick if the shading feels sluggish, Smooth if it feels twitchy. It is the one control that changes how fast the appearance reacts.
Set Ribbon dynamics to Fixed to switch the engine off - a plain constant-opacity ribbon, for comparing against what you ran before. Everything else, from palette to custom colours to width, style, glow and candle colouring, is taste: set it once and leave it.
WHAT IT DELIBERATELY DOES NOT DO
It issues no alerts and has no alert conditions at all. It draws no arrows, entries, retests, setup zones, targets or labels, keeps no dashboard or readout, and ranks, scores and grades nothing. It makes no accuracy, reliability, profitability, probability or future-result claim of any kind. Moving averages are lagging transformations of price that has already printed: visible separation, alignment or colour establishes neither future direction nor the quality of any trade. Educational chart context only - not financial advice.
DATA, TIMEFRAMES, AND WHAT TO CHECK YOURSELF
Everything is computed on your chart's own timeframe and data - there are no higher-timeframe requests anywhere in the source, so there is no lookahead argument to disclose and no second feed to reconcile against your chart.
Any MA moves while its bar is still forming , and two parts of this script also carry state from bar to bar: the McGinley recursion and the compression deadband. That describes the mechanism. Confirm it with the bar-replay tool on your own symbol and timeframe before relying on it - a description of mechanism is not that check, and nothing here claims to be.
The averages read chart OHLC - on Heikin Ashi, Renko, Range or similar they average those synthetic values, not traded prices. Use standard time-based candles if you want the averages to describe real prices.
VWMA needs usable volume, and the Fibonacci EMA Composite needs a length of 8 or more - each is simply unavailable otherwise. A selected calculation that cannot be produced stays unavailable: the script never silently substitutes another method.
McGinley seeds from an SMA of its own length, then advances by previous + (source - previous) / (0.6 x length x ratio^4). If its source or recurrence goes invalid the line goes unavailable and reseeds only after the next contiguous valid window.
Identical Lead and Base settings leave nothing to read - both lines still draw, but the ribbon and flow candles switch off and the lines fall back to neutral. A Third duplicating Lead or Base likewise draws its line while taking no shade and no phase depth.
ORIGINALITY AND CREDIT
Ribbon indicators are old ground; what is new here is that the fill is a measurement rather than a decoration - ATR-normalized leg spacing, a relative compression rank with hysteresis, and per-leg depth, all resolved into colour and opacity and nothing else. The engine is deliberately confined to display, and the surface is deliberately small.
Open source under the Mozilla Public License 2.0. (c) Auction Foundry LLC.
This indicator describes the geometry of averages computed from your chart's own price history. It is not a forecast, not a signal, and not financial advice. Indicador

Ultimate Hull SuiteGreymyst Ultimate Hull Suite
The Greymyst Ultimate Hull Suite is a premium, multi-functional trend-following indicator designed to provide traders with highly accurate, low-lag momentum signals. Built entirely from the ground up for professional trading, this suite combines advanced Moving Average variations with dynamic volatility filters and multi-timeframe analysis to offer extreme confluence in a single tool.
🌟 Core Concepts & Features
1. Advanced Hull Variations
Traditional moving averages often suffer from lag. The Hull Moving Average solves this by prioritizing recent price action. This suite allows you to toggle between three powerful variations:
HMA (Standard Hull): The classic low-lag moving average.
EHMA (Exponential Hull): Uses exponential calculations to react even faster to sudden price spikes.
THMA (Triple Hull): Offers ultra-smooth trend detection, practically eliminating market noise and false signals during choppy ranges.
2. Multi-Timeframe (MTF) Alignment
Trading against the macro trend is a common pitfall. The built-in MTF engine allows you to anchor your Hull Moving Average to a higher timeframe (e.g., viewing the 4-Hour Hull trend on a 15-minute chart). This ensures you are only taking trades that align with the dominant market direction.
3. Dynamic Volatility Bands (Hull Envelopes)
Instead of static support and resistance, this suite wraps the Hull Moving Average in ATR-based Volatility Bands.
Trend Cloud: The area between the Hull and the bands is filled with a bullish (green) or bearish (red) cloud.
Mean Reversion: When price action aggressively pierces the upper or lower bands, it signals an overextended market, warning you of potential pullbacks or mean-reversion opportunities.
4. Squeeze Momentum Confluence Filter
A trend is only as strong as the volume and volatility behind it. This indicator integrates a hidden Squeeze Volatility Engine (combining Bollinger Bands and Keltner Channels).
The Filter: Buy and Sell signals are strictly suppressed if the market is stuck in a low-volatility "squeeze" (consolidation).
Signals are only generated when the Hull changes direction AND volatility is actively expanding, keeping you out of flat, choppy markets.
5. Automated Signals & Alerts
The suite visually prints clear B (Buy) and S (Sell) markers on your chart when high-probability confluence is met (Trend Shift + Volatility Expansion).
It includes comprehensive, ready-to-use Alert Conditions so you can automate your trading via webhooks or receive notifications directly to your phone.
⚙️ How to Use It for Confluence
Trend Confirmation: Use the color of the Hull MA (Green for Up, Red for Down) as your primary directional bias.
Entry Triggers: Look for Buy/Sell markers printed by the indicator. Because of the built-in Squeeze filter, these markers represent moments where price is reversing with momentum.
Take Profit / Stop Loss: Use the outer ATR bands as dynamic profit targets or trailing stop-loss zones.
(Created by greymyst) Indicador

AetherEdge - Hull MA Ribbon + Momentum Filter🖊️ Overview
AetherEdge Hull MA Ribbon + Momentum Filter is a next-generation trend visualization engine that fuses the ultra-low-latency characteristics of Hull Moving Averages (HMA) with a composite RSI+MACD momentum score. Six HMA ribbons trace price flow with smooth precision, while a 7-tier color gradient evolves dynamically with real-time momentum strength. This is a professional visual analysis tool that captures both direction and strength of trend at a glance.
🔶 Key Features
6-Line HMA Ribbon: Smooth, responsive trend visualization powered by ultra-low-latency Hull MA
RSI+MACD Composite Momentum Score: Weight-adjustable hybrid indicator
7-Tier Strength Categorization: Strong Bull / Bull / Weak Bull / Neutral / Weak Bear / Bear / Strong Bear
Perfect Stacking Detection: Identifies maximum trend strength via 6-line full alignment
Dynamic Gradient Coloring: Bold inner, fading outer—professional visual
Ribbon Alignment Filter: Suppresses signal false positives
Cross Signal Detection: Auto-marks trend reversal points
Integrated Dashboard: Momentum %, strength category, ribbon state at a glance
Dark Mode Support: AetherEdge premium UI
🧠 Technical Architecture
This indicator integrates Hull MA's mathematical superiority with multi-factor momentum analysis—a refined trend analysis system.
Hull MA Formula: HMA(n) = WMA(2*WMA(n/2) − WMA(n), sqrt(n))—solves traditional MA lag via double-WMA differential and sqrt-smoothing. Reaction speed approximately 2x that of EMA.
6-Line Ribbon Structure: baseLen + step×0–5 arithmetic progression. Gradient from short-term (h1) to long-term (h6), visualizing trend hierarchy.
Momentum Score Composition Logic:
RSI Normalization: (RSI − 50) / 50 mapped to -1 to +1
MACD Histogram Normalization: hist / stdev(hist, 100) standardized, clipped at ±3, divided by 3
Weighted Average: rsiWeight × RSInorm + (1−rsiWeight) × MACDnorm
Final output displayed as 0–100% momentum index
Ribbon Direction Detection: ribbonUp/Down determined by slope of central HMAs (h3, h4)
Perfect Stacking: h1>h2>h3>h4>h5>h6 full alignment certifies maximum trend strength
7-Tier Strength Classification:
+3 (Strong Bull): High momentum + up + perfect alignment
+2 (Bull): High momentum + up
+1 (Weak Bull): Mid momentum + up
0 (Neutral): No directional bias
−1 to −3: Symmetrical bearish judgment
Dynamic Coloring: Entire ribbon shifts across 7 colors based on strengthCat
⚙️ Recommended Settings & Tuning Guide
Crypto Defaults:
BTC (4H–Daily): baseLen=20, step=8, rsiWeight=0.5 (standard balance)
ETH (1H–4H): baseLen=15, step=6 prioritizing reaction speed
SOL (High-Vol): baseLen=25, step=10 for noise reduction
XRP (Range): strongLvl=70, weakLvl=30 for strict judgment
Tuning Guide:
Day Trading: baseLen=10-15, step=5, primary 1H/15M
Swing: baseLen=30-50, step=10 for macro trends
Scalping: baseLen=8, step=4 for ultra-short-term response
Momentum-Focused: rsiWeight=0.7 for higher RSI weight (effective in range)
Trend-Focused: rsiWeight=0.3 for higher MACD weight (strong trend detection)
Excess Signals: strongLvl=70+ for selectivity
Few Signals: strongLvl=60 + ribbonAlign=false to relax
💡 How to Use in Practice
★★★ STRONG BULL/BEAR: Maximum confluence, optimal for trend-following entries
Ribbon Expansion: Widening 6-line spread indicates trend acceleration—pullback long / rebound short recommended
Ribbon Contraction: Converging 6 lines = breakout precursor warning
Color Transition Points: Bull→Neutral→Bear shifts = early trend reversal alerts
Multi-Timeframe Synergy: Higher-TF Strong Bull + lower-TF pullback = perfect entry
AetherEdge Synergy:
Order Block + FVG Detector OB retest + Strong Bull color = ultra-high-conviction entry
Self-Evolving S/R Grid strong line + ribbon directional match = enhanced target precision
Squeeze Breaker breakout + ribbon expansion = trend continuation confirmation
Stop Loss: When price penetrates entire ribbon in opposite direction
⚠️ Important Notes
False Signals in Sideways Markets: Frequent color shifts in range; tune weakLvl/strongLvl
Ribbon Alignment Lag: Perfect stacking requires bar progression
MACD Normalization Period: Stdev calculation requires 100 bars; initial wait period
HMA Characteristics: Fast response carries overshoot risk in volatile moves
Hull MA Re-Entrance: Watch for minor reversals immediately after turning points
🚨 Disclaimer
This indicator is a technical analysis tool provided for educational and research purposes only and does not constitute financial advice. Trend and momentum evaluations based on historical price data do not guarantee future market behavior. All trading decisions are made at your own risk and should be accompanied by proper risk management. Indicador
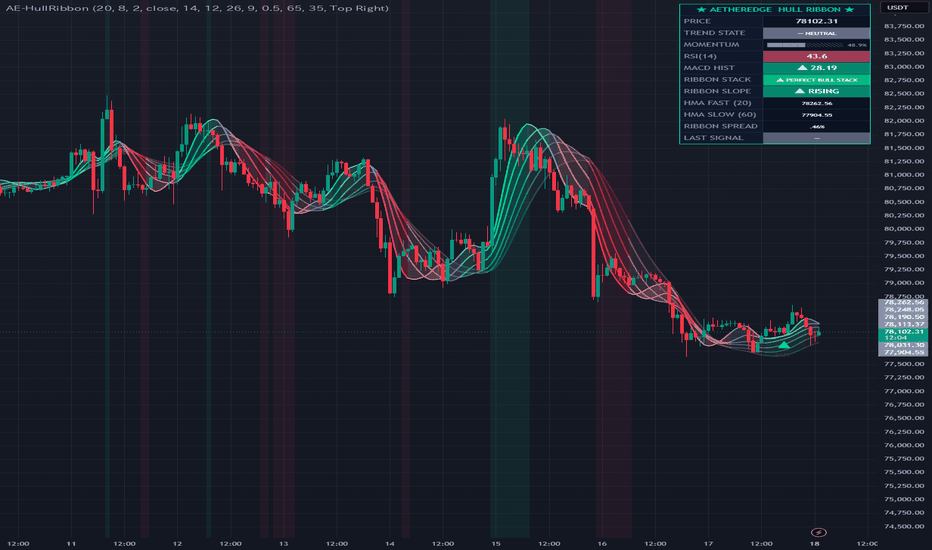
Indicador

Tension Flow Trend [BigBeluga] - Historical RRTension Flow Trend is a high-performance trend-following framework that treats price action like a reactive elastic system. By moving beyond static averages, this indicator introduces "Price Tension"—a sophisticated measurement of how overstretched a trend is relative to its baseline—now enhanced with a live Historical RR (Risk:Reward) backtesting engine.
By combining the ultra-low-lag properties of the Hull Moving Average (HMA) with real-time Z-Score volatility analysis, this indicator visualizes not just the direction of the market, but the mathematical "exhaustion" of every move.
🔵 THE ELASTICITY FRAMEWORK
The Ultra-Responsive HMA Baseline: At the heart of the system is a 50-period Hull Moving Average. Specifically engineered to eliminate the lag found in traditional SMAs, the HMA provides a "true north" that reacts instantly to structural shifts without the usual delay.
Price Tension (Z-Score Engine): The indicator measures the vertical distance between price and the HMA, normalizing it using standard deviation. This Z-Score represents the "Tension" of the trend—showing you exactly when the market has deviated too far from its mean.
Dynamic Transparency Feedback: As price enters an extreme Z-Score range, the trend ribbon’s transparency increases. A bright, solid ribbon indicates compressed, high-probability energy, while a fading ribbon warns that the "elastic band" is stretched to its limit.
🔵 PERFORMANCE & RISK INTELLIGENCE
Automated RR Projection: Upon every "START" signal, the script automatically plots dynamic Risk:Reward boxes. It calculates an ATR-based stop loss and projects a take-profit target based on your custom RR ratio, visualizing the trade's path in real-time.
Rolling Performance Tracker: The indicator features a built-in backtester that tracks the win/loss history of the most recent trades. It calculates your Win Rate based on a rolling sample size, allowing you to see how the strategy is performing under current market conditions.
Signal Cooldown Logic: To eliminate "whipsaw" noise, a configurable cooldown engine ensures that signals only trigger during significant structural shifts. This prevents signal clustering in sideways or choppy markets.
🔵 DUAL-DASHBOARD SYSTEM
Energy Monitor (Bottom-Right): Tracks the numerical Z-Score and categorizes the market status. "Strong" indicates healthy momentum, while "Overextended" warns of an imminent mean-reversion risk.
RR Performance Table (Top-Right): Provides an institutional-grade breakdown of your strategy performance, including total Wins, Losses, and the current Win Rate percentage for the specified trade window.
🔵 STRATEGIC APPLICATION
The Momentum Breakout: Look for "START" labels that appear when the HMA slope aligns with a price crossover. These represent the birth of a new trend cycle where tension is low and expansion is likely.
Managing Trend Exhaustion: When the ribbon begins to fade and the Energy Dashboard hits "Overextended," it is time to tighten stops or take partial profits. High tension usually precedes a sharp snap-back to the baseline.
Confirming with Win Rate: Use the Performance Dashboard to gauge market regime. If the rolling Win Rate is high, the market is respecting the trend envelopes; if it drops, the market may be entering a consolidation phase where you should wait for better alignment.
Mean Reversion Targets: For contrarian traders, the HMA baseline serves as a natural "magnet." When price is significantly overextended, look for price to be pulled back into the HMA "Neutral Zone."
Tension Flow Trend transforms your chart into a map of market stress and opportunity. By visualizing the tension behind every candle and providing real-time performance feedback, it ensures you stay on the right side of the trend while trading with professional-grade risk management. Indicador

Order Flow Momentum Divergence [theUltimator5]This indicator is the Order Flow Momentum Divergence (OFMD)
Most momentum indicators tell you what price has already done (lagging indicators). This indicator is an attempt at a leading indicator by monitoring order flow momentum through volume footprint, comparing it to price momentum, and tracking divergences.
Price momentum indicators -> RSI, MACD, stochastics, all of them lag. They are derivatives of the close. When RSI is overbought, it means price has been going up. That's it. It tells you nothing about whether the actual buying pressure behind that move is still present, exhausted, or already reversing.
Footprint delta alone has the opposite problem. It's noisy, spiky, and hard to read directionally across timeframes. A single bar with massive positive delta doesn't tell you much in isolation.
What OFMD is actually solving is the confirmation gap. Specifically: is the order flow that drove a price move still supporting it, or has it quietly shifted while price continues on inertia?
When Flow Momentum and Price Momentum agree, the move has both structural and transactional backing. When they diverge, particularly when Flow Momentum turns while Price Momentum hasn't yet, you're seeing a potential early warning that the fuel behind the move is changing before price reflects it.
In plain terms: most traders get stopped out or give back gains because they're reading price alone. They're not reading what's happening inside the price. OFMD attempts to surface that internal picture and put it on the same scale as a familiar momentum oscillator so the two can be directly compared bar by bar.
IMPORTANT - Before reading further, this indicator uses the volume footprint, which requires (at the time of creating the indicator) a premium TradingView subscription. If you do not have a access to the volume footprint function, this indicator will not function as intended.
HOW IT WORKS
OFMD runs two signals in parallel.
1) The first is Flow Momentum: a net bias score built by running footprint delta through 100 Hull Moving Averages simultaneously (lengths 2 through 101), normalizing each, and averaging the result. The output is a single -100 to +100 value that represents the aggregate directional lean of order flow across all measured timeframes at once.
2) The second is Price Momentum: a standard 7-period RSI rescaled to the same -100 to +100 range for direct comparison.
When these two signals diverge, Flow Momentum rising while Price Momentum falls, or vice versa, the indicator flags it. That divergence is the signal. The fill between the two lines intensifies as the gap widens. The chart overlay bands extend from price proportionally to signal strength, giving you a visual anchor directly on the candles without needing to cross-reference the sub-pane.
Sub-Pane Series
Show Flow Momentum Line - The purple line. Displays the aggregate order flow bias score derived from footprint delta. Opacity scales with signal strength; it fades when bias is weak and near zero, and becomes fully opaque as conviction builds.
Show Price Momentum Line - The yellow line. A 7-period RSI stretched to -100/+100 so it sits on the same scale as Flow Momentum. Crossing zero means RSI has crossed 50. It is simply a shifted visual of RSI to match the order flow momentum in order to visually watch bullish/bearish crossings.
Show Divergence Fill - Fills the area between the two lines. Color is green for bullish divergence (Flow Momentum leading up) and red for bearish (Flow Momentum leading down). Opacity increases as the gap between the signals widens. Both lines need to be enabled for the fill to render.
Show Difference Histogram (Disabled by default) - Plots the raw arithmetic difference between Flow Momentum and Price Momentum as a histogram. Green bars mean flow is ahead of price; red bars mean price is ahead of flow. Useful for gauging divergence magnitude at a glance without reading the lines themselves.
Chart Overlay
Band Mode — Controls which overlay band or combination of bands is drawn on the price chart.
Bias Band : a single band anchored to a short EMA of price, offset proportionally to Flow Momentum strength. Color shifts from purple at maximum bearish bias through neutral at zero to green at maximum bullish bias. This band tells you where order flow bias is pointing relative to current price. This line acts as a price continuation indicator.
Divergence Band : This plots the offset proportionally to the gap between Flow Momentum and Price Momentum rather than to either signal individually. Color shifts from deep orange when price momentum is leading to electric blue when flow momentum is leading. This band is suppressed when both signals are on the same side but not in strong agreement, to avoid noise. When both signals agree strongly, the Divergence Band inherits the Bias Band's color and position.
Combined (default) : renders both bands simultaneously. The Bias Band fill and the Divergence Band fill are independent in this mode. Only one line is ever drawn on the chart - the Divergence Band line, which adopts the Bias Band's color when signals are strongly aligned.
Other toggles
Enable Chart Overlay - Master switch for everything drawn on the price chart. Turning this off leaves the sub-pane intact and removes all overlay rendering.
Show Bias Band Line - Toggles the outer line of the Bias Band. Only applies when Band Mode is set to Bias Band; in Combined mode the Divergence Band line covers this role.
Show Bias Band Fill - Toggles the fill between the Bias Band line and its anchor. Fill opacity is zero when bias is within ±20 and ramps to full as bias approaches ±100, so weak signals don't clutter the chart.
Show Divergence Band Line - Toggles the outer line of the Divergence Band. This is the only line that renders in Combined mode.
Show Divergence Band Fill - Toggles the fill between the Divergence Band line and its anchor. Like the Bias Band fill, opacity is gated - it stays invisible until the divergence gap exceeds 20, then ramps proportionally. Suppressed entirely when both signals share the same sign but lack strong conviction.
Show Background Highlight - Tints the chart background green during bullish divergence and red during bearish divergence. Only activates when the gap between the two signals exceeds 50, so it fires on meaningful separations rather than routine noise. Opacity scales with gap size up to a ceiling.
Overlay Smoothing
Smooth Overlay Bands (EMA) (Enabled by default) - Applies an EMA to the four overlay band position values before they are plotted. This reduces bar-to-bar jitter on the chart overlay without touching any of the sub-pane calculations. Flow Momentum, Price Momentum, and the histogram are unaffected.
When the overlay bands aren't smoothed, the response time for divergences is quicker, but the overlay chart is noisy and can produce more false signals.
Smoothing Length - The EMA period applied to the overlay bands when smoothing is enabled. Default is 5. Lower values track price more closely with more noise; higher values produce cleaner bands with more lag. The useful range is roughly 3 to 15 for most instruments and timeframes. Indicador

Volatility Hull Ribbon [BackQuant]Volatility Hull Ribbon
Overview
Volatility Hull Ribbon is a trend-following overlay built from a Hull-style moving average that replaces traditional volume weighting with volatility weighting . Instead of weighting price by traded volume, this indicator weights price by the absolute True Range of each bar, meaning bars with larger range expansion have more influence on the final trend estimate.
The goal is to create a smoother but responsive trend line that pays more attention to bars where the market actually moved with force. It then plots this volatility-weighted Hull structure as either a clean line or a ribbon-style band, with gradient fill, candle coloring, and long/short flip markers.
At a high level, the indicator does three things:
Builds a volatility-weighted moving average using True Range as the weighting source.
Applies Hull-style lag reduction to produce a faster trend-following curve.
Visualizes trend direction using slope, ribbon fill, candles, and flip signals.
Core idea
Most moving averages treat each bar equally or weight only by time. That means a quiet candle and a high-range expansion candle can have similar influence depending on the MA type.
Volatility Hull Ribbon takes a different approach:
Bars with larger True Range are treated as more important.
Bars with smaller True Range have less influence.
Recent bars are also weighted more heavily than older bars.
This creates a trend estimate that responds more strongly when the market expands, while remaining smoother during lower-energy movement.
What “volatility-weighted” means here
The custom weighting function uses:
Price source
Absolute True Range
A decreasing time weight
For each bar inside the lookback:
Weighted price contribution = source * abs(True Range ) * recency weight
Weight contribution = abs(True Range ) * recency weight
Then:
Volatility-weighted average = weighted price sum / weighted True Range sum
So price movement on wide-range bars matters more than price movement on quiet bars.
Why True Range is used
True Range captures more than just high-low movement. It accounts for gaps and previous close displacement. This makes it a broader volatility proxy than simple candle range.
Using True Range as the weight means the filter gives more importance to bars where:
Range expanded,
Price displaced aggressively,
Volatility increased,
Market participation likely intensified.
This is useful because strong trend moves often occur during volatility expansion, not during quiet drift.
Hull-style construction
The indicator then applies a Hull-style transformation to the volatility-weighted average.
The structure is:
VWHMA = VWMA_TR( 2 * VWMA_TR(src, len / 2) - VWMA_TR(src, len), sqrt(len) )
Where VWMA_TR means the custom True-Range-weighted moving average.
This follows the same logic as the classic Hull Moving Average:
Use a faster half-length average.
Use a slower full-length average.
Subtract the lagging component.
Smooth the result with sqrt(length).
The difference is that every smoothing step is volatility-weighted instead of standard weighted-average based.
Why this matters
A classic Hull Moving Average is already designed to reduce lag. This version modifies the internal weighting so the curve becomes more sensitive to volatility-backed price movement .
That means:
Large expansion bars can pull the filter faster.
Weak low-range chop has less effect.
Trend changes during strong movement can be reflected more clearly.
Trend detection
Trend direction is based on the slope of the VWHMA:
Bullish when VWHMA > VWHMA
Bearish when VWHMA < VWHMA
This is a simple but effective regime definition:
Rising volatility-weighted Hull = bullish trend pressure.
Falling volatility-weighted Hull = bearish trend pressure.
The script uses this slope state to color:
The main line,
The ribbon fill,
Optional candles,
Signal markers.
Ribbon mode
When “Plot as Band?” is enabled, the script creates a second line:
onebar_off = WMA(VWHMA , 10)
This is a delayed and smoothed version of the VWHMA. The area between the current VWHMA and this offset line becomes the ribbon.
Interpretation:
Ribbon expansion shows separation between current trend structure and its delayed reference.
Ribbon compression shows trend slowing or flattening.
A clean flip in the ribbon often coincides with trend transition.
The ribbon is not a volatility band. It is a trend displacement ribbon built from the difference between the current VWHMA and its delayed smoothed version.
Gradient fill logic
The fill is directional:
If VWHMA is above the offset line, fill intensity is stronger near the VWHMA and fades toward the offset.
If VWHMA is below the offset line, the gradient reverses.
This creates a cleaner visual than a flat fill because it emphasizes the active side of the ribbon.
In practice:
Strong bright ribbon = trend line leading the delayed reference.
Faded/narrow ribbon = weaker separation.
Ribbon reversal = trend pressure has shifted.
Signal logic
Signals are generated when the VWHMA slope changes direction:
Long signal: crossover(VWHMA, VWHMA )
Short signal: crossunder(VWHMA, VWHMA )
This means:
A long signal prints when the current VWHMA turns upward relative to the previous value.
A short signal prints when the current VWHMA turns downward.
These are slope-flip signals, not price crossover signals.
Important interpretation
A signal does not mean “buy blindly” or “sell blindly.” It means the volatility-weighted trend estimate has changed direction. The quality of the signal depends on:
Market structure,
Higher timeframe trend,
Volatility conditions,
Whether the ribbon is expanding or compressing.
Candle coloring
When enabled, candles are painted according to the VWHMA slope:
Bullish slope = long color.
Bearish slope = short color.
This makes the indicator easier to read as a regime overlay. You can quickly see when the market is consistently aligned with the volatility-weighted trend.
How to use it
1) Trend filter
Use the VWHMA color as a bias filter:
Only favor longs when the VWHMA is rising.
Only favor shorts when the VWHMA is falling.
2) Trend transition tool
Slope flips can identify early trend shifts:
Long marker = VWHMA has turned upward.
Short marker = VWHMA has turned downward.
Because the filter is Hull-style and volatility-weighted, it can react faster than slower trend filters while still suppressing some low-range noise.
3) Ribbon strength reading
The ribbon gives additional context:
Expanding ribbon = stronger separation and cleaner trend pressure.
Contracting ribbon = momentum weakening.
Ribbon flattening = chop or transition risk.
4) Pullback structure
In strong trends, price often respects the VWHMA or ribbon area:
Bull regime: pullbacks into the ribbon can act as support.
Bear regime: rallies into the ribbon can act as resistance.
5) Volatility-backed trend confirmation
Because large True Range bars influence the calculation more, this tool is useful for identifying whether trend changes are being supported by actual range expansion.
If price moves but the VWHMA does not respond strongly, the move may lack volatility-backed confirmation.
Input guide
Price Source
Defines the input series used for the calculation. Close is standard, but hl2, hlc3, or ohlc4 can be used for smoother structural behavior.
Lookback Period
Controls the smoothing length:
Lower values = faster response, more signals, more noise.
Higher values = smoother trend, fewer flips, more lag.
Plot as Band
Enables the ribbon view using the delayed smoothed VWHMA reference.
Line Width
Controls the main line thickness when not relying heavily on band mode.
Show Trend Candles
Paints candles by current trend state.
Show Signals
Toggles the long/short slope-flip markers.
Strengths
Uses volatility-weighted smoothing instead of equal weighting.
Combines volatility sensitivity with Hull-style lag reduction.
Clean ribbon visualization for trend displacement.
Simple slope-based regime interpretation.
Works well as a trend overlay or bias filter.
Limitations
Slope flips can still whipsaw in sideways markets.
Large wick bars can influence the filter strongly because True Range is used as weight.
It does not measure volume, despite using a VWMA-style internal function.
It is a trend tool, not a complete trading system.
Best use case
Volatility Hull Ribbon works best when used as a visual trend structure layer:
Use color for bias.
Use ribbon expansion/compression for strength.
Use slope flips for regime transitions.
Use price interaction with the ribbon for pullback context.
Summary
Volatility Hull Ribbon is a Hull-style trend overlay that replaces traditional weighting with True Range weighting, making the moving average more responsive to volatility-backed price movement. It builds a low-lag volatility-weighted Hull curve, compares it to a delayed smoothed reference to form a ribbon, and uses slope changes to define trend direction and signals. The result is a clean, responsive trend ribbon that highlights when volatility-backed trend pressure is rising, fading, or reversing. Indicador

Hull MA Trend Zones [AGPro Series]Hull MA Trend Zones
📌 Overview
Hull MA Trend Zones is a premium HMA trend overlay built for traders who want a cleaner way to read Hull Moving Average direction, slope quality, and pullback behavior.
The script is centered on one clear idea: a strong HMA trend should not only move above or below a moving average; it should show measurable slope, orderly ribbon structure, and controlled pullback behavior around the active HMA path.
Instead of presenting a crowded moving average wall, the script uses a focused three-line HMA structure, a subtle pullback band, and concept-native trend zones that are tied directly to the active Hull MA state.
⚙️ How It Works
The engine calculates a fast HMA, an anchor HMA, and a slow HMA.
The anchor HMA is the main decision line. Its slope is normalized with ATR so the script can judge whether the current Hull MA movement is weak, transitional, or directional.
The ribbon structure then checks whether the fast, anchor, and slow HMA lines are aligned. This separates clean trend movement from mixed or unstable movement.
Finally, the pullback layer evaluates whether price is extending away from the HMA, testing the HMA zone, holding the HMA zone, rejecting from the HMA zone, or failing the active trend path.
🧭 What The Script Shows
- HMA ribbon for clean trend direction.
- ATR-based HMA pullback band around the anchor HMA.
- Rectangular HMA slope zones created from active directional states.
- Confirmed, quality-gated Bull Turn and Bear Turn labels.
- Optional Hold and Reject labels for pullback events.
- A compact AGPro panel with HMA State, Slope Strength, Pullback Status, and Quality Score.
📊 AGPro Panel
The panel is designed for fast scanning without taking over the chart.
HMA State shows whether the active read is bullish, bearish, transitional, or neutral.
Slope Strength converts the anchor HMA slope into a clear percentage-style reading.
Pullback Status explains whether price is extending, testing, holding, rejecting, or failing the HMA trend zone.
Quality Score combines slope strength, ribbon alignment, and pullback behavior into a single 0-100 reading.
🎯 What Makes It Different
Hull MA Trend Zones is not a generic moving average ribbon, not a ribbon compression map, and not a broad support/resistance tool.
Its focus is narrower and more practical: HMA slope, HMA trend-zone behavior, and pullback-to-HMA quality.
The rectangular zones are not drawn as generic support or resistance. They are HMA slope zones created from the active trend state and the ATR-sized HMA pullback area. This keeps the script visually useful while avoiding overlap with broader zone, corridor, or compression-style indicators.
The default visual design is intentionally restrained. Pullback labels are optional, turn labels require confirmation and a minimum quality score, and old zones are capped so the chart keeps a cleaner premium look on both intraday and higher-timeframe charts.
🔧 Key Settings
Fast HMA Length controls the responsive side of the ribbon.
Anchor HMA Length controls the main trend path, slope state, pullback band, and panel logic.
Slow HMA Length helps identify whether the HMA ribbon is aligned or still transitional.
Slope Lookback and Trend Slope Threshold control how selective the HMA state engine is.
Zone Width ATR controls the height of the HMA pullback band and slope-zone area.
Zone Forward Bars controls how far the active slope zone projects while the same trend state remains valid.
Turn Confirmation and Minimum Turn Label Score control how selective the default turn labels are.
Label Cooldown Bars, Max Visible Labels, and Label Offset ATR keep chart density suitable for publication-quality screenshots.
Panel Location, Panel Theme, Label Font Size, and Panel Font Size are adjustable.
✅ Suggested Use
Use Hull MA Trend Zones to study trend continuation, Hull MA pullback quality, HMA slope transitions, and cleaner moving-average trend behavior.
It is especially useful when you want an HMA-focused overlay that remains readable on active charts and avoids the clutter of large multi-average systems.
The script is designed as a public-free AGPro Series tool with a clean visual identity, a focused HMA concept, and a TradingView-safe publication structure. Indicador

Indicador

Indicador

Hyperbolic Hull Moving Average (HHMA) [QuantAlgo]🟢 Overview
Hyperbolic Hull Moving Average is a trend-following indicator that replaces the linear weighting kernel inside a Hull Moving Average with a hyperbolic sine function, producing a moving average that concentrates weight on recent bars in a non-linear, exponentially accelerating curve rather than a straight ramp. Where a standard WMA assigns weight proportionally across the lookback, the sinh kernel creates a steep recency gradient that responds meaningfully to genuine momentum shifts while remaining more resistant to brief noise spikes, because distant bars lose influence at a compounding rate rather than a constant one. The result is a Hull-style construction with faster directional detection and smoother curvature than its conventional counterpart.
🟢 How It Works
The indicator is built across three passes of the same sinh weighting function. The core kernel computes a weighted average where each bar's weight is determined by the hyperbolic sine of its normalized position within the lookback, scaled by a tension parameter:
float _x = (_len - i) / _len * _t
float _w = (math.exp(_x) - math.exp(-_x)) / 2
Higher tension values push more of the total weight toward the most recent bars. At the default tension of 2.0 across a 24-period window, the most recent bar carries roughly 44 times the weight of the oldest bar. A standard WMA across the same window would assign the newest bar only 24 times the weight of the oldest, so the sinh kernel naturally produces a steeper bias toward recent price action at any equivalent length setting.
The Hull construction then runs two sinh-weighted averages at different periods, a fast pass at half the length and a slow pass at the full length, before combining them in the same denoising formula Alan Hull originally described:
fastSinh = f_sinh_weight(src, halfLen, tension)
slowSinh = f_sinh_weight(src, length, tension)
rawHull = 2 * fastSinh - slowSinh
hhma = f_sinh_weight(rawHull, sqrtLen, tension)
The raw Hull output is then passed through a final sinh-weighted smoothing pass at the square root of the full length, which removes the lagging noise the doubling step introduces.
Trend direction is determined by a simple slope check on the final output. This keeps state detection clean and unambiguous, with direction changes triggering alerts and visual updates the bar they occur.
🟢 Signal Interpretation
▶ Bullish Trend (Rising HHMA, Green): When the HHMA turns upward, all visual elements switch to the bullish colour, indicating a confirmed uptrend. Because the sinh kernel front-loads weight on recent bars, the line responds quickly to genuine upside momentum without needing price to sustain a move for many bars before registering a directional shift. Trend state remains bullish on each subsequent bar the HHMA continues to rise, allowing traders to hold positions through normal intra-trend oscillation without being shaken out by minor hesitations in the line.
▶ Bearish Trend (Falling HHMA, Red): When the HHMA turns downward, all visual elements switch to the bearish colour, confirming a downtrend or a breakdown from a prior uptrend. The same recency weighting that accelerates bullish detection also means the line will respond relatively quickly to sustained selling pressure, reducing the lag that causes conventional Hull variants to stay bullish well into a reversal. The trend remains bearish on each bar the HHMA continues to fall.
🟢 Features
▶ Preconfigured Presets: Three optimised parameter sets cover different trading approaches. "Default" is calibrated for swing trading on 4-hour and daily charts, balancing responsiveness with noise rejection. "Fast Response" shortens the lookback and increases recency bias for intraday and scalping use on 5-minute to 1-hour charts. "Smooth Trend" extends the period and flattens the weighting curve for position trading on daily and weekly charts where fewer, higher-conviction direction changes are preferred.
▶ Built-in Alerts: Three alert conditions support automated monitoring without requiring constant chart supervision. "Bullish Trend Signal" fires on the bar the HHMA slope turns upward. "Bearish Trend Signal" fires on the bar it turns downward. "Trend Direction Changed" covers both transitions with a single alert for traders who want a unified notification regardless of direction.
▶ Visual Customization: Six colour presets (Classic, Aqua, Cosmic, Cyber, Neon, and Custom) provide coordinated bullish and bearish colour pairs suited to different chart themes and backgrounds. Optional bar colouring tints price bars with the active trend colour at an adjustable transparency level, offering immediate visual confirmation of trend state across all open chart timeframes without requiring the indicator line itself to be in view.
Indicador

Indicador

Apex Engine Multi TrailApex Engine Multi Trail- Publication Notes
📖 Overview & Philosophy
Apex Engine V7.0 is not just an indicator; it is a complete, state-driven trading system designed for intraday and swing traders who demand precision, transparency, and adaptability. Unlike simple moving average crosses, this engine uses a multi-layered confirmation architecture to filter out market noise and identify high-probability trade setups.
The core philosophy is "Confluence before action." A trade is only considered when a Primary Trigger (direction) aligns with a Secondary Filter (strength/context) and respects market structure through ORB (Opening Range Breakout) logic. Once in a trade, the engine manages it intelligently using your choice of four distinct Trailing Stop Loss (TSL) methods, each suited to different market personalities. The comprehensive dashboard provides real-time transparency into the engine's "thought process," making it an ideal tool for both manual traders and those seeking to automate with webhooks.
⚙️ 1. Settings & Inputs - A Detailed Guide
Every input in this script serves a specific purpose. Here’s what they do and why you need them:
Group 1: Strategy Selection
Primary Trigger: This is the foundation of your trade direction. It decides whether the market is bullish or bearish.
Supertrend on HMA: Applies the Supertrend formula to a Hull Moving Average (HMA) of the close. It's smoother and more responsive than a standard Supertrend, reducing whipsaws.
Standard Supertrend: The classic, well-known Supertrend indicator based on closing prices. It's reliable for capturing strong trends.
HMA Direction: Simply checks if the Hull Moving Average is sloping up or down. This is the purest, most basic trend filter.
Secondary Filter: This acts as a confirmation mechanism. It ensures the market environment supports the primary signal, adding a crucial layer of safety.
VWAP (Volume Weighted Average Price): An institutional benchmark. A primary Bullish signal above VWAP suggests strong, volume-backed buying pressure.
ADX Strength (Average Directional Index): Measures trend strength, not direction. It confirms if the trend detected by the primary trigger is worth trading.
None: Disables the secondary filter, relying solely on the primary trigger.
Group 2: Visual Settings
Simple checkboxes to toggle chart elements on/off. HMA Momentum Band provides a visual envelope of trend momentum, while the Colored VWAP and Supertrend Line help you visually confirm signals. Color Background by Trend paints the chart for an instant visual assessment of the primary trend.
Group 3: Dashboard Layout & Size
Controls the look and position of the information panel. You can choose its size (Tiny to Large), position (e.g., Top Right), and which sections of the dashboard are visible (Logic, Stats, Running Trade).
Group 4: Core Indicator Settings
HMA Length: The lookback period for the Hull Moving Average. A larger value makes the HMA smoother and less sensitive.
Supertrend ATR Multiplier & ATR Length: Standard Supertrend parameters. A higher multiplier creates a wider band, making the trigger less sensitive but more reliable.
ADX Length & Min ADX Strength: Defines the period for ADX calculation and the minimum value required for the "Strong Trend" filter.
Group 5: Smart Entry Rules
Wait for Candle Close: When enabled, the strategy only acts on the confirmed close of a bar, preventing false signals from intra-bar wicks.
Opening Bar Breakout (ORB): A classic gap-and-go strategy. It uses the first candle's high/low as a filter, ensuring you only trade when price breaks out of its initial balance.
Bars to Wait after SL: A mandatory "cool-down" period after a stop loss is hit. This prevents emotional revenge trading and gives the market time to reset.
Smart Re-entry: An advanced feature that prevents re-entering a trade immediately after a stop loss. It waits for price to reclaim the HMA and make a new high/low, confirming momentum has returned.
Group 6: Time & Square-Off Settings
Essential for intraday traders. You can restrict entries to a specific Allowed Entry Window and, crucially, enable an Auto Square-Off to automatically exit all trades at a pre-defined time (e.g., 3:15 PM), ensuring you don't hold positions overnight.
Group 7: Dynamic ATR Ladder
These inputs define your initial risk (Initial SL) and the fixed step size (Target Step) for the Fixed Step Ladder trailing method. The values are multiples of the ATR at the time of entry, making your risk dynamically adjusted to market volatility.
Group 8: Trailing Stop Method
This is the heart of the trade management system. You can choose how the engine protects your profits.
🧠 2. Entry Logic: How a Trade is Born
A trade is not triggered by a single event but by a confluence of factors. The engine follows a strict checklist:
Primary Trigger Alignment: The market must be either Bullish or Bearish based on your chosen primary indicator.
Secondary Filter Confirmation: The secondary filter must agree. For VWAP, price must be on the correct side. For ADX, the trend must be "Strong."
ORB Condition: If enabled, price must have broken out of the first candle's range. This confirms a decisive move.
Cooldown Period: The engine must not be in a post-stop-loss waiting period.
Time Checks: The trade must be within the allowed session and before the square-off time.
Smart Re-entry Check: If recently stopped out, the market must show signs of reclaimed momentum.
Bar Confirmation: If enabled, the trade is only taken at the bar's close, ensuring the signal is valid.
Only when all applicable conditions are true will the engine execute a trade and print a "BUY" or "SELL" label on the chart. This rigorous process is designed to keep you out of low-probability, noisy market conditions.
📊 3. The Dashboard: Your Command Center
The dashboard is not just for show; it is a critical tool for transparency and trust in the system. It shows you the real-time state of every condition the engine checks, so you're never left guessing why a trade was or wasn't taken .
Trade Logic Monitor: Displays the status of the Primary Trigger, Secondary Filter, Wait Period, Bar Confirmation, and a final "Decision Monitor" that explains in plain English why the engine is flat or active (e.g., "FLAT - Cooling down post-SL").
Closed Trades Statistics: Tracks your performance in real-time, showing total trades, win/loss counts, win rate, and total points for both long and short positions.
Running Trade Monitor: For an active trade, this shows the entry price, current stop loss, the next target (or trailing value), unrealized points ("Run"), and most importantly, the Guaranteed P/L – the profit already locked in by the trailing stop.
This level of detail builds confidence and allows for post-trade analysis directly on the chart.
🛡️ 4. Trailing Stop Loss (TSL) Methods Explained
This is where you customize the engine's "personality." Each method has its own strengths and weaknesses, making the script adaptable to different trading styles.
Method How It Works PROs CONs
Fixed Step Ladder After entry, the first target is hit, stop moves to breakeven. After each subsequent target, the stop moves up by a fixed step_mult (based on entry ATR). Targets are plotted as "T1, T2, T3..." on the chart. Psychologically satisfying with clear targets. Excellent in strong trends as it locks in profits step-by-step. Can be too rigid in volatile markets. A sharp pullback could hit your stop even if the trend is still good. Underperforms in slow, grinding moves where price may not reach the next target.
ATR Trailing The stop is calculated as close - (current_atr * atr_trail_mult) for longs. It trails price continuously and is only raised (or lowered for shorts), never moved back. Highly adaptive to current market volatility. Gives the trade room to breathe in volatile conditions. Excellent for capturing massive trends. Can be too loose in very slow markets, giving back more profit than necessary. Susceptible to being stopped out by a single volatile candle if the multiplier is too small.
Parabolic SAR Uses the built-in Parabolic SAR indicator as the trailing stop. The SAR flips when the trend reverses. Simple and automatic. It accelerates as the trend gains momentum, tightening the stop. Works very well in strong, sustained trends . Notorious for whipsaws in sideways or choppy markets. The SAR can flip frequently, causing multiple small losses.
Moving Average Lowest For a long, the stop is the lowest low of the last N bars. For a short, it's the highest high. Excellent for range-bound or slowly trending markets. It gives the trade a lot of room. Very intuitive – it's like drawing a trend line under the recent price action. Horrible in fast, volatile trends. The stop will be left far behind, giving back a huge portion of profits. React slowly to sudden reversals.
🚨 5. Alerts & Webhook Automation
The script comes pre-configured with four specific alertconditions, making it plug-and-play for automated trading systems that use webhooks.
1. 🟢 ENTER LONG: Triggers when a new long position is opened. The message sent is: {"action": "buy", "ticker": "{{ticker}}"}
2. 🔴 ENTER SHORT: Triggers when a new short position is opened. The message sent is: {"action": "sell", "ticker": "{{ticker}}"}
3. ❌ EXIT LONG: Triggers when an existing long position is closed (by stop loss, square-off, or target). The message: {"action": "close_long", "ticker": "{{ticker}}"}
4. ❌ EXIT SHORT: Triggers when an existing short position is closed. The message: {"action": "close_short", "ticker": "{{ticker}}"}
You can easily create alerts from the TradingView interface using these conditions. The JSON format is clean and ready to be parsed by any trading bot or third-party automation service.
🧩 6. Final Usage Notes & Recommendations
Intended Market: This script is designed for liquid, trending instruments like Indices (NIFTY, BANKNIFTY, S&P 500), Forex majors, and large-cap stocks. It may perform poorly in highly choppy or illiquid markets.
Timeframe: Works on all timeframes, but performs best on 5-minute to 1-hour charts for intraday trading. For swing trading, 1-hour to daily charts are recommended.
Risk Management: The dashboard's Guaranteed P/L is your best friend. Always be aware of your locked-in profit. Never risk more than 1-2% of your capital per trade.
Optimization: Start with the default settings. Use the dashboard to observe how the engine behaves. Only then should you tweak the ATR multipliers or step sizes to suit the specific volatility of your chosen asset.
By understanding each component of this engine, you move from being a passive user to an active, informed trader who knows exactly why your strategy behaves the way it does. Good luck and trade safe. 🚀
Indicador
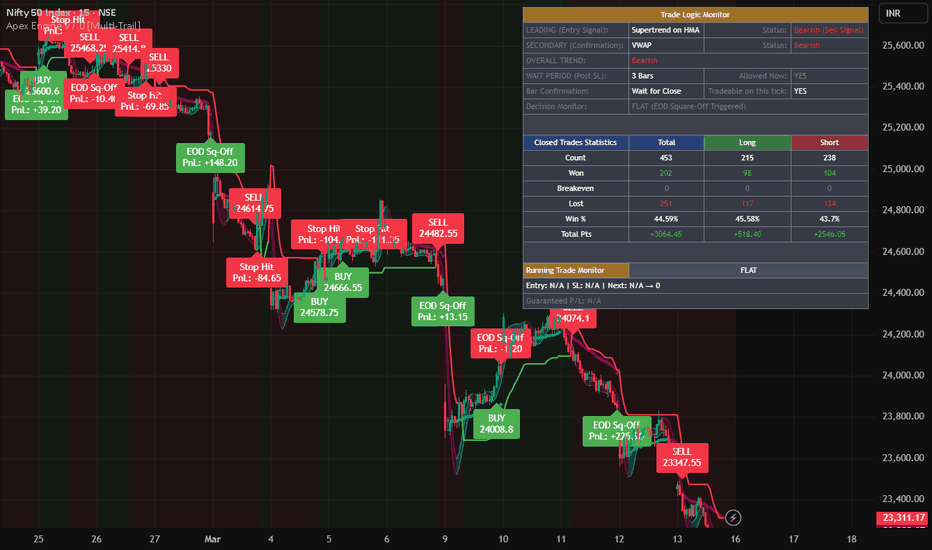
Indicador

Indicador

Indicador

Indicador