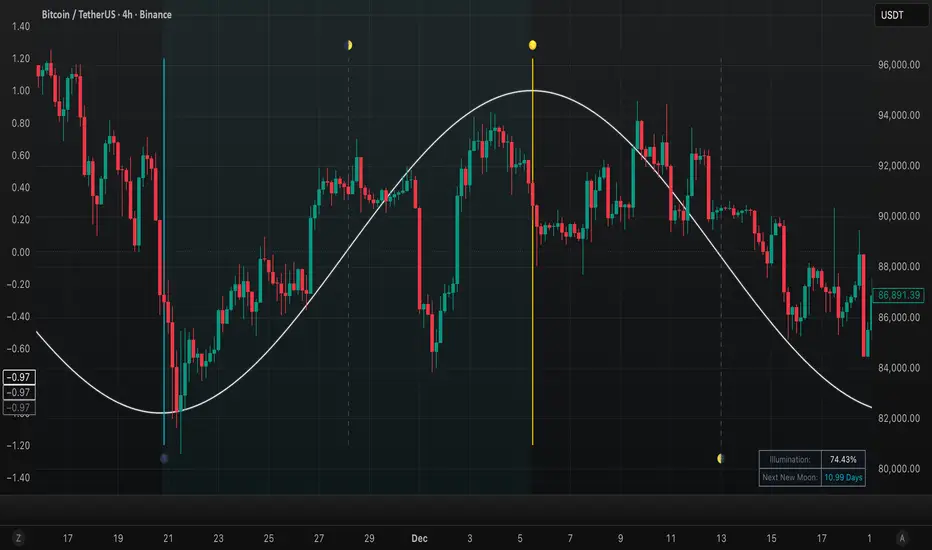
Lunar Cycle Oscillator [PyraTime]The Lunar Cycle Oscillator V1 is a predictive, timeframe-agnostic visualizer designed for traders who utilize Gann theory and astronomical cycles. It plots the Moon’s exact ~29.53-day synodic phase as a fluid, oscillating wave. Designed with a premium dark-mode aesthetic (Navy, Grey, Cyan, and Gold), it provides immediate visual context for market turning points aligned with lunar events.
Core Features
Neon Glow Wave: A multi-layered, silver-core sine wave that oscillates between -1.0 (New Moon) and 1.0 (Full Moon).
Precision Pulse Markers: Vertical event lines for Full Moons (Gold), New Moons (Cyan), and Quarter Moons (Dashed Grey).
Future Projections: Automatically forecasts the exact timing of the next three lunar phases into the future chart space at 70% transparency.
Dynamic Background Shading: Subtle pane shading that transitions between deep navy (Waning) and faint cyan (Waxing) to frame the oscillator.
Live Data Table: A real-time HUD displaying the current lunar illumination percentage and a day-countdown to the next major phase.
Integrated Alerts: Ready-to-use alert conditions for all four major lunar phase transitions.
Mathematical Methodology & Engineering
This indicator bypasses standard bar-counting limits. Instead of relying on relative bar references (which break on different timeframes), it calculates the exact astronomical phase using a known historical New Moon UNIX timestamp combined with the length of a synodic month in milliseconds.
Crucially, this script completely eliminates the Floating Indicator Issue. By anchoring every single line, label, and future projection strictly to xloc=xloc.bar_time, graphical objects will never detach, drift, or freeze in mid-air when panning or zooming. They are permanently locked to their exact moment in historical or future time.
Understanding "Jagged" Waves on Certain Assets
If you apply this indicator to a 5-day-a-week asset (like Gold, Forex, or traditional equities), the sine wave may occasionally look "chopped" or jagged at the peaks and troughs.
The Cause: The lunar cycle continues over the weekend, but the market does not. If a Full Moon peaks on a Saturday, the chart draws a rigid, straight line from Friday's close directly to Monday's open, cutting off the smooth weekend curve.
The Verification: To see the pure, mathematically perfect sine wave, apply the indicator to a 24/7 asset like Bitcoin (BTCUSD), where no weekend X-axis gaps exist.
Recommended Chart Setup (TradingView)
To achieve the optimal visual aesthetic and minimize chart gaps, apply the following settings to your TradingView chart:
Hide Background Grid Lines: The neon glow effect looks best on a clean, dark canvas. Right-click your chart background, select Settings, navigate to the Canvas tab, locate Grid lines, and drop the opacity slider down to 0% (or set them to match your exact background color).
Enable Extended Trading Hours (ETH): To smooth out the wave on traditional markets by filling in missing data gaps, turn on Extended Hours. Click the RTH / ETH button in the bottom right corner of your chart (next to the time zone) and select Extended Trading Hours, or go to Settings > Symbol and change the Session to Extended. Note: Pure weekend data availability depends entirely on your specific broker's feed. Indicador

Moon Declination & More [BlueprintResearch]🌒 MOON DECLINATION & MORE
A comprehensive lunar declination visualization showing Moon, Sun, and node declinations, with phase coloring, zodiac sign tracking, and future projections.
Part of the Blueprint Research open-source ephemeris project.
█ WHAT'S INCLUDED
• Moon Declination — The Moon's angular distance from the celestial equator, oscillating rapidly (~27 days)
• Sun Declination — Optional overlay showing the Sun's seasonal declination (±23.4°)
• Node Declinations — North (☊) and South (☋) node lines forming the Moon's orbital envelope
• Future Projections — Project all lines up to 500 bars into the future
• Zodiac Crossing Markers — Indicates when the North Node reaches a particular zodiac degree. Keep in mind, nodes move through the zodiac in reverse.
█ CONCEPTS
Declination measures how far north or south a celestial body appears from the celestial equator. The Moon's declination oscillates rapidly, while its maximum range shifts slowly over the 18.6-year nodal cycle.
Node Declination Envelope:
The North (☊) and South (☋) node lines mark the envelope of the Moon's orbit—the theoretical maximum northern and southern declinations the Moon can reach.
Lunar Standstills:
The 18.6-year nodal cycle determines when the Moon reaches its most extreme declinations. During a major standstill, the Moon can exceed ±28° declination. During a minor standstill, the Moon's range is limited to approximately ±18°.
Out-of-Bounds (OOB):
When the Moon moves beyond ±23.44° declination, it exceeds the Sun's maximum reach and is considered "Out of Bounds."
█ COLORING OPTIONS
Phase Coloring (Moon)
Color the Moon's declination line by lunar phase:
• New Moon (0-90°): Slate silver
• First Quarter (90-180°): Mint
• Full Moon (180-270°): Bright gold
• Last Quarter (270-360°): Soft violet
Zodiac Sign Coloring (Nodes)
Color the node lines by their zodiac sign. When enabled, a color legend appears at the top, showing all 12 signs for reference.
█ ZODIAC FEATURES
Zodiac Sign Coloring
Color the North and South Node lines according to their zodiac sign positions.
Zodiac Crossing
Marks when the North Node crosses a specific zodiac degree. Select any sign and degree (0-29) to track. The North Node moves retrograde through the zodiac over an 18.6-year cycle.
█ RESEARCH FEATURES
Standstill Thresholds
Horizontal reference lines at key declination levels:
• ±28.6° Major Standstill (peak of the 18.6-year cycle)
• ±18.3° Minor Standstill (trough of the cycle)
• ±23.4° Out-of-Bounds threshold
OOB Highlighting
Optional background shading when the Moon exceeds the OOB threshold.
Node Equatorial Crossings
Crosshair markers indicate when the node's declination crosses 0° (equatorial passage).
Reference Line Labels
Labels at projection endpoints with an adjustable offset for readability.
█ FEATURES
• Moon declination with optional lunar phase coloring
• Sun declination overlay
• North and South node declinations (☊ and ☋)
• Future projections up to 500 bars
• Zodiac sign coloring with a color legend
• Zodiac degree-crossing markers
• Node equatorial-crossing markers
• Out-of-Bounds background highlighting
• Reference line labels with offset control
• Customizable line widths and colors
• Informative tooltips for all settings
• Works on all timeframes
█ HOW TO USE
1 — Add the indicator to your chart
2 — Configure which elements to display (Moon, Sun, Nodes)
3 — Enable future projections to view upcoming declination values
4 — Enable Zodiac coloring to track node sign positions
5 — Set a Zodiac Crossing degree to mark when the North Node crosses that point
6 — Enable Standstill Thresholds to show reference lines
7 — Toggle phase coloring to visualize the lunar cycle
█ THEORY
Lunar Theory: ELP2000-82 by Chapront-Touzé & Chapront
Solar Theory: VSOP87 for Sun position and phase calculation
Reference: Meeus, "Astronomical Algorithms" (2nd Ed., 1998)
█ LIMITATIONS
• Truncated ELP2000-82 theory (~10 arcseconds precision)
• Future projections assume consistent bar timing
• Phase coloring uses 4 phases (not the 8 traditional phases)
• Mean nodes only (no perturbation corrections)
█ OPEN SOURCE
Blueprint Research Ephemeris Libraries:
• lib_elp2000_moon — Lunar position and mean node calculations
• lib_vsop_core — Solar position and coordinate utilities
• lib_ephemeris — Unified planetary API
Third-Party Libraries:
• hsvColor by @kaigouthro — HSV color utilities (MPL 2.0)
© 2025-2026 BlueprintResearch (Javonnii) • CC BY-NC-SA 4.0
Indicador

Biblioteca

Moon Phases & Declinations - Chronos Capital [BETA]High-Precision Lunar Cycles: Moon Phases & Declinations (Swiss Ephemeris)
Overview
This indicator provides institutional-grade astronomical data directly on your chart. Unlike standard scripts that use basic sine-wave approximations, this tool implements the **Swiss Ephemeris algorithm**, the gold standard for high-precision celestial calculations.
By tracking the Moon’s phases and its **Maximum/Minimum Declinations**, traders can identify potential "turning points" or "energy shifts" in market volatility often associated with lunar cycles.
---
Key Features
Ultra-High Precision: Calculations are accurate to within *seconds* of time, ensuring that the visual plot aligns perfectly with astronomical reality.
Moon Phase Tracking: Distinct markers for New Moon, Full Moon, and Quarters.
Lunar Declination Peaks: Automatically identifies when the moon reaches its *Maximum North* and *Maximum South* points (Lunar Extremes).
Customizable Visuals: Toggle between background highlights, vertical lines, or plot signals to suit your trading style.
---
Technical Accuracy
This script is built using a ported version of the Swiss Ephemeris
Positional Accuracy: Within 0.1 arcseconds.
Time Accuracy: Within **~1-2 seconds** of official JPL data.
Algorithm: Integration of the *ELP2000-85* lunar theory for maximum reliability over decades of historical data.
---
### **How to Use**
1. **Reversal Zones:** Watch for the Moon’s *Max/Min Declination* points, which often coincide with local tops or bottoms in trending markets.
2. **Volatility Shifts:** Use the *New Moon* and *Full Moon* markers to anticipate periods of increased or decreased market liquidity and volume.
3. **Confluence:** Best used in combination with your existing price action or momentum indicators to add a "time-based" filter to your entries.
*Disclaimer: This tool is for educational and analytical purposes only. Lunar cycles are a study of time-based correlation, not a guaranteed financial signal.*
Indicador

Indicador

Indicador
Estratégia
Indicador
Estratégia

Estratégia