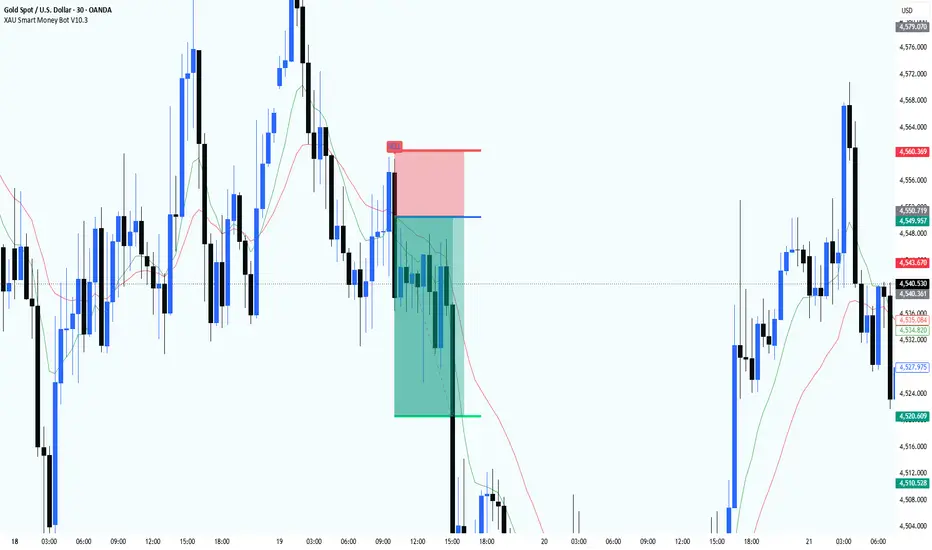
XAU Smart Money Bot V10.3 [SMC + EMA Confluence]XAU Smart Money Bot V10.3
XAU Smart Money Bot V10.3 is a Smart Money Concepts (SMC) based trading indicator designed specifically for Gold (XAUUSD).
The indicator combines multiple market structure and momentum concepts into a single confluence-based system to identify high-probability BUY and SELL opportunities.
Core Components
The script combines:
• 9 EMA / 21 EMA trend analysis
• Higher Timeframe Bias filtering
• Fair Value Gaps (FVG)
• Order Blocks (OB)
• Liquidity Sweeps
• Market Structure Shifts (BOS / CHoCH)
• Premium and Discount Zones
• Displacement Candles
• Volume Confirmation using OBV
• ATR Volatility Filter
The purpose of combining these concepts is to filter out weak setups and only generate signals when trend, liquidity, momentum and market structure align in the same direction.
Signals are generated only when several conditions align simultaneously, reducing low-quality entries and helping traders focus on stronger setups.
Unlike traditional SMC indicators that only display structure, this script combines Smart Money Concepts, EMA trend filtering, momentum confirmation and volatility filtering into a single scoring model. Signals are generated only when multiple conditions align, helping traders avoid low-probability setups.
This indicator is not a simple combination of existing tools. It uses a custom confluence model that evaluates trend direction, market structure, liquidity events, momentum and volatility conditions before generating a signal.
Signal Logic
The indicator evaluates multiple bullish and bearish factors and creates a score-based confirmation model.
A signal is generated when:
Trend direction agrees with higher timeframe bias
Market structure supports the trade direction
Momentum and displacement are present
Liquidity conditions are favorable
Volatility requirements are met
Entry System
Instead of using market execution, the indicator calculates a Smart Money style entry zone based on recent price action.
For every signal the script automatically plots:
• Entry Level
• Stop Loss Level
• Take Profit Level
The entry is designed to provide better risk-to-reward opportunities compared to chasing price after a signal appears.
Visual Features
The indicator displays:
BUY / SELL labels
Entry levels
Stop Loss levels
Take Profit levels
EMA trend structure
This allows traders to quickly evaluate potential setups directly on the chart.
Recommended Markets
Designed primarily for:
XAUUSD (Gold)
Recommended Timeframes
15 Minute
30 Minute
1 Hour
Risk Disclaimer
This indicator is intended for educational and analytical purposes only.
No indicator can predict market movements with certainty. Always use proper risk management and perform your own analysis before entering any trade. Indicador

Indicador

Ultimate Scalp MoBo + RSI + Mult-MA + MACD ConfigurationOverview
The Ultimate Scalp Configuration is a comprehensive trend-following and pullback execution system designed specifically for scalpers and day traders. Rather than simply overlaying indicators, this script synchronizes three distinct technical layers—Trend, Volatility-Adjusted Momentum, and Price Action—to identify high-probability entries at the precise moment a pullback ends and a trend resumes.
How It Works (The "Synergy")
This script uses a modular approach to filtering out "market noise," which is the primary challenge in lower-timeframe scalping:
- The Trend Layer (Multi-MA Engine): The script utilizes a fanned-out Moving Average structure (9, 50, and 200 lengths). Users can choose from 12 advanced MA types, including Zero-Lag EMA (ZLEMA) and Fractal Adaptive Moving Average (FRAMA). These are used to determine the "Path of Least Resistance." A signal only fires when the trend is perfectly aligned (Fast > Medium > Slow).
- The Volatility Layer (MoBo Bands): Momentum Breakout (MoBo) Bands are derived from Standard Deviation. They act as a volatility filter, ensuring that a "Buy" or "Sell" signal only occurs when the price has enough momentum to break out of its immediate value area.
- The Momentum Filter (RSI & MACD): To prevent "buying the top," the script cross-references the Relative Strength Index (RSI) and MACD Histogram. These ensure that momentum is not only trending but is actively accelerating in the direction of the trade.
- The Execution Layer (EMA Touch & Price Action): The primary trigger is a mean-reversion "touch" of the 9-period Fast EMA. To confirm the reversal, the script scans for one of eight institutional candlestick patterns (e.g., Morning/Evening Stars, Tweezers, or Pin Bars).
Key Features
- 12 Selectable MA Types: Adapt to different market conditions (Forex, Crypto, or Futures) by switching between GMA, VIDYA, KAMA, and more.
- Advanced Price Action Detection: Integrated logic for Hammer, Shooting Star, Tweezer, Inside Bar, and Dark Cloud patterns as signal requirements.
- Secondary Volatility Filters: Built-in ADX (Trend Strength) and ATR (Volatility) filters to keep you out of sideways, low-volume markets.
- Signal Cooldown: Prevents repetitive "over-trading" by enforcing a minimum bar distance between consecutive signals.
- Dynamic TP/SL Zones: The 50 and 200 MAs are highlighted as primary dynamic levels for taking profit or placing trailing stops.
How To Use
Identify the Trend: Ensure the 50 (Orange) and 200 (Blue) MAs are fanned out and the price is above/below them.
- Wait for the Pullback: Look for the price to return and "touch" the 9 EMA (Signal Line).
The Entry: Enter on the BUY or SELL label, which signifies that the pullback has met all MoBo, RSI, MACD, and Candlestick requirements.
- Management: Use the Orange MA (50) as your first Take Profit or "Break Even" zone, and the Blue MA (200) as your ultimate trend reversal stop. Indicador

Indicador

Indicador

Indicador

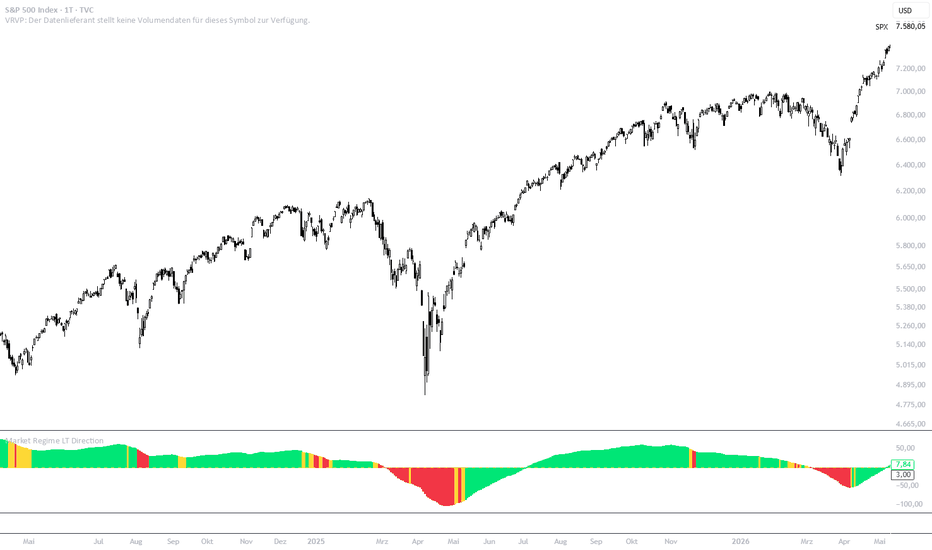
Market Regime LT Direction (Long-Term Objective Filter)Overview
The Market Regime LT Direction indicator is a heavy-duty, multi-factor scoring engine designed to identify the macro market regime. Unlike conventional indicators that rely on a single moving average, this script utilizes a sophisticated matrix of several distinct technical factors across different lookback periods to classify the long-term market environment.
To ensure absolute objectivity and eliminate the pitfalls of over-optimization, this indicator features a zero-input design — there are no parameters to tweak, giving you a robust, curve-fitting-immune view of institutional trend direction.
Why You Should Use This Indicator (The Value Proposition)
Traders often fail because they misjudge the macro environment. A system designed for a secular bull market will fail miserably when the macro regime shifts to a structural bear market or an extended sideways distribution.
Immunity to Curve-Fitting: By fixing the core mathematical constants, this indicator provides an unbiased, baseline truth of the market structure across any asset class (Equities, Crypto, Forex, or Commodities).
Multi-Factor Confluence: Instead of guessing based on a single line, it dynamically calculates a mathematical "Total Score" using trend persistence, moving average geometry, linear regression slope, and momentum.
Macro Filter for Portfolio Allocation: It is an excellent tool for swing traders and long-term investors to manage risk, determine position sizing, or implement an overall portfolio "Risk-On / Risk-Off" switch.
How It Works & Underlying Logic
The indicator separates its engine into two primary layers: a Visual Layer and a Scoring Layer .
1. The Visual Layer
The underlying histogram is a slow-moving, high-period MACD calculated on the typical price (hlc3). This smooths out micro-volatility and visualizes structural macro-momentum.
2. The Scoring Layer (Weighted Confluence Matrix)
The color of the histogram bars is dictated by a strict mathematical matrix. Factors are split into two categories and weighted based on macro relevance:
Low Relevance Score (Short-Term Confluence) like 20 EMA slope direction, fast MACD momentum slope changes and price location relative to the 50 EMA.
High Relevance Score (Long-Term Structure) like price location relative to the 200 SMA, 50 EMA location relative to the 200 SMA, recent swing high/low persistence over a 30-bar window and 100-candle Linear Regression slope.
The script combines these metrics into a standardized Total Score ranging between -3.0 and +3.0 .
How to Interpret It for Your Trading
🟩 Lime (Macro Bullish Regime — Score > 1): Complete structural alignment to the upside. Long-term institutional buying is in control. Aggressive Long bias / Risk-On.
🟥 Red (Macro Bearish Regime — Score < -1): Complete structural alignment to the downside. Macro distribution or a structural markdown is underway. Aggressive Short bias / Defensive capital preservation.
🟨 Yellow (Transitional / Sideways Regime): The factors are in conflict, or the macro trend is losing momentum. The market is consolidating or preparing for a regime shift. Neutral stance / Reduce position sizes / Expect choppy price action.
Pro-Tip: Pair this with the Market Regime ST Direction indicator. When the Short-Term indicator aligns with this Long-Term macro engine (e.g., both turning Green), you have a mathematically high-probability environment for trend-following expansions. Indicador
Market Regime ST Direction (Short-Term Filter)Overview
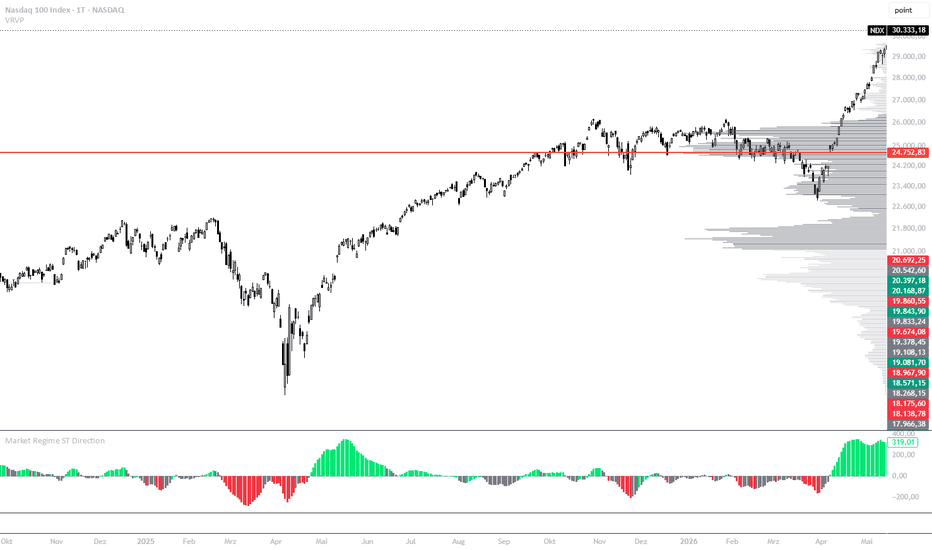
The Market Regime ST Direction indicator is a streamlined tool designed to identify the short-term market environment, specifically optimized for the Daily Chart . It serves as an über-clean trend and phase filter built to protect your trading strategy from taking unnecessary losses during difficult, choppy market conditions.
The indicator focuses exclusively on market direction , intentionally filtering out volatility noise and secondary market factors.
Why You Should Use This Indicator (The Value Proposition)
It is a fundamental truth in trading: no single strategy works in all market environments . Trend-following systems bleed capital in sideways ranges, while mean-reversion setups get destroyed in strong, runaway trends.
Smart Loss Filtering : This indicator helps you decide when not to trade. It identifies unprofitable market phases before your account takes a hit.
The Market Traffic Light : Use it as a higher-timeframe filter. Only allow long trades in the bullish (green) regime, short trades in the bearish (red) regime, and pause your strategy during the choppy (gray) regime.
Clarity Over Overtrading : With its clear, color-coded separation, you can instantly see whether the market has a clean directional bias or is caught in the "chop."
How It Works & Underlying Logic
The script intelligently decouples visual momentum from the actual trend regime logic:
The Visual Foundation (MACD Histogram) : The baseline visual consists of a classic MACD histogram calculated on the typical price (hlc3). This displays the current momentum of the market.
The Regime Filter (EMA Slope) : Crucially, the color of the bars is not determined by the MACD. Instead, it is driven entirely by the slope (steepness) of the fast 20 EMA.
The Noise Filter (Threshold) : To prevent the indicator from constantly flickering back and forth with minor price ticks, a percentage-based threshold (Sideways Threshold, default: 0.15%) is implemented. The market is only classified as trending when the EMA slope cleanly exceeds this threshold.
How to Interpret It for Your Trading
🟩 Lime (Bullish Regime) : The 20 EMA slope is strongly positive. The short-term trend is firmly up. Focus on Long setups.
🟥 Red (Bearish Regime) : The 20 EMA slope is strongly negative. The short-term trend is firmly down. Focus on Short setups.
⬜ Gray (Sideways/Chop) : The slope is too flat and remains within the threshold boundaries. Caution: This is where trend strategies usually experience their heaviest drawdowns. This is an excellent time to sit on your hands and wait on the sidelines.
Pro-Tip : Apply this indicator to the Daily chart of your favorite asset. If you trade a trend-following strategy on lower timeframes (e.g., 1H or 15M), strictly filter your entries based on the color of the Daily regime. Indicador
Indicador

Indicador

Indicador

Indicador

Indicador

Indicador
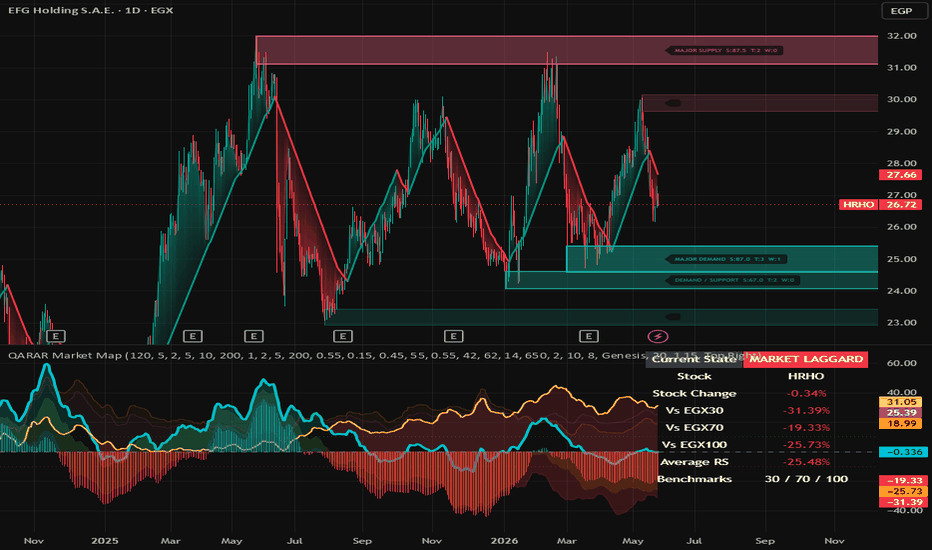
EMA Ribbon with ATR ExtensionsThis indicator is an EMA ribbon framework combined with multi-timeframe trend structure and volatility-normalized distance measurements using ATR.
The core component is a configurable exponential moving average ribbon, allowing multiple EMA lengths to be plotted simultaneously across different timeframes. This includes both intraday EMAs and optional higher-timeframe EMAs such as daily and weekly periods. The purpose of this structure is to provide a layered view of trend behavior across multiple time horizons, helping visualize alignment, compression, and expansion within broader market structure.
In addition to standard EMA visualization, the indicator integrates a volatility context layer using the Average True Range (ATR). This allows price distance from each EMA to be expressed not only in percentage terms, but also in ATR-normalized form. The ATR extension metric is derived from the relationship between percentage deviation from the moving average and current ATR percentage, enabling comparison of movement intensity across different instruments regardless of price scale.
The included table presents a structured breakdown for each selected EMA:
EMA value based on configurable length and timeframe
Percentage distance between price and each EMA
ATR-normalized extension value representing volatility-adjusted deviation
This structure allows users to observe how price interacts with multiple trend references simultaneously, while also understanding whether movement is occurring within normal volatility conditions or represents an expanded deviation relative to recent market behavior.
A visual marker is included to highlight conditions where price is significantly extended above a selected higher timeframe EMA relative to ATR-based expansion. This is intended to assist with quickly identifying periods of elevated trend extension within the broader EMA framework.
The header display optionally shows symbol, description, and active chart timeframe to maintain contextual awareness when analyzing multiple assets or timeframes.
Overall, the tool is designed as a multi-layer trend and volatility visualization system combining moving averages, relative distance metrics, and ATR-based normalization to better contextualize price positioning within ongoing market structure. Indicador

Indicador

Indicador

Moving Average Architect (MAA)Moving Average Architect (MAA) is a highly customizable moving average framework designed to help traders build, visualize, and analyze moving averages their way.
Create simple moving average layouts, high/low moving average zones, dynamic support and resistance bands, long-term trend structures, or fully custom moving average stacks.
Whether you prefer a single EMA, layered moving average ribbons, or multi-timeframe-style moving average zones, MAA gives you the flexibility to design the chart structure that best fits your trading style.
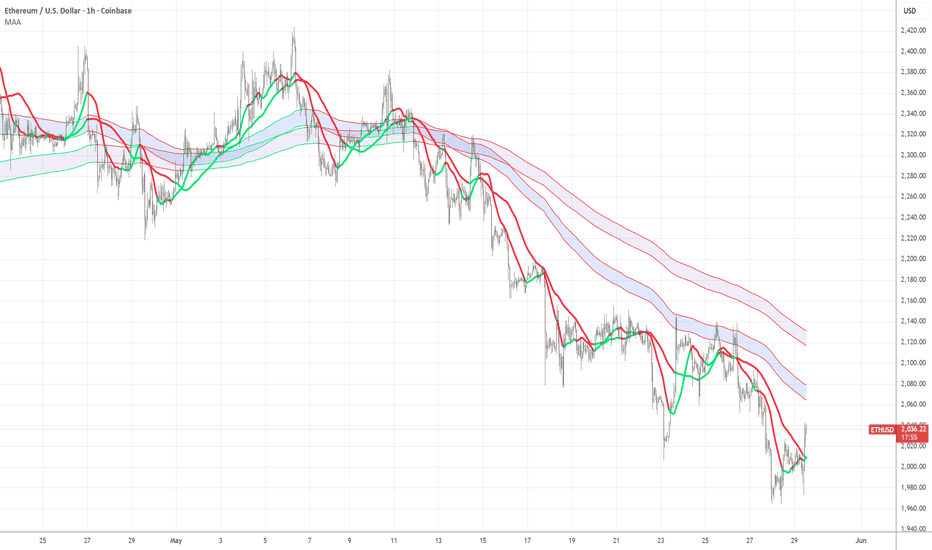
The example image demonstrates one possible Moving Average Architect setup using:
20 EMA and 50 EMA with Price Relative Coloring enabled
200 EMA High / Low zone
400 EMA High / Low zone
The short-term moving averages automatically change color based on whether price is above or below them, while the 200 and 400 EMA bands create dynamic support and resistance zones that can help visualize longer-term trend structure and areas of market reaction.
How To Use
Turn on any combination of up to 10 moving averages. For each MA you can configure:
Moving Average Type (SMA, EMA, SMMA/RMA, WMA, VWMA)
Price Source (Open, High, Low, Close, etc.)
Length
Color
Thickness
Line Style (TradingView Style tab)
Create Moving Average Lines or Zones. Enable shading between adjacent moving averages. Examples:
200 EMA High and 200 EMA Low with shading enabled between the high/low MA. Creates a dynamic moving average zone often used as support or resistance.
20 EMA Close and 50 EMA Close. Creates a short-term trend structure.
Enable Price Relative Coloring. Optionally color moving averages based on price position. This can make trend alignment and market structure easier to identify at a glance.
Above MA = Bullish Color
Below MA = Bearish Color
Key Trading Concepts
Moving averages are among the most widely used technical analysis tools.
Price above rising moving averages often suggests an uptrend.
Price below falling moving averages often suggests a downtrend.
Some traders find zones more useful than individual moving averages because markets often respect regions rather than exact prices.
Features
Up to 10 fully configurable moving averages
SMA, EMA, SMMA/RMA, WMA, and VWMA support
Configurable source selection
Dynamic moving average zones
Custom zone shading
Price-relative coloring
Adjustable line thickness
Adjustable line style
Overlay chart support
TradingView native alerts
Designed for trend, structure, and confluence analysis
Indicador
Indicador

Indicador

Indicador
Predictive SMA & BB■ Overview
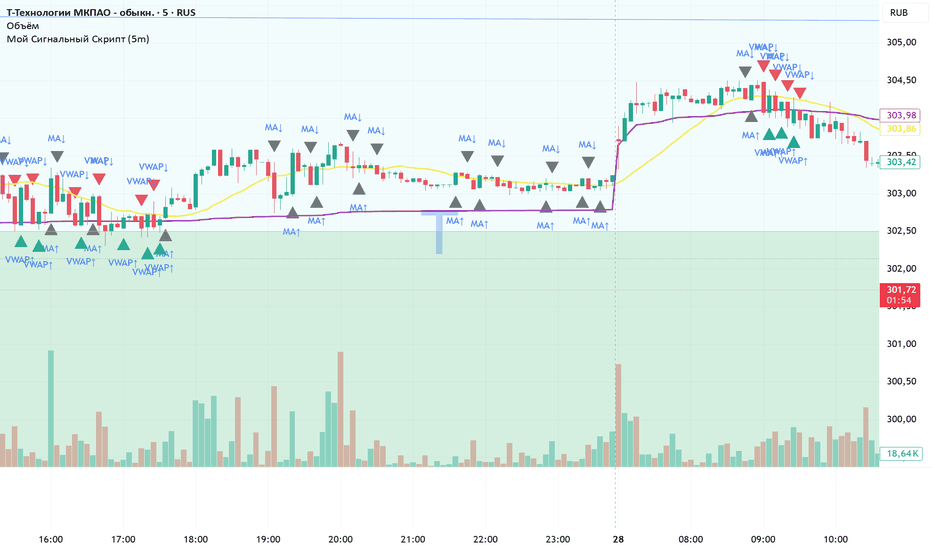
Most technical indicators are strictly lagging—they only tell you what has already happened. The "Predictive SMA & BB" flips this paradigm by projecting the Simple Moving Average (SMA) and Bollinger Bands (BB) into the future space of your chart.
This tool allows you to visualize where dynamic support and resistance (the statistical walls) will be in the future, giving you a massive edge in planning limit orders and understanding the element of "time" in your trades.
■ The Core Logic: Forward Fill & Sliding Window
How do we plot the future without a crystal ball?
This script uses a quantitative approach known as "Forward Fill". It simulates the passing of time by assuming the current price remains perfectly flat (sideways).
As it projects bars into the future, the algorithm drops the oldest historical data points from the calculation window (e.g., a 200-period window) and sequentially fills the new future slots with the current close price.
This reveals a powerful mathematical truth: Even if the price doesn't move, moving averages and standard deviations will shift based on the decay of historical data.
■ Key Features & How to Use
Future Baseline Projection: See exactly when a downward-sloping SMA will mathematically curl upwards as old, extreme price data is dropped from the calculation.
Time-Based Squeeze Anticipation: As future bars are populated with flat prices, the projected Bollinger Bands will naturally squeeze, visualizing the expected statistical boundaries if volatility dies down.
Custom UI: Fully customizable from the inputs panel. Toggle the future SMA, BB lines, and cloud fills, and adjust colors/opacity without touching the code.
■ ⚠️ Crucial Limitations & Disclaimers
To use this tool effectively, you must understand its mathematical limitations:
Not a Crystal Ball: This indicator projects a statistical baseline based on the assumption that current prices will maintain a zero-volatility trajectory.
Vulnerability to Volatility Expansion: The projected ±2σ bands do NOT account for sudden, explosive price movements (e.g., macroeconomic news, central bank interventions). If high-impact news hits and volatility expands, the actual bands will violently widen, overriding the projected squeeze.
Decreasing Confidence: The further you project into the future, the more the calculation relies on the "Forward Fill" assumption, naturally decreasing the statistical confidence of the extreme ends of the projection.
Use these projected lines as strategic zones for "waiting in ambush" during normal market conditions, not as absolute guarantees. Combine this with multi-timeframe analysis and your own price action strategies. Indicador

Estratégia