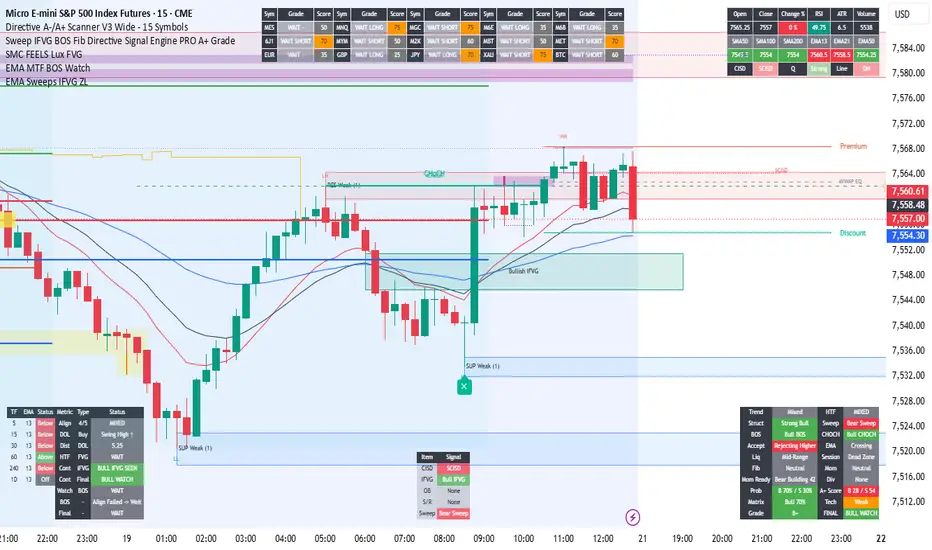
SwiftLevelsSwiftLevels is a clean, all-in-one overlay indicator that keeps the most important price reference levels and daily moving averages visible at a glance — without cluttering your chart.
━━━━━━━━━━━━━━━━━━━━━━━━━━━━━━━━━━━━━
PRIOR DAY & PRIOR WEEK LEVELS
━━━━━━━━━━━━━━━━━━━━━━━━━━━━━━━━━━━━━
On intraday charts, SwiftLevels draws horizontal lines for the prior day high/low and prior week high/low. Lines are anchored to the prior session's open so they don't clutter the left side of the chart. Labels float at the right edge of the current session and update each bar close to show the live percentage distance from price — positive when price is above, negative when below.
Example: PRIOR DAY (+1.24%) PRIOR WEEK (-0.87%)
Colors and label visibility are fully configurable per level group.
━━━━━━━━━━━━━━━━━━━━━━━━━━━━━━━━━━━━━
DAILY MOVING AVERAGES (5 fully configurable)
━━━━━━━━━━━━━━━━━━━━━━━━━━━━━━━━━━━━━
Five independent moving averages, each calculated from daily chart data regardless of your current timeframe.
On intraday charts:
• Each MA is drawn as a clean horizontal line starting at today's session open and extending right — no stair-stepping history, no noise from previous sessions.
• Labels appear just before the line starts, showing the MA name and live % distance from price, updated each bar close.
• Example: 20d SMA (+2.11%) 50d SMA (-0.44%)
On the daily chart:
• MAs are displayed as traditional full-history plots so you can see the curve over time.
• Can be toggled on/off with the "Display on Daily" checkbox.
On weekly/monthly charts:
• MAs are hidden to keep those timeframes uncluttered.
Each moving average is independently configurable:
• Enable / disable
• Length (default: 5, 10, 20, 50, 200)
• SMA or EMA toggle
• Custom color
• Line width Indicador

Indicador

Indicador

Indicador

KNN Machine Learning Mean Reversion Probability [Dots3Red]█ OVERVIEW
This script applies a K-Nearest Neighbors (KNN) machine learning algorithm to estimate the probability that price will revert to its moving average within a defined number of bars. Rather than predicting momentum direction, it asks a more specific question: how likely is it that this extension snaps back?
The model searches historical bars for situations that looked like the current one — same degree of stretch, same RSI exhaustion profile, same volume behavior — and measures how often those situations ended in a reversion to the basis MA. That proportion becomes the live probability shown on your chart.
█ METHODOLOGY
The indicator follows a supervised machine-learning pipeline with five distinct stages.
1 — Labeling (what we are predicting)
Each historical bar receives a label based on what actually happened next. If price was extended above the basis MA and touched it within the Reversion Window — that bar is labeled a successful reversion. If it did not touch — labeled as no reversion. The same logic applies from below. This is the core distinction from momentum KNN indicators: the target is reversion to fair value , not directional price movement.
2 — Feature engineering (what we measure)
Five features capture how stretched current price conditions are, each Z-score normalized to remove scale bias:
• MA Distance — signed % distance of close from the basis MA. The primary extension signal.
• Bollinger Band position — where price sits within the bands, normalizing extension relative to current volatility.
• RSI deviation — how far RSI has moved from neutral (50). Captures momentum exhaustion.
• Body compression — ratio of candle body to total range. Small bodies near extremes signal hesitation and loss of directional conviction.
• Volume fade — declining volume during an extension is a classic exhaustion signature.
3 — Z-score normalization
All five features are standardized using a rolling mean and standard deviation computed on prior bars only (look-ahead free). This ensures the KNN distance calculation is not biased by features of different scales.
4 — KNN engine
The algorithm scans the historical lookback window for the K most similar past bars, measured by Minkowski Distance across all five features simultaneously. Closer neighbors receive exponentially higher voting weight via a Gaussian Kernel , so the prediction is driven by the most relevant historical analogs — not a simple majority vote.
5 — Dual probability output
Two independent probabilities are maintained and tracked separately:
• P(reversion from above) — for overbought / extended-high setups.
• P(reversion from below) — for oversold / extended-low setups.
They are kept separate because bear-side extensions and bull-side extensions have statistically different behavior — bear moves are typically faster and sharper. A signal fires when the relevant probability crosses the user-defined threshold, and only when price is actually extended (see Extension Gate below).
█ WHAT MAKES THIS DIFFERENT
Most published KNN indicators predict momentum direction — will price go up or down next bar? This indicator predicts something more specific: will price return to its average?
The distinction matters for several reasons:
1 — A high momentum reading can persist for many bars. A stretched reading has a natural gravity pulling it back, and measuring the historical probability of that snap is a more tractable problem than direction forecasting.
2 — The two probability channels are trained on separate populations, accounting for the asymmetry between bull and bear extensions.
3 — The Extension Gate ensures signals only appear when there is actually something to revert from — no signals in flat, choppy, low-volatility conditions.
█ EXTENSION GATE
Even if the KNN model outputs a high reversion probability, no signal appears unless price is beyond Gate Multiplier × ATR from the basis MA. This prevents false signals in low-volatility or ranging conditions where mean reversion setups carry no statistical edge.
█ HOW TO USE
Signal shapes (▲ Rev / ▼ Rev)
Fire when P(reversion) crosses the threshold AND price passes the extension gate. The label at the signal bar shows the exact probability at the moment of firing.
Snap zone fill
When a signal is active, the region between current price and the basis MA is shaded. This is the reversion target zone — where price is statistically expected to return. The fill deactivates automatically once price reverts back through the basis.
Bar colors
• Bright green/red — active probability above the threshold on the current price side.
• Dimmed green/red — probability elevated but below threshold, approaching signal territory.
• No color — neutral or low reversion probability.
Background flash
A faint background confirms the exact bar on which a signal fired.
Recommended workflow
1 — Set the Basis MA to your preferred mean reversion average. EMA 20 is a common starting point for intraday and swing setups.
2 — Tune the Reversion Window to match your typical trade hold time in bars.
3 — Adjust the Extension Gate multiplier to the asset's volatility profile. Crypto typically requires higher values than forex or equities.
4 — Use the Probability Threshold to control signal frequency. 0.65 gives moderate frequency; 0.75 and above is more selective.
5 — Combine with volume analysis or candlestick confirmation at signal bars for additional confluence before entering a position.
█ SETTINGS REFERENCE
KNN Engine
• K Neighbors — how many historical analogs vote. Higher = smoother, slower to react.
• Lookback Window — size of the historical search space in bars.
• Reversion Window — bars within which price must touch the MA to count as a reversion.
• Minkowski p — distance metric exponent. 1 = Manhattan, 2 = Euclidean.
• Gaussian Bandwidth — controls how steeply neighbor weight falls with distance.
• Probability Threshold — minimum confidence required to show a signal.
Feature Settings
• Basis MA type / length — the fair value line all features are measured against.
• Bollinger Band mult — standard deviation multiplier for the BB position feature.
• RSI length — period for the RSI exhaustion feature.
• Volume MA length — baseline for the volume fade feature.
Extension Gate
• Require extension gate — toggle the ATR-based signal filter on/off.
• Gate band multiplier — how many ATRs from basis price must be before signaling.
• Gate ATR length — period for the ATR used in the gate calculation.
█ LIMITATIONS
• KNN is a lazy learner — it does not generalize beyond historical patterns in the lookback window. Strong trending regimes or structural breaks can produce elevated false signals.
• The reversion probability reflects historical frequency, not a guarantee of future behavior.
• On low-bar-count charts (e.g. weekly on newer assets), the lookback window may not contain enough samples to produce stable probability estimates.
• Computation scales with lookback window size. Very large windows may slow chart rendering.
█ DISCLAIMER
This indicator is a decision-support tool, not a trading system. It does not constitute financial advice. Always apply proper risk management and combine with your own analysis.
Algorithm: K-Nearest Neighbors (KNN)
Distance metric: Minkowski Distance
Preprocessing: Z-Score Normalization
Target: Probabilistic Mean Reversion Indicador

Indicador

Indicador

55 Moving Average Fan EMA 26/55/100/200 fan system. Cross signals, fan-out detection, EMA 55 retest entries, 200 EMA as invalidation line.
Three states: stacked bull (26>55>100>200, fanned out by min %), stacked bear (mirror), neutral. EMA 55 retests in a fanned bull state are buy opportunities; 200 EMA = SL invalidation.
How to use:
Best on daily ; also works on 4H
Look for "Cross up/down" labels at EMA 26/55 crosses
After fan-out, dip to EMA 55 = entry (triangle up/down marker)
SL below EMA 200 in bull regime, above in bear
Alerts: 26/55 Cross Up/Down, 55 Retest Buy/Sell, Bull/Bear Fan-out. Indicador

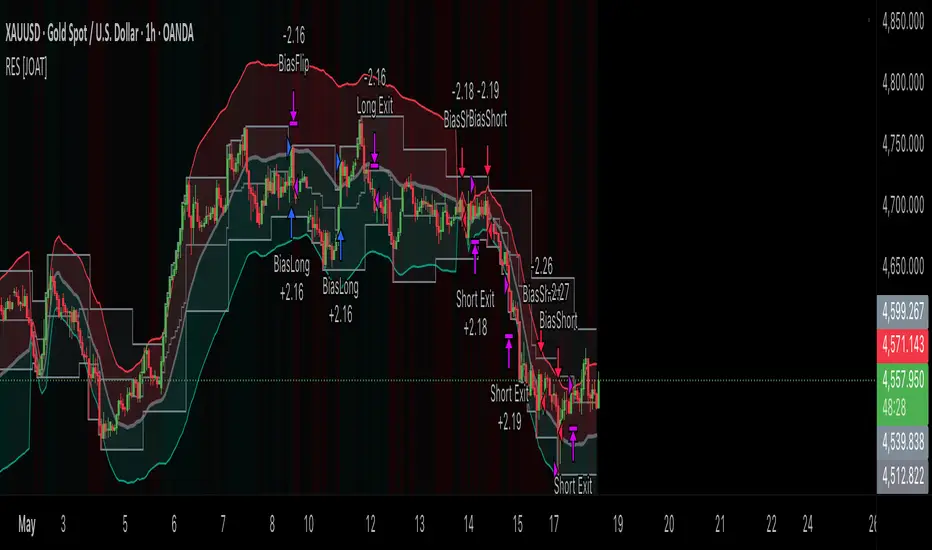
Regime Execution Strategy [JOAT]Regime Execution Strategy
Introduction
Regime Execution Strategy is an open-source TradingView strategy that integrates adaptive forecast context, extreme-channel state, trend pressure, relative volume, and EMA structure into a single rule-based execution model. The strategy is designed to be realistic, non-repainting, and readable rather than curve-fit to one symbol.
The problem it solves is trade filtering. A single signal source can trigger too often in poor conditions. Regime Execution Strategy requires multiple independent votes before entries are allowed, then uses ATR-based stop and target logic for consistent risk framing.
Core Concepts
1. Adaptive Forecast Bias
The strategy estimates a dynamic mean and band structure. Price above or below the adaptive mean contributes to directional bias.
2. Extreme Channel Bias
Persistent upper and lower channel levels define a midpoint and directional state. The channel contributes a second independent vote.
3. Pressure and Structure Gate
Momentum, pullback location, and fast/slow EMA structure contribute to the regime score. A minimum vote count and relative-volume filter are required before entry.
longSignal = barstate.isconfirmed and bullVotes >= voteThreshold and bullRegime and (longBreakout or longReclaim)
4. ATR-Based Risk Management
Stops and targets are derived from ATR and position average price. The strategy also includes max drawdown and max intraday filled order risk controls.
Features
Integrated regime detection: Forecast, channel, pressure, and EMA structure combine into a regime score
Multi-vote entry logic: Entries require several independent components to align
More active defaults: Default RVOL and regime thresholds are permissive enough to participate across many timeframes
ATR stop and target: Risk is framed with volatility-adjusted exits
Bias-flip exits: Positions can close when the opposing regime gains enough votes
Risk controls: Max drawdown and max intraday filled orders are included
Overlay visuals: Forecast bands and adaptive channel context can be displayed on chart
Top-right dashboard: Regime, score, pressure, RVOL, votes, position, band width, and setup
Alerts: Long and short setup events
Input Parameters
Forecast:
Source, Forgetting Factor, Regression Horizon, Band Multiplier, ATR Blend, and Rebase Interval
Regime:
Fast EMA and Slow EMA: Trend structure references
Pressure Length: Momentum and pullback window
Pressure Threshold: Minimum pressure vote threshold
Min RVOL: Participation filter
Min Votes: Minimum number of aligned components for entries
Risk:
Stop ATR: Stop distance multiplier
Target ATR: Target distance multiplier
Max Drawdown %: Strategy risk halt setting
Max Intraday Filled Orders: Limits daily trade frequency
How to Use This Strategy
Step 1: Read the dashboard regime before judging entries.
Step 2: Use votes and pressure to understand why a setup qualified.
Step 3: Review stop and target settings for the symbol and timeframe being tested.
Step 4: Evaluate results across multiple markets and date ranges, not one optimized window.
Strategy Limitations
This strategy is not optimized for a specific symbol or timeframe
More active defaults can increase trade count and also increase exposure to choppy periods
Backtest fills are simulated by TradingView and may not match live execution
All entry signals use confirmed-bar logic, so entries can occur after the intrabar move has begun
Strategy performance should be evaluated with realistic commission, slippage, and position sizing
Originality Statement
Regime Execution Strategy is original in its integration of adaptive forecast bias, extreme-channel state, pressure voting, relative volume gating, EMA structure, ATR exits, and dashboard reporting into one open-source strategy. It does not copy third-party source code.
Disclaimer
This open-source strategy is for educational and informational purposes only. It is not financial advice or a recommendation to buy or sell any instrument. Backtested results do not predict future performance. Trading involves substantial risk, and users are responsible for their own risk management.
-Made with passion by jackofalltrades
Estratégia

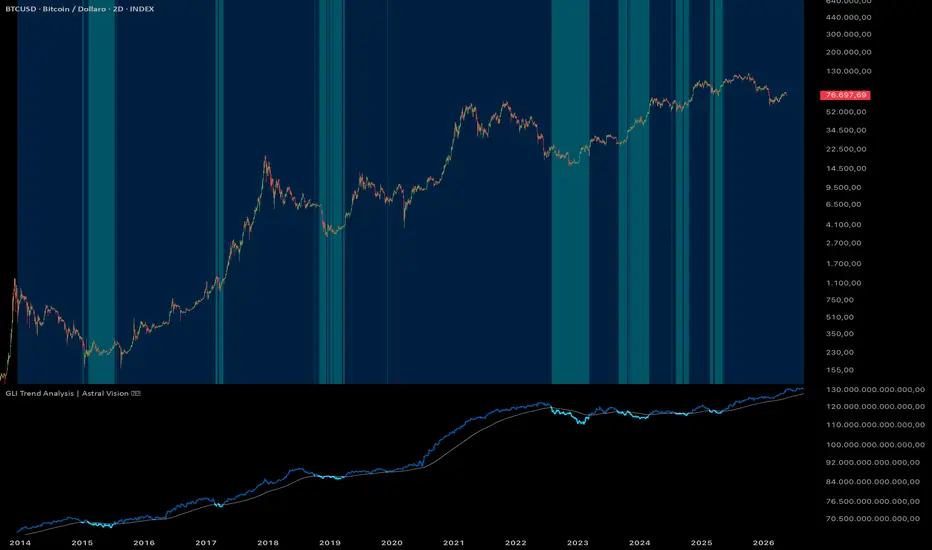
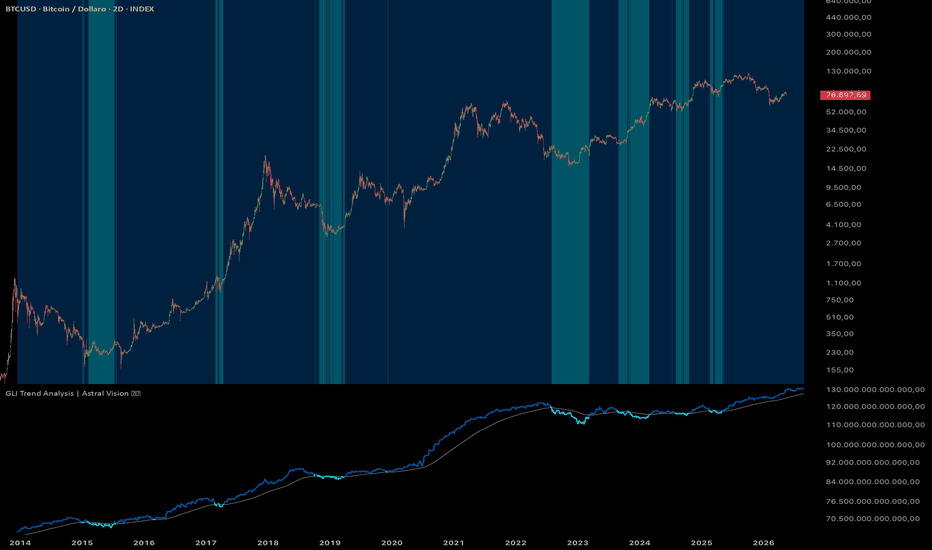
GLI Trend Analysis | Astral Vision GLI Trend Analysis | Astral Vision 🌠💠
This indicator plots the Global Liquidity Index and its exponential moving average, using the EMA crossover as a directional trend signal for the global monetary environment. The GLI is constructed from the same comprehensive 21-source aggregation used across the Astral Vision liquidity suite: 17 major central bank balance sheets converted to USD via live FX rates, minus the Fed's non-stimulative liabilities (Reverse Repo Facility and Treasury General Account), plus M2 money supply for the US, EU, China, and Japan.
Calculation ⚙️
The GLI is computed as:
Fed balance sheet, minus RRP (Reverse Repo: overnight cash parked at the Fed by money market funds, which drains liquidity from the financial system), minus TGA (Treasury General Account: the US government's cash balance at the Fed, which also drains liquidity when it grows), plus the balance sheets of the Bank of Japan, People's Bank of China, Bank of England, ECB, Reserve Bank of India, Bank of Canada, Reserve Bank of Australia, Swiss National Bank, Central Bank of Russia, Central Bank of Brazil, Bank of Korea, Reserve Bank of New Zealand, Sveriges Riksbank, and Bank Negara Malaysia, each converted to USD by multiplying by the corresponding live FX rate, plus M2 money supply for the US, EU (converted via EURUSD), China (converted via CNYUSD), and Japan (converted via JPYUSD).
The subtraction of RRP and TGA from the Fed balance sheet is a critical correction absent from simpler GLI implementations. The Fed's balance sheet includes liabilities that do not actually inject money into the financial system: when RRP balances are high, money market funds are lending cash back to the Fed overnight, effectively withdrawing it from circulation. Similarly, a growing TGA means the government is holding more cash at the Fed rather than spending it into the economy. Subtracting both produces a more accurate measure of net liquidity actually available to financial markets.
An EMA of configurable length is applied to the resulting GLI series. When GLI is above its EMA, global liquidity is in an uptrend relative to its own smoothed baseline, historically associated with expanding risk appetite and upward pressure on Bitcoin and other risk assets. When GLI is below its EMA, the trend is contractionary.
Both the GLI line and the background color on the price chart are shifted forward in time by a configurable offset in bars, operationalizing the empirically documented lead-lag relationship between global liquidity inflections and Bitcoin price response.
Plots 📊
GLI line colored by its position relative to the EMA, shifted forward by the configurable offset
EMA line as a neutral reference
Background color on the price chart reflecting GLI trend direction, shifted forward by the same offset
Inputs 🎛️
EMA Length: smoothing period for the GLI trend baseline
Lead Offset: bars to shift both the GLI signal and the background color forward in time
Colors 🎨
5 Astral Vision presets + custom override. Default: Infinito.
Purpose 🎯
A standard EMA crossover applied to Bitcoin price measures Bitcoin's own momentum without any external reference. This indicator applies the same crossover logic to global central bank liquidity, producing a regime signal that is causally upstream of Bitcoin price rather than derived from it. The forward shift separates this tool from coincident liquidity indicators by explicitly positioning the signal as a leading reference, reflecting the time lag between liquidity creation and its transmission into asset prices. The RRP and TGA correction further distinguishes it from simpler GLI charts available elsewhere, which overstate liquidity by including Fed liabilities that do not reach financial markets.
Disclaimer ⭕️
This indicator is for informational and educational purposes only. It does not constitute financial advice. Past performance is not indicative of future results. Always do your own research before making investment decisions. Indicador
Indicador

Mean Reversion at or under 200MAThis strategy is based on the 30 minute of the S&P futures chart, MES
A Long Buy will be executed if, the EMA 9 or price comes down to or under the 200 MA, AND THEN the slope of the ema 9 subsequently changes from negative to positive.
The buy will be executed either; at a retest of the local lows (defined by the lowest wick between the most recent red candle that is subsequently followed by a green candle) (a retest is defined as 70% retrace from the local highs (inversely defined from local lows) to the local lows), or if a retest of the lows fails to occur, a market order will be executed at the local highs.
With a fixed position size of 10 contracts, the take profits will be established as such; 2 contracts sold up 6 points of profit, the next two will be sold up 10 points of profit, and the remaining 2 contracts will be sold for 20 points of profit. As soon as the first trim is made, a stop loss is placed at break even. Further, as soon as the second trim is made, the stop loss will be moved to +5 profit points.
In the instance that the ema 9 returns to downward sloping, stop orders will be executed. This will trigger sells either at local lows or local highs.
Kind of just made this for a class project, but the logic is sound, and the results are formidable thus far - enjoy :) Estratégia

Indicador

Indicador

KOTANJAN HYPERMATRIX X(English Description)
KOTANJAN HYPERMATRIX X is a multi-layered market structure engine designed to analyze price behavior through a composite of momentum, volume, volatility, trend strength, and compression-expansion cycles.
Unlike traditional indicators that rely on a single mathematical model (such as RSI, MACD, or moving averages), this system integrates multiple independent market dimensions into one unified state engine.
CORE COMPONENTS
The system is built on six primary normalized market vectors:
ATR (Average True Range): Measures market movement intensity and volatility expansion.
Delta (Price Change Flow): Captures immediate directional pressure between candles.
OBV (On-Balance Volume): Tracks volume-driven capital flow into or out of price movement.
Momentum (ROC): Measures acceleration or deceleration of price movement.
Volatility Ratio: Identifies market instability relative to its own baseline behavior.
Trend Differential: Measures short-term directional bias using EMA spread structure.
These six components form the Market Matrix Core, representing the raw energy structure of price behavior.
FLOW STRUCTURE ENGINE
In addition to the matrix core, a secondary flow engine evaluates:
Multi-candle directional alignment (3-candle flow system)
Volume spike detection relative to dynamic average
Compression detection based on range contraction
This allows the system to distinguish between:
accumulation phases
breakout preparation phases
directional continuation phases
ADVANCED CONFIRMATION LAYER (KOTANJAN SYSTEM)
The distinguishing element of this indicator is the KOTANJAN System Layer, which enhances probability accuracy by adding adaptive market filters:
ADX (Trend Strength Filter): Determines whether market movement is structurally valid or noise-driven.
MACD Histogram (Momentum Continuation): Confirms whether directional pressure is accelerating or weakening.
RSI (Exhaustion Filter): Identifies overbought/oversold zones and reduces probability distortion during extreme conditions.
These filters do not replace the core matrix. Instead, they act as a probability refinement layer that adjusts market bias based on structural confirmation.
MARKET STRUCTURE INTERPRETATION
KOTANJAN HYPERMATRIX X interprets market behavior as a dynamic system of:
Compression → low volatility, accumulation phase
Expansion → breakout or trend initiation
Extreme → potential exhaustion or reversal risk
This structure allows the system to detect hidden transitions that are not visible through single-indicator analysis.
PROBABILITY ENGINE
All components are merged into a unified scoring system that produces:
Bullish probability (%)
Bearish probability (%)
This is not a prediction model but a weighted state evaluation of current market conditions.
KEY DIFFERENCE
The main difference between KOTANJAN HYPERMATRIX X and traditional trading indicators is:
It does not analyze price as a single line.
Instead, it treats the market as a multi-dimensional energy system, combining:
price structure
volume flow
volatility compression
trend strength
momentum confirmation
into one unified behavioral engine.
🇹🇷 Türkçe Açıklama
KOTANJAN HYPERMATRIX X, piyasayı tek bir indikatör mantığıyla değil, çok katmanlı bir “piyasa durum motoru” olarak analiz eden gelişmiş bir yapı sistemidir.
Klasik indikatörler (RSI, MACD, MA vb.) sadece tek bir veri tipine odaklanırken, bu sistem fiyatı birçok farklı boyutta aynı anda değerlendirir.
TEMEL BİLEŞENLER
Sistem 6 ana normalize veri üzerinden çalışır:
ATR: Piyasanın hareket gücünü ve volatilite genişlemesini ölçer
Delta: Mumlar arası anlık yön baskısını gösterir
OBV: Hacim akışı ile para giriş/çıkışını takip eder
Momentum (ROC): Fiyat hızlanmasını veya yavaşlamasını ölçer
Volatilite Oranı: Piyasanın kendi ortalamasına göre dengesizliğini ölçer
Trend Farkı: EMA yapısı üzerinden kısa vadeli yön eğilimini belirler
Bu 6 veri birlikte Market Matrix Core yapısını oluşturur.
AKIŞ SİSTEMİ (FLOW ENGINE)
Bunun yanında ikinci bir yapı vardır:
3 mumluk yön akışı
hacim patlama tespiti
daralma (compression) analizi
Bu sayede sistem şunları ayırt edebilir:
birikim dönemleri
kırılım hazırlıkları
trend devam bölgeleri
KOTANJAN SİSTEM KATMANI (EN ÖNEMLİ FARK)
Bu indikatörü diğerlerinden ayıran en önemli bölüm KOTANJAN sistem katmanıdır.
Bu katmanda:
ADX: Trend gerçekten güçlü mü yoksa rastgele hareket mi?
MACD Histogram: Momentum devam ediyor mu yoksa zayıflıyor mu?
RSI: Aşırı alım / aşırı satım bölgelerinde risk filtresi
Bu üç yapı direkt olarak sinyal üretmez.
Sadece mevcut sistemi “doğrulayan veya zayıflatan” bir ağırlık mekanizması olarak çalışır.
MARKET YAPISI OKUMA MANTIĞI
Sistem piyasayı 3 temel fazda okur:
Compression (Daralma): düşük volatilite, birikim
Expansion (Genişleme): kırılım veya trend başlangıcı
Extreme (Aşırı durum): yorulma ve dönüş riski
Bu yapı sayesinde klasik indikatörlerde görülmeyen gizli geçişler yakalanır.
PROBABILITY MOTORU
Tüm sistem birleşerek:
Boğa yüzdesi
Ayı yüzdesi
üretir.
Bu değerler tahmin değil, mevcut piyasa durumunun ağırlıklı analiz sonucudur.
EN BÜYÜK FARK
KOTANJAN HYPERMATRIX X’in en önemli farkı şudur:
Fiyatı tek bir çizgi olarak analiz etmez.
Bunun yerine piyasayı:
fiyat yapısı
hacim akışı
volatilite daralma/genişleme
trend gücü
momentum doğrulaması
olarak çok boyutlu bir sistem şeklinde değerlendirir. Indicador

Elaris Smart Scalping IndicatorElaris Smart Scalping Indicator is a non-repainting trend and momentum scalping tool designed to help traders identify higher-quality buy and sell conditions using a structured confluence model.
The indicator combines EMA trend direction, RSI momentum, MACD histogram confirmation, volume strength, ATR volatility filtering, optional higher-timeframe bias, and session filtering into a clean signal-scoring system. Signals are confirmed only after candle close, helping reduce intrabar noise and repainting behavior.
It also includes visual TP/SL guide levels, trend background shading, buy/sell labels, alert conditions, and a compact dashboard showing trend state, HTF bias, RSI, ATR percentage, volume filter status, and signal score.
This tool is designed for scalping and short-term trading analysis across crypto, forex, indices, and other liquid markets. It is not financial advice and should be used with proper risk management and additional market context.
Key Features
Non-repainting confirmed buy/sell signals
EMA-based trend engine with adjustable strictness
RSI and MACD momentum confirmation
Optional higher-timeframe trend filter
Volume and ATR volatility quality filters
Optional session filter
Signal score system from 0–100
Visual entry, stop loss, TP1, and TP2 guide levels
Clean dashboard for live market state
Built-in TradingView alert conditions Indicador

Indicador

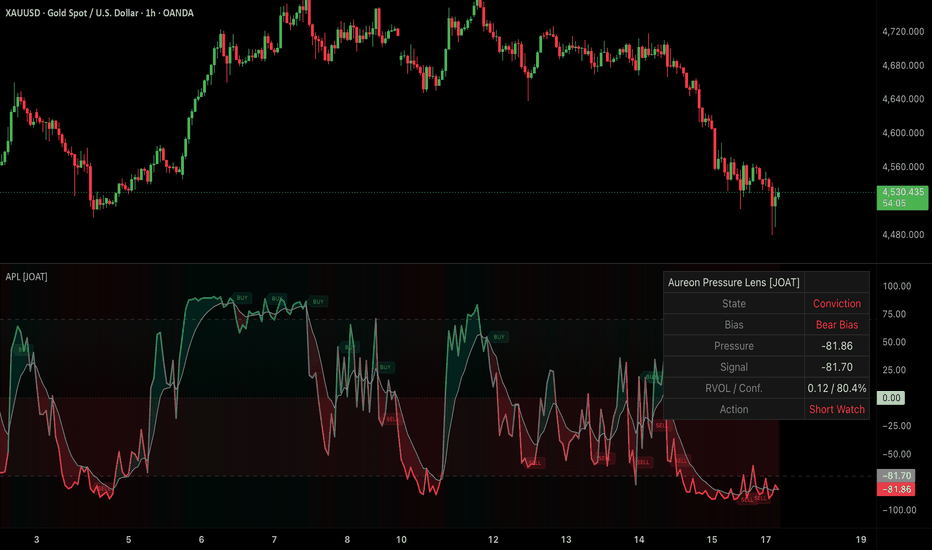
Aureon Pressure Lens [JOAT]Aureon Pressure Lens
Introduction
Aureon Pressure Lens is an open-source pressure oscillator designed to classify directional participation, conviction, and transition states in a separate pane. It blends price impulse, EMA structure, momentum, range location, candle body pressure, and relative volume into one bounded score.
The problem it solves is signal quality. A single oscillator can fire during weak, low-participation moves. Aureon Pressure Lens requires pressure, signal-line behavior, relative volume, and component consensus to align before confirmed buy or sell labels appear.
Core Concepts
1. Multi-Component Pressure Blend
The oscillator uses several independent inputs: impulse from prior price, fast/slow structural slope, normalized momentum, range position, and candle body direction.
2. Tanh Normalization
Each component is normalized into a stable bounded range so one volatile input does not dominate the entire reading.
pressureScore = f_tanh(pressureBlend * 1.60) * 100.0
signalLine = ta.ema(pressureScore, signalLength)
3. Consensus Filter
The confidence reading measures how closely the components agree. A signal must satisfy the minimum conviction threshold before it can print.
4. Relative Volume Participation
The script measures current volume against a moving average and uses that reading as a participation gate. The default is permissive enough for broad use while still filtering extremely quiet conditions.
Features
Separate-pane pressure score: Bounded -100 to +100 directional pressure reading
Signal line: Smoothed reference for pressure resets and crossovers
Gradient pressure color: Score color transitions between bearish, neutral, and bullish states
Pressure cloud: Optional fill between pressure and signal line
Confirmed BUY/SELL labels: Closed-bar events filtered by consensus and RVOL
Top-right dashboard: State, bias, pressure, signal, RVOL/conviction, and action
Alerts: Bullish and bearish confirmed pressure resets
Input Parameters
Calculation:
Core Lookback: Main analysis window for impulse and range context
Fast Lens / Slow Lens: EMA structure lengths
Signal Lens: Smoothing length for the signal line
Pressure Sensitivity: Normalization intensity
Min Relative Volume: Participation gate for labels
Min Conviction: Minimum component agreement required for labels
How to Use This Indicator
Step 1: Read the pressure score relative to zero.
Step 2: Use the cloud and signal line to identify pressure resets.
Step 3: Check dashboard conviction and RVOL before acting on labels.
Step 4: Combine with an overlay structure or regime tool for full chart context.
Indicator Limitations
The oscillator measures current pressure, not future price direction
Relative volume can behave differently on symbols with limited volume data
Choppy markets can create repeated signal-line crosses
Confirmed labels appear only after the bar closes
Originality Statement
Aureon Pressure Lens is original because it combines impulse, structure, momentum, range position, candle body pressure, relative volume, and component consensus into a single closed-bar pressure engine with a dedicated dashboard. It does not copy third-party source code.
Disclaimer
This open-source indicator is for educational and informational purposes only. It is not financial advice. Markets can change quickly, and no pressure reading guarantees a future move. Use risk controls and independent analysis.
-Made with passion by jackofalltrades
Indicador
Indicador

Indicador

Indicador

Indicador

Indicador