[Bitget] Moving Average Angle Slope Moving Average Angle Slope is a customizable multi-moving-average indicator designed to help traders quickly identify the directional slope of multiple moving averages.
The indicator supports up to 10 independently configurable moving averages. Each moving average can use a different length, type, color, and visibility setting.
A label is displayed beside each enabled moving average on the latest bar. The label shows the MA length, MA type, and a directional arrow to help visually identify whether the moving average is currently rising, falling, or flat.
Features
Supports up to 10 Moving Averages
Supports SMA, EMA, WMA, and RMA
Independent settings for each Moving Average
Custom MA length and color
Optional MA visibility control
Direction arrows displayed beside each MA label
Adjustable arrow lookback sensitivity
Adjustable minimum movement filter
Adjustable label position offset
Direction Arrows
Each Moving Average label includes one of the following directional arrows:
↑ Up Arrow: The Moving Average is currently trending upward.
↓ Down Arrow: The Moving Average is currently trending downward.
→ Flat Arrow: The Moving Average is relatively flat, or the movement does not exceed the selected minimum threshold.
The arrow direction is based on the current MA position relative to its previous values over the selected lookback period.
How to Use
This indicator is designed to provide a quick visual overview of moving average direction across short-, medium-, and long-term trend periods.
For example:
When short-term and long-term Moving Averages all display upward arrows, it may indicate broad bullish trend alignment.
When multiple Moving Averages display downward arrows, it may indicate bearish trend alignment.
When short-term MAs point downward while longer-term MAs remain upward, it may indicate a pullback within a broader uptrend.
When MA arrows shift from down to flat to up, it may suggest that downward momentum is weakening and the Moving Average direction is improving.
The indicator can be used on any market and timeframe, including cryptocurrency, stocks, forex, indices, commodities, and futures.
Suggested Use Cases
Trend Direction Confirmation
Use several Moving Averages with different lengths to quickly identify whether trend direction is aligned.
For example, traders may monitor short-, medium-, and long-term MAs together:
Short-term MA: 10 EMA or 20 EMA
Medium-term MA: 50 SMA
Long-term MA: 100 SMA or 200 SMA
If all selected MAs are showing upward arrows, the market may be in a broader upward trend. If all are showing downward arrows, the market may be in a broader downward trend.
Pullback Analysis
During an established trend, short-term Moving Averages may temporarily turn in the opposite direction while longer-term Moving Averages remain aligned with the primary trend.
For example:
Short-term MA shows a downward arrow.
Long-term MA continues showing an upward arrow.
This may indicate a short-term pullback within a larger uptrend. Traders can use this information alongside price action, support and resistance, volume, or other confirmation tools.
Multi-Timeframe Analysis
The indicator can be applied to different timeframes to help analyze market direction from different perspectives.
Example workflow:
Use higher timeframes to evaluate overall trend direction with longer Moving Averages.
Use lower timeframes to monitor short-term MA direction for potential timing and momentum confirmation.
A trader may look for longer-term Moving Averages to point upward on a higher timeframe, while waiting for short-term Moving Averages to turn upward on a lower timeframe.
Settings
Source
Selects the price source used for Moving Average calculations.
Common options include Close, Open, High, Low, HL2, HLC3, and OHLC4.
Arrow Direction Lookback Bars
Controls how many previous bars are used to determine the Moving Average direction.
A lower value provides faster and more sensitive arrow changes.
A higher value provides a smoother view of the overall MA direction and can reduce short-term noise.
Suggested values:
1 to 2 bars: More responsive for short-term trading.
3 to 5 bars: Smoother direction reading for swing trading.
5 or more bars: Better for broader trend direction analysis.
Minimum Movement in Ticks
Controls the minimum amount of MA movement required before displaying an upward or downward arrow.
Use a higher value to filter small fluctuations during sideways or low-volatility market conditions.
When the MA movement is below the selected threshold, the indicator displays a flat arrow.
Label Offset to the Right
Controls the horizontal distance between the latest price bar and the MA labels.
Increase this setting if labels overlap with candles, price scale elements, or other indicators.
Moving Average Types
SMA — Simple Moving Average
A commonly used Moving Average that provides a smooth view of overall price direction.
Suitable for medium-term and long-term trend analysis.
EMA — Exponential Moving Average
Places more emphasis on recent price movement and reacts faster than SMA.
Commonly used for short-term trend and momentum analysis.
WMA — Weighted Moving Average
Gives greater importance to recent prices and provides a responsive but smooth Moving Average.
RMA — Running Moving Average
A smoother Moving Average often associated with Wilder-style calculations.
May be useful for traders who prefer less reactive MA behavior.
Notes
This indicator is designed to visualize Moving Average direction, not to generate guaranteed buy or sell signals.
Moving Averages are lagging indicators and are based on historical price data.
Arrow direction can change as new price data becomes available.
Results may vary depending on market, timeframe, MA type, MA length, and selected settings.
This indicator may be more effective when combined with price action, market structure, volume, support and resistance, and risk management.
Disclaimer:
These indicator scripts are sample script templates for information only. Nothing herein shall be construed as financial or investment advice or solicitation to trade or use any service. Bitget does not guarantee the accuracy or completeness of any information provided.
Cryptocurrencies are subject to high market risks. Investors are strongly advised to conduct their own research and seek independent professional advice before investing at their own risk. Past performance or financial indicators are not reliable predictors of future performance. Bitget has no control over any third-party applications, such as TradingView, and is not responsible for any loss relating to any use of TradingView or these scripts. As a security measure, please use read-only API keys with no trading or withdrawal permissions. Indicador

OR Box + 15m EMA Reversal Signals (5m)A confluence-based reversal indicator built for 5-minute charts on SPY, QQQ, IWM, and SMH. It combines the opening range, a 15-minute EMA, and a two-step confirmation process to flag potential trend-continuation entries off intraday pullbacks.
How it works
Opening Range Box — Captures the high/low of the first 15 minutes of the regular session (9:30–9:45 AM ET by default, fully configurable) using true 1-minute data for accuracy regardless of your chart's timeframe. Each day gets its own box, drawn and color-coded, that stays fixed at its own historical price levels going forward.
15-Minute EMA — Plotted directly on the 5-minute chart via a multi-timeframe pull, colored green when the setup is bullish-armed, red when bearish-armed, and gray when neutral.
Armed state — The setup arms when the 15m EMA closes outside the opening range box (above for bullish, below for bearish). It disarms if price closes back inside the box or if the EMA itself drifts back into/through the box.
Touch + confirmation — While armed, a pullback candle touching the EMA on the 5-minute chart arms a pending signal. That signal only becomes a real, plotted arrow once the 15-minute candle containing that touch shows the same reversal pattern — a wick crossing the EMA with the close settling back on the trend side. This two-step check is designed to filter out weaker, single-timeframe pullbacks.
Trade validation — Every confirmed signal is tracked forward automatically: a green checkmark if price hits your configured target (dollar or percentage) before closing back through the EMA, or a red circle-slash if it doesn't (including a timeout after a configurable number of bars). A built-in success-rate table shows Bull/Bear/Overall win rates, filterable to a rolling lookback window or all-time.
Fully customizable: opening range window and session times, box/midline appearance, EMA length and colors, signal arrow colors, target type and size, label spacing, and table position/size.
⚠️ This indicator is for educational and informational purposes only. It does not constitute financial advice. Past signal performance shown in the success-rate table does not guarantee future results. Always do your own research and manage risk appropriately. Indicador

Alpha S/R Channel StrategyAlpha S/R Channel Strategy (ASRC)
Mean-reversion strategy trading pullbacks to a dynamic Higher Timeframe EMA channel. Confirms exhaustion via Engulfing & Pin Bar patterns, with Pin+Engulf combo overriding trend filters to capture institutional liquidity grabs. Features optional RSI, BB width, and inverted Squeeze Momentum filters. Includes adaptive position sizing, partial TP, breakeven stops, session trade limits, no-trade windows, day/weekend close, and Friday trading control.
📌 Strategy Overview
Alpha S/R Channel Strategy is a dual‑timeframe mean‑reversion strategy that identifies high‑probability reversal setups by combining a dynamic channel derived from a Higher Timeframe EMA with high‑conviction candlestick patterns (Engulfing and Pin Bar).
The strategy waits for price to retrace to a dynamic value area (the channel) and confirms exhaustion through candlestick patterns before entering—capturing pullbacks within the prevailing trend while avoiding counter‑trend trades.
🧠 Unique Edge – Why This Mashup Works
Most trend‑following strategies chase breakouts and get caught in false moves. Most engulfing strategies ignore the bigger picture and enter too early. This strategy solves both problems by combining these components in a specific sequence:
1. Dynamic EMA Channel (The Value Area)
Instead of using static support/resistance, the strategy constructs a dynamic channel around a Higher Timeframe EMA. The channel width adapts to volatility using three modes:
- Percentage – width as % of current price.(price * (channelWidthPct / 100) )
- ATR Multiplier – width based on ATR from the Higher Timeframe.
- Fixed – static price distance.
Why this matters: The HTF EMA represents the "fair value" or equilibrium price. When price pulls back to this zone, it's statistically more likely to resume the trend rather than reverse.
-------------------------------------------------------------------
2. Channel Break + Candlestick Confirmation (The Trigger)
The strategy enters only when price returns to the channel AND shows exhaustion:
- Bullish Engulfing – Current green candle engulfs previous red/small green candle
- Bearish Engulfing – Current red candle engulfs previous green/small red candle
- Pin Bar + Engulfing Combo – Pin bar sweeps recent high/low and is followed by an engulfing pattern
Why this matters: The channel provides the context (where price should reverse). The candlestick patterns provide the confirmation (that reversal is actually happening). Using both drastically reduces false signals.
-------------------------------------------------------------------
3. Optional Multi‑Layer Filters (The Quality Control)
The strategy includes configurable filters that can be enabled/disabled:
1- EMA Lower TF – Ensures micro‑trend alignment (longs above EMA, shorts below)
However, there is a critical override:
🔄 Pin Bar + Engulfing Combo OVERRIDES the EMA Confirmation
When a Pin Bar sweeps the N‑bar high/low (proving a breakout attempt failed) and is immediately followed by an Engulfing pattern on the next candle, this combo represents a "double confirmation" of exhaustion that bypasses the EMA filter.
Why this is a breakthrough:
Strong institutional reversals (liquidity grabs) often happen against the short‑term EMA trend. A pure trend‑following strategy with a strict EMA filter would miss these reversals because price is moving against the EMA.
2- Higher Timeframe EMA – Ensures long‑term trend alignment
This acts as a "trend filter on top of the trend filter" – preventing entries that go against the even larger market structure. Users can select a separate timeframe (e.g., 1H) with its own EMA length for additional confirmation.
3- RSI – Prevents buying above 70 and selling below 30
4- Bollinger Bands – Blocks entries during low volatility (sideways markets)
5- Squeeze Momentum – This strategy uses an inverted Squeeze Momentum logic:
"val < 0 → Longs allowed, Shorts blocked"
"val > 0 → Shorts allowed, Longs blocked"
"val == 0 → Both allowed"
This inversion is intentional. The strategy is mean‑reversion based—it waits for momentum to become overextended and then trades against that momentum
These filters are optional because different assets and market conditions require different levels of confirmation. The user has full control.
-------------------------------------------------------------------
4. Comprehensive Risk Management
The strategy includes:
- Position Sizing – Fixed percentage of equity per trade (separate for first and second entry)
- Pyramiding – Allows up to 2 positions in the same direction (second trade uses lower risk)
- Multiple SL Options – Low-High, Swing high/low, Channel, Fixed distance
- Trade Counter Reset – Resets at session starts for scalping timeframes, daily for swing
- No‑Trade Windows – Blocks entries during end‑of‑day volatility (active only for TF ≤ 15m)
- Day/Week End Closing – Closes positions before gaps (configurable by timeframe)
- Partial Take Profit – Closes a configurable percentage (default: 50%) at a specified R:R ratio (default: 1:2), allowing the remainder to run to the full target (default: 1:3)
- Breakeven Stop – Optionally moves the stop loss to breakeven when the first TP level is reached, protecting the remaining position from turning into a loss
Why this matters: The risk controls ensure survivability across different market conditions. Also Breakeven protection reduces the risk of winning trades turning into losers.
-------------------------------------------------------------------
📊 How It Works
1. Dynamic Channel Calculation
The strategy constructs a channel around an Exponential Moving Average (EMA) from a selected Higher Timeframe:
- EMA – Calculated on the Higher Timeframe
- Channel Width – Adaptive based on volatility (Percentage, ATR, or Fixed)
- Upper Band = EMA + (Width / 2)
- Lower Band = EMA - (Width / 2)
Channel Width Modes:
- Percentage – Width = Price × (User‑defined %)
- ATR Multiplier – Width = ATR(14) × Multiplier
- Fixed – Width = Static distance
-------------------------------------------------------------------
2. Entry Signal Detection
Trades are executed on the Lower Timeframe (default: 5m) when all conditions are met:
Pattern Requirements (One of the following):
- Bullish Engulfing: Current green candle completely engulfs previous bearish or small green candle
- Bearish Engulfing: Current red candle completely engulfs previous bullish or small red candle
- Pin Bar + Engulfing Combo: Pin bar sweeps recent high/low AND is followed by engulfing pattern (Overrides LTF EMA)
# Engulfing Filters:
Body Only – Only bodies must engulf (not full range)
Min/Max Range – Configurable via Percentage, ATR, or Fixed
Gap Allowance – Controls how much gap is allowed in the wrong direction
Previous Range % – Limits the size of the prior candle when it's in the same color
# Pin Bar Detection:
- Wick/Body Ratio (default: 3.0) – Wick must be 3× larger than body
- Max Body/Range (default: 0.20) – Body must be ≤20% of total range
- Min Wick/Range (default: 0.70) – Wick must be ≥70% of total range
- Sweep Lookback (default: 10 bars) – Pin bar must sweep a recent high/low
Min Pin Bar Range % – Pin bar must meet a minimum size threshold
# Channel Proximity:
Price must be within the channel boundaries (open inside)
-------------------------------------------------------------------
3. Confirmation Filters (All Optional)
- Lower Timeframe EMA : Longs require price > EMA; Shorts require price < EMA (overridden by Pin+Engulf combo)
- Higher Timeframe EMA : Ensures long‑term trend alignment (longs above HTF EMA, shorts below)
- RSI : Prevents longs above 70; Prevents shorts below 30
- Bollinger Bands : Blocks entries when BB width < threshold (low volatility)
- Squeeze Momentum : Ensures momentum matches trade direction (inverted logic)
-------------------------------------------------------------------
4. Risk & Position Management
# Position Sizing:
- First Trade – Fixed % of equity (default: 2%)
- Second Trade – Separate % of equity (default: 1%)
- Position size = (Account Risk) / (Entry – SL Distance)
# Friday Trading:
- Allow Friday Trading (default: Disabled) – When disabled, no new trades will be opened on Fridays. Existing positions are not affected. This helps avoid weekend gap risk as markets close for the week.
# Stop‑Loss Options:
1- Low-High : Entry bar low/high ± buffer
2- Swing high/low : N-bar low/high ± buffer
3- Channel : Channel band ± buffer
4- Fixed distance : Fixed price distance from entry
# Take Profit:
- Main R:R ratio (default: 1:3)
- Separate R:R for second trade (default: 1:3)
# Trade Counter Reset:
TF ≤ 15m – Resets at Asia (20:00 NY), London (03:30 NY), New York (09:30 NY)
TF > 15m – Resets once per day at session start
# No‑Trade Window:
- Active only for TF ≤ 15m (16:45–19:05 NY time)
- Protects against end‑of‑day volatility spikes
# Close All Positions:
- TF ≤ 15m – Can close at day end and/or week end (configurable)
- 15m < TF ≤ 240m – Week end only
- TF > 240m – Feature disabled
# Entry Spacing:
- Minimum Bars Between Entries (default: 4) – Prevents multiple entries on the same bar or too close together, reducing the impact of whipsaw on tightly clustered signals
⚙️ Default Settings – Optimized for XAUUSD (Gold)
All default values have been specifically calibrated for Gold's typical volatility and intraday structure.
Setting \ Default \ Why This Works for Gold
-----------------------------------------------------------------------------------
Higher Timeframe \ 15m \ Gold's intraday rhythm operates on 15‑minute cycles. This timeframe captures the balance between institutional order flow and retail noise.
-----------------------------------------------------------------------------------
EMA Length \ 36 \ approximately one full trading session. This captures the dominant intraday trend without excessive lag.
-----------------------------------------------------------------------------------
Channel Width Mode \ Percentage \ Gold's price levels change over time. Percentage mode ensures the channel scales with price, maintaining consistent relative width regardless of Gold's price level.
-----------------------------------------------------------------------------------
Channel Width \ 0.35% \ Gold's daily range averages $30–$100. At current prices, 0.35% = approximately $113–$16. This width captures ~70% of Gold's daily volatility, creating a meaningful "value zone" that filters noise while remaining relevant.
-----------------------------------------------------------------------------------
Lower Timeframe \ 5m \ Fast enough to capture entry signals within the same session, slow enough to filter out micro‑noise. 5m is Gold's "sweet spot" for intraday entries.
-----------------------------------------------------------------------------------
Engulfing Mode \ Percentage \ Adapts to Gold's volatility. As Gold's price moves, the required engulfing range scales proportionally—ensuring consistent pattern quality.
-----------------------------------------------------------------------------------
Engulfing Min Range \ 0.098% \ At Gold's current price3000-5000, this ≈ $3.0–$5.0. Anything smaller is just market noise, not a meaningful reversal signal.
-----------------------------------------------------------------------------------
Engulfing Max Range \ 0.550% \ At Gold's current price, this ≈ $20–$25. Larger candles are often blow‑off spikes driven by news —they tend to reverse violently, making them poor entry points.
-----------------------------------------------------------------------------------
Previous Range % \ 0.60 \ Allows the prior candle to be up to 60% of the engulfing candle's range. This is Gold's "consolidation before reversal" pattern—a small same‑color candle before a large reversal candle.
-----------------------------------------------------------------------------------
Gap Allowance \ 250 ticks \ Gold's typical spread and gap behavior. (250 ticks = $0.250 However, tick values vary between brokers), which accommodates normal gaps without allowing extreme invalid gaps.
-----------------------------------------------------------------------------------
Pin Bar Sweep \ 10 bars \ On a 5m chart, 10 bars = 50 minutes. Gold's liquidity grabs often occur within a 30–60 minute window. 10 bars captures these recent liquidity zones without looking too far back.
-----------------------------------------------------------------------------------
Pin Bar Range % \ 0.70 \ Requires the pin bar(high-low) to be at least 70% of the minimum engulfing range. This ensures the pin bar has enough size to be meaningful—rejecting tiny pin bars that lack conviction.
-----------------------------------------------------------------------------------
Risk per Trade (1st) \ 2% \ Gold experiences 3–5 trade losing streaks regularly. 2% risk ensures that a typical losing streak results in only 6–10% drawdown—recoverable with a few winning trades.
-----------------------------------------------------------------------------------
Risk per Trade (2nd) \ 1% \ When pyramiding, total exposure increases. 1% on the second trade limits worst‑case loss to -3% total (2% + 1%), protecting the account during false reversals.
-----------------------------------------------------------------------------------
Risk:Reward \ 1:3 \ Gold routinely moves 1.5–2× its ATR in a single directional push. A 1:3 target (e.g., $15 on a $5 stop) is well within Gold's typical daily range—achievable without being overly ambitious.
-----------------------------------------------------------------------------------
Stop‑Loss Reference \ Channel \ Aligns the stop with the value area. If price breaks beyond the channel, the mean‑reversion thesis is invalidated. This is the most logical stop placement for this strategy.
-----------------------------------------------------------------------------------
Stop‑Loss Buffer \ 500 ticks \ 500 ticks = ($0.50 ) on Gold. However, tick values vary between brokers so The table on chart will display and show the calculated dollar value. This provides a safety buffer against spread, slippage, and normal wicks—preventing premature stops while keeping the stop within the value area.
-----------------------------------------------------------------------------------
Partial TP & Breakeven \ Disabled (50%, 1:2) \ Optional features that allow locking in partial profits and protecting positions once they move in your favor. Recommended to enable after forward testing.
-----------------------------------------------------------------------------------
No‑Trade Window \ Enabled \ 16:45–19:05 NY time captures the end‑of‑day volatility spike. Gold often experiences erratic moves during this period as institutional traders close positions.
-----------------------------------------------------------------------------------
Day End Close \ Enabled \ Gold gaps frequently at the daily open (5:00 PM NY). Closing before day end avoids these gaps, which can easily stop out tight positions.
-----------------------------------------------------------------------------------
Week End Close \ Enabled \ Gold is highly sensitive to weekend news (geopolitics, central banks). Gaps of $20–$50+ are common at Sunday open. Closing before Friday close is essential.
-----------------------------------------------------------------------------------
EMA Lower TF \ Enabled \ Ensures entries align with the 5m micro‑trend. However, the Pin+Engulf combo overrides this filter to capture institutional reversals against the trend.
-----------------------------------------------------------------------------------
Higher TF EMA \ Enabled (1H, 55) \ Provides an additional layer of trend confirmation at the macro level. The 1H 55‑EMA acts as a reliable gauge of the broader intraday trend, preventing entries against strong momentum.
-----------------------------------------------------------------------------------
RSI \ Enabled length(14) \ Prevents buying when Gold is overbought (RSI > 70) and selling when oversold (RSI < 30). Gold's sharp spikes often create extreme RSI readings—this filter avoids chasing exhausted moves.
-----------------------------------------------------------------------------------
Bollinger Bands \ Enabled \ locks entries during low volatility (BB width < 0.002). Gold sometimes enters tight consolidation ranges (BB width < 0.002) where engulfing patterns fail. This filter avoids trading in these conditions.
-----------------------------------------------------------------------------------
Squeeze Momentum \ Enabled \ This is inverted from standard SQZMOM. Gold's momentum often overshoots before reversing. By fading the extreme (longs when val < 0, shorts when val > 0), the strategy captures the reversal rather than chasing the continuation.
-----------------------------------------------------------------------------------
# Important Notes on Backtest Realism
- Commission – Most ECN/raw-spread brokers charge $3.00–$3.50 per side (round-turn commission of $6.00- $7.00) for 1 standard lot (100 oz) of XAUUSD. Standard accounts usually build the fee into a wider spread instead of charging a separate cash. This strategy deducts $3.50 per entry and $3.50 per exit ($0.035 × 100 oz)round-turn commission of $7.00. Adjust this to match your broker's exact fees.
- 4 ticks Slippage – For XAUUSD on OANDA, 1 tick = $0.001** per ounce (3 decimal places). 4 ticks = **$0.004 per ounce. Adjust this value if your broker quotes XAUUSD with different decimal precision (e.g., 2 decimal = $0.01 per tick).
Always adjust the commission value to your broker's exact fee structure before relying on the results.
"A backtest without realistic commission and slippage is a fantasy. A backtest with realistic commission and slippage is a truthful reflection of what you can expect when trading live."
-------------------------------------------------------------------
📊 Chart Display
Channel – Upper/Lower bands with a semi‑transparent fill (red zone), representing the value area
EMA Lower TF – Green EMA on the lower timeframe for confirmation
HTF EMA Filter – Red EMA line showing the additional trend filter (plotted on all timeframes ≤ its TF)
Info Table – Shows Market Status, EMA confirmations, Channel Width, Engulfing ranges, SL settings,
Filters, No‑Trade Window status, Session Close status
Signal Arrows – Green arrow pointing up (below bar) for Long entries, Red arrow pointing down (above bar) for Short entries
Historical Trades – Configurable number of past trades to display on the chart (default: 111, max: 125). Adjust this to optimize chart performance while keeping sufficient trade history for visual analysis.
Reset Signal – Arrow marker (grey) indicating when the trade counter resets at session starts (Asia, London, New York for TF ≤ 15m, or daily for larger TFs)
Background Colors – red for No‑Trade Window, Gray/White for Session Close
UI Note
# When you adjust any setting in the Inputs tab (Channel Width, Engulfing Min/Max, Previous Range, SL Buffer, etc.), the values displayed in the info table update automatically in real‑time.
This allows you to:
- See the impact of your changes immediately
- Verify the actual dollar values of your settings at current price levels
- Fine‑tune parameters without switching between tabs
Example: If you change the Channel Width from 0.35% to 0.50%, the info table will instantly show the new width in dollars (e.g., $8.50 → $12.00).
# Inputs are hidden from the status line to keep the chart clean. All settings (zones, EMAs, risk, patterns) remain fully adjustable in Settings → Inputs tab.
-------------------------------------------------------------------
📌 In Summary:
This is not a random collection of indicators.
- The HTF EMA Channel provides the structural context – a dynamic value area that adapts to volatility.
- The Engulfing/Pin Bar patterns provide the high‑conviction trigger – exhaustion confirmation.
- The EMA Override provides the institutional edge – capturing liquidity grabs that standard EMA‑based strategies miss.
- The Optional Filters provide the quality control – reducing false signals.
- The Risk Management provides the survivability – realistic position sizing and stops.
Each component exists specifically to compensate for a flaw in the others. This interdependency is what makes the strategy original, robust,
Author: Awab_Hassan
Estratégia

ATK/DEF HTF Regime Combo Monthly# ATK/DEF HTF Regime Combo — Monthly
### Overview
ATK/DEF HTF Regime Combo is a structured HTF market observation framework that combines multiple market conditions into a unified analysis dashboard.
The indicator is built around a decision-based analytical architecture, where different market measurements are processed through several independent analytical components and consolidated into a final market-state observation.
### Analytical Structure
The framework consists of three main analytical components:
**C1 — Direction & Trend**
Combines directional structure, trend strength, momentum and volatility conditions.
**C2 — Activity & Expansion**
Evaluates market density, range expansion, price activity, recent directional distribution and volume conditions.
**C3 — Flo & Pressure**
Combines price-action conditions, flo measurements, price concentration and support/resistance pressure.
Each component produces its own calculated score, state and grade. The three component results are then combined into the final HTF assessment.
### Decision Dashboard
The dashboard displays the underlying factors together with:
* Individual factor scores
* C1 / C2 / C3 component scores
* Component states
* Component grades
* Combined total score
* Final analytical state
This structure keeps the individual analytical components visible while providing a consated view of the calculated HTF condition.
### Market Data Framework
The calculation incorrates multiple market measurements, including moving-average structure, DMI/ADX, RSI, ATR, Bollinger Band conditions, volume activity, CMF, MFI, price-range concenttion, support/resistance references and swing-point structure.
These measurements are combined within the analytical framework rather than being presented as isolated indicator reings.
### Output
The final result represents a calculated observation of the current HTF market condition** based on the selected parameters and available market data.
The indicator does not provide ent or ex instructions, trag recomtions, finial guince or market fors. The displayed result is intended as an analytical reference and should be considered together with other market information and indedent decision-making.
### Parameters
The calculation framework contains configurable parameters for moving averages, DMI, RSI, ATR, Bollinger Bands, volume measurements, CMF, MFI, support/resistance range and swing-point detection.
Different parameter configurations may produce different analytical results depding on the insument and chart conditions.
### Notes
ATK/DEF HTF Regime Combo is designed as an HTF observation and decision-analysis tool. Its primary output is the structured intertation of multiple market conditions through a uied dashboard.
Indicador

Indicador

Price Flow - Buy Sell# Price Flow Buy Sell
**Price Flow Buy Sell** is an adaptive market-flow indicator designed to identify potential BUY and SELL opportunities by analyzing price direction, volatility, momentum, statistical price extremes, and signs of trend exhaustion.
Instead of relying on a basic moving-average crossover, Price Flow Buy Sell continuously estimates the market's dynamic **fair value** and measures how price is behaving around that level.
The goal is simple:
**Identify when price becomes stretched, momentum begins to weaken, and price flow shows signs of changing direction.**
## 🚀 Key Features
### 🟢 Clear BUY & SELL Signals
Price Flow Buy Sell displays easy-to-read signals directly on the chart:
**BUY** signals identify potential bullish reversal opportunities.
**SELL** signals identify potential bearish reversal opportunities.
Signals are not generated from price crossing a single line. Multiple conditions involving price rejection, momentum and market behavior are evaluated before a signal is produced.
---
## 📈 Adaptive Price Flow
At the heart of the indicator is an adaptive statistical regression model that calculates a dynamic **Fair Value Core**.
Unlike a traditional moving average, the calculation uses weighted historical price information and automatically adapts to changing volatility.
This creates a smoother representation of the underlying price flow while helping reduce short-term market noise.
---
## 🌊 Dynamic Fair Value
The central Price Flow line represents the estimated fair value of the market.
Its color provides a quick visual indication of momentum:
🟢 **Green:** Bullish price flow
🔴 **Red:** Bearish price flow
⚪ **Grey/Neutral:** Momentum is weak or transitioning
The indicator analyzes both the **velocity and acceleration** of the fair-value curve rather than simply checking whether price is above or below it.
This can help identify when an existing move is beginning to lose momentum.
---
## 🎯 Adaptive Price Zones
Price Flow Buy Sell automatically creates dynamic Inner and Outer zones around fair value.
### Inner Zones
The Inner Zones represent moderate deviations from fair value.
They are particularly useful when the market is consolidating or trading within a range.
### Outer Zones
The Outer Zones represent more extreme deviations from fair value.
During stronger trends, the indicator becomes more selective and focuses on price rejection around these extreme zones.
This helps reduce the tendency to generate reversal signals too early during powerful market moves.
---
## 🟢 How BUY Signals Are Detected
A potential BUY setup begins when price becomes extended below its calculated fair-value range.
The indicator then looks for evidence that bearish pressure is weakening.
Depending on current market conditions, the system evaluates factors including:
• Price reaching the lower adaptive zone
• Rejection back inside the zone
• Bullish candle confirmation
• Weakening bearish price flow
• Positive momentum acceleration
• Current trend/range conditions
When the required conditions align, a **BUY** signal is displayed below the candle.
The objective is to identify potential bullish reversals after selling pressure begins to lose strength.
---
## 🔴 How SELL Signals Are Detected
A potential SELL setup occurs when price becomes extended above its calculated fair-value range.
The indicator then analyzes whether bullish momentum is beginning to weaken.
Conditions can include:
• Price reaching the upper adaptive zone
• Rejection back inside the zone
• Bearish candle confirmation
• Weakening bullish price flow
• Negative momentum acceleration
• Current trend/range conditions
When the conditions align, a **SELL** signal is displayed above the candle.
The objective is to identify potential bearish reversals after buying pressure begins to lose strength.
---
## 🧠 Automatic Trend & Range Detection
Markets behave differently when trending and ranging.
Price Flow Buy Sell automatically evaluates the strength of the underlying price movement and adjusts its signal logic accordingly.
**Trending Market**
The indicator becomes more selective and primarily looks for reversals from the Outer Zones.
**Ranging Market**
The indicator can use the closer Inner Zones to detect shorter price-flow reversals.
This adaptive behavior allows the same indicator to respond differently as market conditions change.
---
## ⚡ Adaptive Volatility Engine
Market volatility is constantly changing.
When **Adaptive Volatility** is enabled, Price Flow Buy Sell automatically adjusts its calculations using current ATR volatility relative to recent market volatility.
During high volatility, additional smoothing helps reduce noise.
During normal or lower volatility, the indicator can remain more responsive to changes in price flow.
---
## 🛡️ Range Filter
The optional **Range Filter** provides additional momentum confirmation for signals generated around the Inner Zones.
When enabled, the indicator requires evidence that the existing price movement is weakening before generating a signal.
This provides a more selective signal approach.
Traders looking for more aggressive signals can disable the Range Filter.
---
## 🔄 Strict Buy/Sell Alternation
Price Flow Buy Sell also includes an optional **Strict Buy/Sell Alternation** mode.
When enabled, signals follow the sequence:
**BUY → SELL → BUY → SELL**
A second BUY cannot occur until a SELL has appeared, and vice versa.
This can provide a cleaner chart for traders who prefer directional transitions rather than repeated same-direction signals.
---
## 🔔 BUY & SELL Alerts
TradingView alerts are available for both signal types:
🔔 **BUY Alert**
🔔 **SELL Alert**
Alerts can be used to monitor multiple markets without continuously watching every chart.
---
## ⚙️ Main Settings
**Base Bandwidth**
Controls the responsiveness and smoothness of the Price Flow calculation.
Lower values increase responsiveness, while higher values provide greater smoothing.
**Lookback Window**
Controls the amount of historical price information used in calculating fair value.
**Inner Band Multiplier**
Controls the distance of the Inner Price Flow Zones.
**Outer Band Multiplier**
Controls the distance of the more extreme Outer Price Flow Zones.
**Adaptive Volatility**
Allows the calculation to automatically adjust to changing volatility.
**Range Filter**
Adds momentum confirmation to signals generated during ranging conditions.
**Strict Buy/Sell Alternation**
Prevents consecutive signals in the same direction.
---
## 📊 Suitable Markets
Price Flow Buy Sell can be applied to different liquid markets, including:
• Stocks
• Indices
• Futures
• Commodities
• Forex
• Cryptocurrency
It can also be tested across different chart timeframes depending on the trader's strategy.
---
## 💡 How to Use Price Flow Buy Sell
Rather than treating every BUY or SELL label as an automatic trade, traders can use Price Flow Buy Sell as a confirmation tool alongside:
• Support & Resistance
• VWAP
• Market Structure
• Volume Analysis
• Higher-Timeframe Trend
• RSI / Momentum
• Risk Management
For example, a BUY signal appearing near an established support area can provide stronger context than a BUY signal occurring without supporting market structure.
---
## ⚠️ Important
Price Flow Buy Sell does not attempt to predict the exact top or bottom of every market movement.
The indicator identifies conditions where price has become statistically extended from its estimated fair value while the underlying price flow shows potential signs of momentum exhaustion or reversal.
Signals should therefore be considered trading opportunities rather than guaranteed outcomes.
Always use appropriate risk management and independently evaluate market conditions before making trading decisions.
---
### Price Flow Buy Sell
**Follow the flow. Identify the extremes. Spot potential reversals.**
Indicador

Liquidity Trend Heatmap [BigBeluga]🔵 OVERVIEW
The Liquidity Trend Heatmap is a professional-grade volume analysis tool that maps market liquidity directly onto your price chart. By combining a trend-following baseline with a high-resolution volume-at-price heatmap, it helps traders instantly visualize where the market's "heavy" trading zones are located relative to the current trend.
🔵 FEATURES
The indicator utilizes a sophisticated volume-distribution engine to provide actionable market intelligence:
1 — Dynamic Liquidity Heatmap
Multi-Node Distribution: The indicator divides the recent price range into a 26-level grid, calculating the cumulative volume traded at each level over your defined Lookback Period .
Visual Heatmap Nodes: Liquidity is displayed as shapes (Squares, Circles, etc.) that shift color and intensity based on the volume processed at that price.
Normalized Intensity: Nodes appear more vivid based on their volume relative to the Point of Control (POC), ensuring you only focus on the most significant liquidity zones.
2 — Institutional Point of Control (POC) Tracker
Automated POC Detection: The system identifies the specific price level with the highest volume accumulation, marking it as the market’s primary liquidity magnet.
Real-Time Metrics: A dedicated POC label on the far right of your chart provides the exact price and volume traded at the POC, keeping your focus on the most critical level.
3 — Trend-Following Dashboard
Trend Baseline: Includes a customizable moving average ( Trend Length ) that acts as a structural midline. This midline automatically updates color to indicate whether the current environment is Bullish or Bearish.
Information Dashboard: A clean, configurable table at the top-right provides instant updates on the current trend status, POC price, and total POC volume without cluttering your workspace.
🔵 HOW TO USE
This tool is designed to identify "smart money" zones and potential mean-reversion levels:
Identify Liquidity Magnets: Use the POC level as a primary target or support/resistance level. High-volume nodes often act as magnets for price action.
Confirm Trend: Use the Trend Line and dashboard status to ensure your liquidity-based trades are aligned with the prevailing market trend.
Filter Weak Levels: Adjust the Heatmap Threshold % to hide low-volume levels. This cleans up your chart and leaves only the most relevant, high-conviction liquidity zones visible.
🔵 NOTES
Why this implementation is unique:
It combines complex volume-profile math with a lightweight, user-friendly visual interface, making it suitable for both scalpers and swing traders.
The "future-extending" heatmap nodes visualize expected liquidity distribution into the immediate future, helping you anticipate price behavior before it happens.
The system is highly customizable, allowing you to toggle the trend line, adjust shape types, and change heatmap thresholds to suit your specific trading style.
Indicador

DNSE VN301!, SMA 34/89 Dual Slope Strategy "SMA 34/89 Dual Slope Trend Following" is a trend-following strategy designed to capture sustained directional price movements by identifying alignment between short-term and medium-term trend momentum. The strategy uses SMA(34) and SMA(89), generating Long signals when both moving averages are rising and Short signals when both are falling.
By requiring both SMA slopes to confirm the same direction, the strategy seeks to filter out weaker signals and avoid trades when short- and medium-term trends are not aligned. An optional SMA(200) trend filter provides an additional layer of broader trend confirmation. The strategy also includes configurable stop loss, take profit, trading session filters, and automatic end-of-session position closure for disciplined risk management.
Strategy settings and configuration:
Chart timeframe: recommended 2-minute chart
Position size: 3 contracts
Fast SMA length: 34
Slow SMA length: 89
SMA trend filter: disabled by default
Trend filter SMA length: 200
Stop loss: 10 points
Take profit: 20 points
Take profit: On / Off
Time filter: On / Off
Trading session: 09:00 – 14:30
Trade direction: Long / Short / Both
Signal arrows: disabled by default
Default script settings:
The strategy uses two main SMA lines: SMA(34) and SMA(89). SMA(34) reflects the short-term trend. SMA(89) represents the medium-term trend.
Unlike a traditional SMA crossover strategy, CNPS 03 does not wait for the two SMA lines to cross. Instead, the bot evaluates the slope of each SMA line to identify trend direction.
When SMA(34) is rising and SMA(89) is also rising, the bot confirms an uptrend. When SMA(34) is falling and SMA(89) is also falling, the bot confirms a downtrend.
The SMA(200) trend filter is disabled by default. This is because SMA(89) already acts as a medium-term trend component in the strategy. Users can still enable SMA(200) if they want a stricter trend filter.
When the SMA(200) trend filter is enabled, the script only allows Long trades when SMA(200) is rising and only allows Short trades when SMA(200) is falling.
Entry and exit rules:
Long entry:
SMA(34) is rising
AND SMA(89) is rising
AND SMA(200) is rising, if the SMA trend filter is enabled
AND the signal appears during the trading session
AND trade direction allows Long entries
Long exit:
Stop loss: 10 points from entry price
Take profit: 20 points from entry price, if enabled
Reversal when a valid Short signal appears
Close position when the SMA trend filter turns downward, if the SMA trend filter is enabled
Automatic position close at the end of the trading session
Short entry:
SMA(34) is falling
AND SMA(89) is falling
AND SMA(200) is falling, if the SMA trend filter is enabled
AND the signal appears during the trading session
AND trade direction allows Short entries
Short exit:
Stop loss: 10 points from entry price
Take profit: 20 points from entry price, if enabled
Reversal when a valid Long signal appears
Close position when the SMA trend filter turns upward, if the SMA trend filter is enabled
Automatic position close at the end of the trading session
Strategy logic:
CNPS 03 is suitable for market phases with clear trend direction. When both the fast SMA and the slow SMA are pointing in the same direction, the bot prioritizes trading in that direction.
This design allows the bot to react earlier than a traditional SMA crossover strategy. However, during sideways market conditions, the SMA slopes may change frequently. Users should test the strategy carefully before applying it to live trading.
Time filter:
The default trading session is 09:00 – 14:30, designed to avoid two abnormal volatility periods.
ATO 08:45 – 09:00 is the opening auction period. Price can gap strongly and technical signals may be noisy.
ATC and negotiated trading 14:30 – 15:00 is the closing auction period. Price can move sharply or reverse quickly.
Users can adjust the start time and end time in the bot settings.
Risk disclaimer:
Futures trading involves a high level of risk and prices can move sharply. This script is provided for reference, research, and backtesting purposes only. Users should fully understand derivatives trading, their own risk tolerance, and the strategy logic before applying it to live trading.
All investment decisions are the responsibility of the user. phaisinh.online is not responsible for any losses arising from the use of this strategy in real trading. Past performance does not guarantee future results.
__________________________________________________________
"SMA 34/89 Dual Slope Trend Following" là một chiến lược giao dịch theo xu hướng, được thiết kế nhằm nắm bắt các chuyển động giá có xu hướng kéo dài bằng cách xác định sự đồng thuận giữa xu hướng ngắn hạn và trung hạn. Chiến lược sử dụng SMA(34) và SMA(89), tạo tín hiệu Long khi cả hai đường trung bình động đều dốc lên và tín hiệu Short khi cả hai đều dốc xuống.
Bằng cách yêu cầu độ dốc của cả hai đường SMA xác nhận cùng một hướng, chiến lược hướng tới việc lọc các tín hiệu yếu và hạn chế giao dịch khi xu hướng ngắn hạn và trung hạn chưa đồng thuận. Bộ lọc xu hướng SMA(200) tùy chọn cung cấp thêm một lớp xác nhận xu hướng tổng thể. Chiến lược cũng bao gồm các tùy chọn Stop Loss, Take Profit, bộ lọc khung thời gian giao dịch và cơ chế tự động đóng vị thế khi kết thúc phiên, nhằm đảm bảo quản trị rủi ro một cách chặt chẽ và có kỷ luật.
Cài đặt & cấu hình chiến lược:
Biểu đồ: khuyến nghị khung 2 phút
Khối lượng giao dịch: 3 hợp đồng
Chu kỳ SMA nhanh: 34
Chu kỳ SMA chậm: 89
Bộ lọc xu hướng SMA: Tắt mặc định
Chu kỳ SMA bộ lọc: 200
Cắt lỗ: 10 điểm
Chốt lời: 20 điểm
Dùng chốt lời: Bật / Tắt
Bộ lọc giờ: Bật / Tắt
Khung giờ giao dịch: 09:00 – 14:30
Chiều giao dịch: Mua / Bán / Cả hai
Hiện mũi tên tín hiệu: Tắt mặc định
Cài đặt mặc định của script:
Chiến lược sử dụng hai đường SMA chính là SMA(34) và SMA(89). SMA(34) phản ánh xu hướng ngắn hạn. SMA(89) đại diện cho xu hướng trung hạn.
Khác với chiến lược giao cắt SMA thông thường, CNPS 03 không chờ hai đường SMA cắt nhau. Bot đánh giá độ dốc của từng đường SMA để xác định xu hướng.
Khi SMA(34) dốc lên và SMA(89) cũng dốc lên, bot xác nhận xu hướng tăng. Khi SMA(34) dốc xuống và SMA(89) cũng dốc xuống, bot xác nhận xu hướng giảm.
Bộ lọc xu hướng SMA(200) được để tắt mặc định. Lý do là SMA(89) đã đóng vai trò lọc xu hướng trung hạn trong chiến lược. Người dùng vẫn có thể bật thêm SMA(200) nếu muốn lọc xu hướng chặt hơn.
Khi bật bộ lọc SMA(200), script chỉ cho phép lệnh Mua khi SMA(200) dốc lên và chỉ cho phép lệnh Bán khi SMA(200) dốc xuống.
Điều kiện vào và thoát lệnh:
Vào lệnh Mua:
SMA(34) dốc lên
VÀ SMA(89) dốc lên
VÀ SMA(200) dốc lên, nếu bật bộ lọc xu hướng SMA
VÀ tín hiệu xuất hiện trong khung giờ giao dịch
VÀ chiều giao dịch cho phép lệnh Mua
Thoát lệnh Mua:
Cắt lỗ: 10 điểm từ giá vào lệnh
Chốt lời: 20 điểm từ giá vào lệnh, nếu bật
Đảo chiều khi xuất hiện tín hiệu Bán hợp lệ
Đóng lệnh khi SMA bộ lọc đảo chiều xuống, nếu bật bộ lọc xu hướng SMA
Tự động đóng lệnh khi hết khung giờ giao dịch
Vào lệnh Bán:
SMA(34) dốc xuống
VÀ SMA(89) dốc xuống
VÀ SMA(200) dốc xuống, nếu bật bộ lọc xu hướng SMA
VÀ tín hiệu xuất hiện trong khung giờ giao dịch
VÀ chiều giao dịch cho phép lệnh Bán
Thoát lệnh Bán:
Cắt lỗ: 10 điểm từ giá vào lệnh
Chốt lời: 20 điểm từ giá vào lệnh, nếu bật
Đảo chiều khi xuất hiện tín hiệu Mua hợp lệ
Đóng lệnh khi SMA bộ lọc đảo chiều lên, nếu bật bộ lọc xu hướng SMA
Tự động đóng lệnh khi hết khung giờ giao dịch
Logic chiến lược:
CNPS 03 phù hợp với các giai đoạn thị trường có xu hướng rõ ràng. Khi cả SMA nhanh và SMA chậm cùng nghiêng về một hướng, bot ưu tiên giao dịch theo hướng đó.
Thiết kế này giúp bot phản ứng sớm hơn so với chiến lược chờ giao cắt SMA truyền thống. Tuy nhiên, trong giai đoạn thị trường đi ngang, hai đường SMA có thể đổi độ dốc liên tục. Vì vậy, người dùng nên kiểm thử kỹ trước khi sử dụng thực tế.
Bộ lọc giờ:
Mặc định 09:00 – 14:30, nhằm tránh hai vùng biến động bất thường.
ATO 08:45 – 09:00 là giai đoạn khớp lệnh mở cửa. Giá thường có thể gap mạnh và tín hiệu kỹ thuật dễ bị nhiễu.
ATC và giao dịch thỏa thuận 14:30 – 15:00 là giai đoạn khớp lệnh đóng cửa. Giá có thể biến động mạnh hoặc đảo chiều nhanh.
Người dùng có thể điều chỉnh giờ bắt đầu và giờ kết thúc trong phần cài đặt bot.
Tuyên bố rủi ro:
Giao dịch hợp đồng tương lai có mức độ rủi ro cao và giá có thể biến động mạnh. Script này chỉ phục vụ mục đích tham khảo, nghiên cứu và kiểm thử. Người dùng cần hiểu rõ giao dịch phái sinh, khẩu vị rủi ro cá nhân và logic của chiến lược trước khi áp dụng vào giao dịch thực tế.
Mọi quyết định đầu tư thuộc trách nhiệm của người dùng. phaisinh.online không chịu trách nhiệm cho bất kỳ khoản lỗ nào phát sinh từ việc sử dụng chiến lược này trong giao dịch thực tế. Hiệu quả trong quá khứ không đảm bảo kết quả trong tương lai.
Estratégia

Hybrid Breakout | VCP-Inspired TrendTrend Squeeze Breakout
Trend Squeeze Breakout is a trend-following momentum strategy designed to identify stocks in strong established uptrends that are consolidating into relatively tight trading ranges before attempting a breakout.
The strategy combines a simplified Minervini-style trend template, volatility contraction, volume confirmation, and stop-entry breakout execution. It is designed primarily for swing trading and is intended to participate in strong upward price expansions while filtering out many breakouts occurring in weak or declining trends.
Strategy Explanation
The strategy follows a simple sequence:
Identify a strong uptrend
A long setup requires:
Price above the 50-period SMA
50 SMA above the 150 SMA
150 SMA above the 200 SMA
200 SMA rising
200 SMA continuing to rise over the selected lookback period
50 SMA not declining
This establishes that the stock is already in a structurally bullish environment before considering an entry.
Identify a volatility contraction
The strategy looks for periods where recent price movement has become unusually tight.
It evaluates both:
Recent high-low range
Recent closing-price range
The high-low range is also compared with its historical percentile over the selected lookback period. This allows the strategy to identify relatively quiet consolidation periods rather than relying on a fixed volatility threshold alone.
Confirm volume
When the volume filter is enabled, breakout volume must exceed the moving-average volume baseline by the selected multiplier.
The default requirement is:
Volume > 20-period average volume × 1.2
This is intended to provide additional confirmation that the breakout is supported by meaningful participation.
Enter on a breakout
When the trend, contraction, and volume conditions are satisfied, the strategy places a stop-entry order above the recent high.
The default breakout lookback is 3 bars, allowing the strategy to attempt to enter as price moves through the recent consolidation high rather than simply buying while the stock remains inside the range.
Manage the position
Positions use tiered profit-taking:
25% closed at +10%
50% closed at +20%
Remaining position closed at +30%
Default stop loss at -8%
This allows the strategy to realize some profits during the initial move while maintaining exposure to larger momentum extensions.
Features
Trend Filter — 50/150/200 SMA bullish alignment
Long-Term Trend Confirmation — Requires the 200 SMA to be rising
Volatility Squeeze Detection — Identifies unusually tight recent ranges
Range Percentile Filter — Compares current volatility with historical volatility
Close-Range Filter — Detects tight price consolidation
Volume Confirmation — Optional volume expansion requirement
Stop-Entry Breakout — Enters only when price breaks the recent high
Tiered Profit Taking — Three configurable profit targets
Percentage-Based Stop Loss — Adjustable downside protection
Date Filter — Allows users to restrict backtests to a specific period
Configurable Parameters — Trend, volatility, volume, breakout, and risk settings can all be adjusted
Tips for Use
Use on liquid stocks
The strategy is generally better suited to liquid stocks and ETFs with sufficient trading volume. Extremely illiquid securities can produce unrealistic backtest results because of spreads and execution differences.
Start with daily charts
The strategy is particularly suited to identifying multi-day or multi-week momentum breakouts. Daily charts are a good starting point when evaluating the strategy.
Avoid optimizing every parameter
The many adjustable parameters make it possible to overfit the strategy to a particular stock or historical period. Test parameter changes across multiple securities and different market environments rather than optimizing exclusively for one chart.
Treat the volume filter as confirmation, not a guarantee
High volume can strengthen a breakout signal, but it does not guarantee that the breakout will succeed.
Test across different market conditions
Trend-following breakout systems typically perform differently during strong bull markets, corrections, sideways markets, and high-volatility periods. Evaluate results across multiple market regimes before relying on the strategy.
Pay attention to execution
The strategy uses stop-entry orders above recent highs. In live trading, gaps, slippage, spreads, and intrabar price movement can cause actual execution prices to differ from backtested results.
Important Note
This strategy is inspired by trend-template and volatility-contraction concepts, but it is not a complete implementation of a textbook VCP. It uses a simplified statistical contraction model rather than explicitly identifying multiple successive contractions, contraction depths, and their associated volume characteristics.
Backtest results are hypothetical and do not guarantee future performance. Always consider commissions, slippage, liquidity, position sizing, and market conditions when evaluating a strategy.
Recommended starting configuration: Daily timeframe, liquid stocks, default trend filter, volume confirmation enabled, and the default tiered risk-management settings.
Estratégia

Auto AVWAP - Consecutive ViolationsAuto AVWAP with Consecutive Violation Control
This indicator plots automatically anchored Volume Weighted Average Price levels for potential support and resistance.
It maintains two primary Anchored VWAPs:
- High AVWAP: an upper reference derived from price highs or HLC3.
- Low AVWAP: a lower reference derived from price lows or HLC3.
It also calculates two developing “Next” AVWAPs. These represent potential future anchors identified through price extremes and Stochastic RSI conditions.
The main purpose of this version is to provide explicit control over when an active AVWAP is considered invalid. Unlike the original implementation, a main AVWAP is not replaced merely because a new price extreme appears or because the Stochastic RSI confirms a reversal. It remains active until price violates it for a configurable number of consecutive bars.
Core calculation
Each AVWAP is calculated as:
AVWAP = Sum(Price × Volume) / Sum(Volume)
By default, the indicator uses:
- High for the High AVWAP calculation.
- Low for the Low AVWAP calculation.
Users can disable the High/Low setting to calculate both AVWAPs from HLC3 instead.
Anchor candidate logic
Stochastic RSI and new price extremes are used to identify and maintain possible future anchor points.
The developing candidate levels are displayed as:
- High Next: potential future upper AVWAP.
- Low Next: potential future lower AVWAP.
These candidate levels can continue to develop without immediately replacing the active AVWAPs.
Consecutive violation control
A High AVWAP is considered violated when the selected price source is above it.
A Low AVWAP is considered violated when the selected price source is below it.
The active AVWAP is replaced only after the required number of consecutive violations has been reached. If a bar does not violate the level, the corresponding counter returns to zero.
This prevents a single wick, temporary breakout, or isolated close from prematurely replacing an established AVWAP.
Configurable violation source
The violation source can be selected from:
- Close: uses the candle close.
- Open: uses the candle open.
- High/Low: uses the high for High AVWAP violations and the low for Low AVWAP violations.
The “Count only closed bars” option prevents an unfinished real-time candle from temporarily increasing the violation counter.
Default configuration
The default configuration requires three consecutive confirmed closes:
- Consecutive bars to invalidate: 3
- Violation source: Close
- Count only closed bars: Enabled
This configuration is intended to filter isolated price excursions while allowing a sustained break to invalidate the active level.
Plots
The indicator displays:
- High AVWAP: primary upper reference.
- Low AVWAP: primary lower reference.
- High Next: developing upper candidate.
- Low Next: developing lower candidate.
The primary plots use stronger colors and greater width. Candidate plots use more transparent colors.
Alerts
The indicator includes alerts for:
- Breakout in either direction.
- High AVWAP resistance break.
- Low AVWAP support break.
- High AVWAP invalidation after consecutive violations.
- Low AVWAP invalidation after consecutive violations.
The breakout alerts can use either the candle open or close through the corresponding input.
How to use
- Treat the High AVWAP as a dynamic upper reference or potential resistance area.
- Treat the Low AVWAP as a dynamic lower reference or potential support area.
- Use the Next plots to monitor developing replacement anchors.
- Increase the required number of violations to retain AVWAPs for longer.
- Decrease it to make the indicator respond more quickly to sustained price breaks.
- Prefer confirmed closes when the objective is to reduce reactions to intrabar noise.
- Adjust the settings according to the symbol, timeframe, liquidity, and volatility regime.
- Combine the levels with market structure, volume analysis, and risk management.
Open-source reuse and credits
This script is based on the open-source indicator:
“Auto AVWAP (Anchored-VWAP)” by Electrified.
Original source:
This version adds and/or changes:
1) Consecutive-bar invalidation for the primary High and Low AVWAPs.
2) Configurable violation count.
3) Selectable Close, Open, or High/Low violation source.
4) Optional confirmed-bar-only counting.
5) Removal of automatic primary AVWAP replacement caused solely by new price extremes.
6) Removal of automatic primary AVWAP replacement caused solely by Stochastic RSI reversal confirmation.
7) Promotion of a developing candidate only after the active AVWAP satisfies its invalidation rule.
8) Dedicated High and Low AVWAP invalidation alerts.
9) Clear separation between candidate-anchor formation and active-level invalidation.
Limitations
- An AVWAP is a volume-weighted reference, not a guaranteed support or resistance level.
- Consecutive-bar confirmation introduces a deliberate delay before invalidation.
- Using High/Low as the violation source is more sensitive to intrabar price excursions.
- Candidate anchors depend on price extremes and Stochastic RSI behavior.
- Results vary across symbols, timeframes, sessions, and volatility regimes.
- Historical plots do not guarantee future market behavior.
- This is a decision-support tool, not a guaranteed-profit system.
- Risk management is required. Indicador

BIST30 to SP 500 ATR Momentum RiderBIST30 to S&P 500 — ATR Momentum Rider
BIST30 to S&P 500 — ATR Momentum Rider is a long-only daily strategy built to test a compact and auditable trend-following structure across index futures.
The name describes the research scope—from BIST30 to S&P 500 and other major index futures. It does not mean that the public parameters were optimized on BIST30. Parameter selection used Mini-DAX, E-mini S&P 500, E-mini Russell 2000, EURO STOXX 50, and Nikkei 225 Mini futures. Turkish index futures were kept outside parameter selection and used only as transferability stress tests.
Entry logic
The raw SET event occurs when HMA 8 > HMA 9 > HMA 20 becomes true for the first time. On that same daily close, the strategy calculates the three-day HMA20 slope in ATR units:
(HMA20 - HMA20 ) / (3 × ATR14)
The setup is accepted only when this value is at least -0.180 ATR per day. The threshold does not require a rising HMA20; it permits a mild decline and rejects setups where the slow trend is deteriorating more sharply. The filter is evaluated only on the first establishment of the HMA order. A rejected setup does not enter later inside the same uninterrupted regime.
An accepted setup creates a market order for the next available session open. The decision uses only values known at the daily close.
Exit logic
The strategy has one public exit stage:
K1-A: activation threshold. Maximum favorable excursion is divided by the ATR value known when the entry order is created. Default: 1.50 ATR.
K1-T: trail distance from the highest high observed during the campaign. Default: 5.75%.
K1-W: minimum waiting interval before a K1 close decision can act. Default: 4 sessions.
Once K1 is active, its absolute trail can only rise. An activation reached on the current bar becomes actionable from the next bar, so the activation bar cannot stop itself retroactively. A daily close at or below the active K1 line creates a market exit for the next available open. If a fresh accepted SET appears while a position is open, the campaign is refreshed at the next open.
Research process and held-out results
The K1 values were selected on January 2020–December 2023 data using equal-weight, percentage-normalized metrics across the five international contracts. Keeping the K1 engine fixed, the three-day slope threshold was then scanned from -0.400 to +0.050 ATR/day in 0.001 steps on the same development interval. The exact PF-priority plateau peak was -0.176; the operational value was rounded and locked at -0.180 to avoid publishing a fragile, over-precise threshold.
January 2024–July 2026 was not used to select the slope threshold. In this held-out interval:
Raw setups: 153
Accepted setups/trades: 102 (33.3% reduction)
Positive international instruments: 5 of 5
Median profit factor: 3.46 versus 1.94 without the slope filter
Median normalized net return: 39.3% versus 37.9% without the slope filter
Median return/max-drawdown ratio: 2.32 versus 2.16 without the slope filter
These figures use one adverse minimum tick per market fill and no commission, tax, funding, or roll cost. They are historical research results, not a forecast.
The held-out BIST stress test remained weak: the three Turkish contracts had a median profit factor of 0.77 with the slope filter. Therefore, this public version is better viewed as an international index-futures research strategy. It is not a replacement for a dedicated BIST30 live system.
Use the strategy on standard daily candles. Review each symbol's contract multiplier, session, continuous-contract construction, commissions, roll costs, and margin settings before interpreting Strategy Tester results. Changing the HMA, ATR, K1, or execution settings creates a different, unvalidated configuration.
This script is a research and educational tool, not investment advice. Past performance does not guarantee future results.
BIST30 to S&P 500 — ATR Momentum Rider
HMA 8/9/20 kuruluşunu, sabit ATR-normalize HMA20 eğim filtresini ve yalnız yukarı taşınan tek tepe trailini birleştiren açık kaynak, long yönlü günlük strateji.
BIST30 to S&P 500 — ATR Momentum Rider, farklı endeks vadelilerinde sade ve denetlenebilir bir trend takip yapısını sınamak amacıyla hazırlanmış, yalnız long çalışan günlük bir stratejidir.
İsim, araştırmanın BIST30'dan S&P 500'e ve diğer büyük endeks vadelilerine uzanan kapsamını anlatır. Açık kaynak parametrelerinin BIST30 üzerinde optimize edildiği anlamına gelmez. Parametre seçiminde Mini-DAX, E-mini S&P 500, E-mini Russell 2000, EURO STOXX 50 ve Nikkei 225 Mini vadeli kontratları kullanılmıştır. Türkiye endeks vadelileri parametre seçiminin dışında tutulmuş ve yalnız taşınabilirlik stres testi olarak değerlendirilmiştir.
Giriş mantığı
Ham SET olayı, HMA 8 > HMA 9 > HMA 20 sıralamasının ilk kez oluştuğu günlük kapanışta doğar. Strateji aynı kapanışta HMA20'nin üç günlük eğimini ATR cinsinden hesaplar:
(HMA20 - HMA20 ) / (3 × ATR14)
Kuruluş yalnız bu değer -0,180 ATR/gün veya daha yüksekse kabul edilir. Eşik HMA20'nin mutlaka yükselmesini istemez; hafif gerilemeye izin verir, yavaş trendin daha belirgin bozulduğu kuruluşları eler. Filtre yalnız HMA sıralamasının ilk kuruluşunda değerlendirilir. Reddedilen kuruluş, aynı kesintisiz rejimin sonraki günlerinde gecikmeli girişe dönüşmez.
Kabul edilen kuruluş, sonraki uygun seans açılışı için piyasa emri oluşturur. Karar yalnız günlük kapanışta bilinen değerlerle verilir.
Çıkış mantığı
Stratejide tek bir açık kaynak çıkış katmanı vardır:
K1-A: aktivasyon eşiği. Azami olumlu hareket, giriş emri oluşturulurken bilinen ATR değerine bölünür. Varsayılan: 1,50 ATR.
K1-T: kampanya boyunca görülen en yüksek fiyattan itibaren trail mesafesi. Varsayılan: %5,75.
K1-W: K1 kapanış kararının uygulanabilmesi için gereken asgari bekleme süresi. Varsayılan: 4 seans.
K1 aktif olduktan sonra mutlak trail seviyesi yalnız yukarı hareket eder. Bir barda ulaşılan aktivasyon eşiği sonraki bardan itibaren uygulanabilir; aktivasyon barı geriye dönük biçimde kendi kendisini durduramaz. Günlük kapanış aktif K1 çizgisinde veya altında gerçekleşirse sonraki uygun açılış için piyasa çıkışı oluşturulur. Pozisyon açıkken yeni ve kabul edilmiş bir SET doğarsa kampanya sonraki açılışta yenilenir.
Araştırma süreci ve ayrılmış dönem sonuçları
K1 değerleri Ocak 2020–Aralık 2023 döneminde beş yabancı kontrat üzerinde; endeksler eşit ağırlıklı ve fiyat ölçekleri yüzdeyle normalize edilerek seçildi. K1 motoru sabit tutulduktan sonra üç günlük eğim eşiği aynı geliştirme döneminde -0,400 ile +0,050 ATR/gün arasında 0,001 adımla tarandı. PF öncelikli platonun matematiksel tepe noktası -0,176 oldu; aşırı hassas bir değer yayımlamamak için operasyonel eşik -0,180 olarak yuvarlanıp sabitlendi.
Ocak 2024–Temmuz 2026 dönemi eğim eşiğinin seçiminde kullanılmadı. Bu ayrılmış dönemde:
Ham kuruluş: 153
Kabul edilen kuruluş/işlem: 102 (%33,3 azalış)
Pozitif yabancı endeks: 5/5
Medyan profit factor: eğim filtresi olmadan 1,94, filtreyle 3,46
Medyan normalize net getiri: filtresiz %37,9, filtreyle %39,3
Medyan getiri/azami düşüş oranı: filtresiz 2,16, filtreyle 2,32
Bu rakamlar her piyasa dolumunda bir minimum fiyat adımı ters slippage içerir; komisyon, vergi, fonlama ve vade geçiş maliyeti içermez. Tarihsel araştırma sonucudur, gelecek tahmini değildir.
BIST stres testi zayıf kalmıştır: eğim filtresiyle üç Türkiye kontratının medyan profit factor değeri 0,77 olmuştur. Bu nedenle açık kaynak sürümü yabancı endeks vadelileri için bir araştırma stratejisi olarak değerlendirmek daha doğrudur; özel BIST30 canlı motorunun yerine geçmez.
Stratejiyi standart günlük mumlarda kullanın. Strategy Tester sonucunu yorumlamadan önce sembolün kontrat çarpanını, seansını, sürekli-vade oluşturma yöntemini, komisyonunu, vade geçiş maliyetini ve teminat ayarlarını kontrol edin. HMA, ATR, K1 veya emir yürütme ayarlarını değiştirmek doğrulanmamış farklı bir model oluşturur.
Bu kod araştırma ve eğitim amaçlıdır; yatırım tavsiyesi değildir. Geçmiş performans gelecekteki sonuçları garanti etmez. Estratégia

SMC Institutional Clean Wave & Structure PROSMC Institutional Clean Wave & Structure PRO
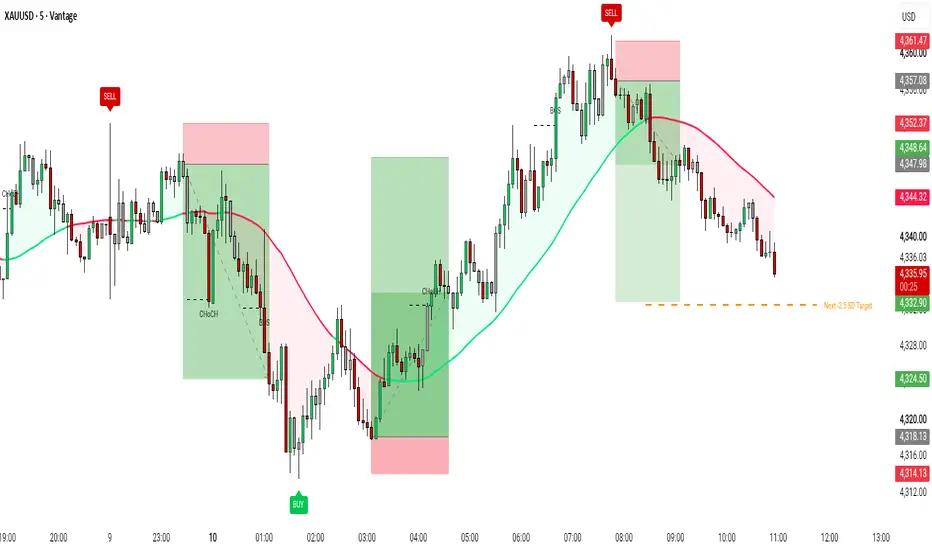
SMC Institutional Clean Wave & Structure PRO is a refined technical analysis indicator engineered to provide institutional order flow insights, precise market structure tracking, and uncluttered visual clarity on both light and dark trading themes. It replaces unnecessary chart noise with clean dynamic trend wave fills, smart consolidation candle color detection, and confirmed structure shifts.
Key Features Overview
1. Dynamic Single Trend Wave & Background Fill
Provides a smooth continuous structural trend wave. Renders vibrant green during bullish expansion phases and solid red during bearish contraction phases with a soft, unobtrusive background fill.
2. Smart Consolidation Candle Engine
Automatically highlights price action state. Bullish candles render in bright green, bearish candles in red, while tight consolidation or inside bar candles dynamically shift to a distinct grayish-white color to quickly highlight market compression.
3. Clean Market Structure Shifts (BOS & CHoCH)
Tracks key market structure breakouts. Identifies initial trend reversals as Change of Character (CHoCH) and structural extensions as Break of Structure (BOS), rendered with centered non-overlapping labels.
4. Confirmed Major Swing BUY & SELL Badges
Highlights major institutional high and low pivots with confirmed BUY and SELL badges. Pivot sensitivity and badge styling can be customized independently.
5. Target Standard Deviation Level (-2.5 SD)
Calculates real-time structural volatility and projects a dynamic -2.5 Standard Deviation Target line to help anticipate key potential market reaction levels.
Settings Overview
Trend Wave Settings
- Show Trend Wave Line: Toggle wave line and fill display.
- Colors & Opacity: Adjust trend line colors and background opacity.
Candle Engine Settings
- Enable Smart Candle Color Engine: Toggle adaptive candle colors.
- Custom Colors: Define unique colors for bullish, bearish, and inside bars.
Structure Settings
- Show BOS & CHoCH Shifts: Toggle structure labels.
- Structure Sensitivity: Fine-tune pivot detection rules for cleaner charts.
Signal Badges
- Show Confirmed BUY / SELL Badges: Toggle buy and sell markers.
- Signal Swing Sensitivity: Adjust lookback periods for pivot signals.
Standard Deviation Settings
- Show -2.5 SD Target Line: Toggle volatility target line.
- Custom Style: Adjust line thickness, color, and line style options.
Disclaimer
This script is built strictly for educational, analytical, and charting enhancement purposes. It does not offer financial advice or guaranteed trading results. Practice strict risk management.
Indicador

Indicador

Multi Moving Average 5 MA MTF & Chart Type IndependentMulti Moving Average (5 MA) — MTF & Chart-Type Independent
Five fully independent moving averages in one indicator, built to solve two problems most MA scripts get wrong.
1. Heikin Ashi doesn't distort your averages.
Every MA is calculated from the underlying standard candlestick OHLC, regardless of what the chart is set to. Switch between Candles, Heikin Ashi, Renko, Kagi, Line Break or Range — the lines stay exactly where they were. You get HA's visual smoothing for reading trend, while your 50 EMA remains the real 50 EMA everyone else is watching. A toggle lets you revert to chart-native data if you prefer.
2. Each MA gets its own timeframe.
Not one global MTF setting — five separate ones. Run a 5-min 9 EMA, a 1-hour 21 EMA and a Daily 200 SMA together on a single intraday chart to see exactly where the higher-timeframe levels sit while you execute. Blank = chart timeframe.
Also inside
12 MA types per line: SMA, EMA, WMA, RMA/SMMA, HMA, VWMA, DEMA, TEMA, TMA, LSMA, ALMA, Median
Independent source per MA (open/high/low/close/hl2/hlc3/ohlc4/hlcc4), length, colour and width
Non-repainting by design (lookahead_off), with an optional "confirmed HTF only" mode that waits for the higher-timeframe bar to close
8 built-in alerts — price crossing MA1/MA2, MA1×MA2, and MA2×MA5 golden/death cross — all referenced to standard-candle closes so they fire identically on a Heikin Ashi chart
On-chart info table showing each MA's type, length, timeframe and live value
A technical note: all MA variants are computed on every bar before the type is selected. Calling ta.* functions inside conditional branches silently corrupts their history — a bug present in a surprising number of published multi-MA scripts. This one avoids it.
Free and open source. Feedback and suggestions welcome. Indicador

TRADION Gaussian Trend EngineTRADION Gaussian Trend Engine
OVERVIEW
TRADION Gaussian Trend Engine is a multi-factor trend analysis framework designed to evaluate market direction, trend strength, momentum alignment and volatility within a unified model.
The indicator is built around an independently implemented multi-pole Gaussian cascade. Instead of using Gaussian direction alone as a trading signal, the engine evaluates several additional dimensions of market behavior before qualifying a directional transition.
The framework combines:
• Configurable multi-pole Gaussian smoothing
• ATR-normalized Gaussian slope
• Price displacement from the Gaussian baseline
• RSI momentum analysis
• Rate of Change (ROC)
• A composite 0–100 Trend Strength Score
• Volatility-adaptive trend ribbons
• Three-level BUY / SELL classification
• Confirmed-bar signal generation
• Dedicated TradingView alerts
The design objective is selective trend qualification rather than generating a signal on every minor directional fluctuation.
────────────────────────────
GAUSSIAN TREND ENGINE
────────────────────────────
The core of the indicator is a configurable multi-pole Gaussian cascade.
The user can control two primary parameters:
Gaussian Period:
Controls the smoothing horizon of the filter.
Gaussian Poles:
Controls the number of sequential Gaussian smoothing stages used by the engine, from 1 to 6.
Each additional pole applies another stage of Gaussian smoothing to the previous output.
This architecture provides a configurable balance between responsiveness and noise reduction.
The final output of the selected pole becomes the Gaussian trend baseline used by the rest of the engine.
────────────────────────────
TREND DIRECTION
────────────────────────────
Directional state is determined from the slope of the Gaussian baseline.
When the current Gaussian value is above its previous value, the engine identifies a bullish directional state.
When the current Gaussian value is below its previous value, the engine identifies a bearish directional state.
The Gaussian line changes dynamically:
Green = Bullish Gaussian direction
Red = Bearish Gaussian direction
An unchanged Gaussian value preserves the previous directional state.
────────────────────────────
VOLATILITY NORMALIZATION
────────────────────────────
Raw price movement has different significance across instruments and volatility regimes.
For this reason, ATR is used as a normalization reference within the engine.
Two important measurements are normalized relative to ATR:
• Gaussian slope magnitude
• Distance between price and the Gaussian baseline
This allows the strength model to evaluate movement relative to current market volatility rather than relying only on absolute price changes.
────────────────────────────
TREND STRENGTH SCORE
────────────────────────────
TRADION Gaussian Trend Engine calculates a composite Trend Strength Score ranging from 0 to 100.
The score combines four normalized components:
1. Gaussian Slope Strength — 40%
2. Price Distance from Gaussian — 20%
3. RSI Momentum Intensity — 25%
4. ROC Magnitude — 15%
Gaussian Slope Strength measures the magnitude of directional movement in the Gaussian baseline relative to ATR.
Price Distance measures the absolute displacement of price from the Gaussian baseline relative to ATR.
RSI Momentum Intensity measures the distance of RSI from its neutral 50 level.
ROC Magnitude measures the absolute velocity of price movement.
Each component is normalized before being incorporated into the final weighted score.
The result is a single 0–100 metric designed to describe the degree of agreement between trend movement, price expansion and momentum.
────────────────────────────
MOMENTUM CONFIRMATION
────────────────────────────
Momentum confirmation can be enabled or disabled by the user.
For bullish confirmation, the default model requires:
• RSI above 50 plus the selected Neutral Zone
• Positive ROC
For bearish confirmation, it requires:
• RSI below 50 minus the selected Neutral Zone
• Negative ROC
This layer prevents every Gaussian slope change from automatically qualifying as a BUY or SELL event.
The RSI Neutral Zone is configurable, allowing the user to control how much momentum separation is required around the RSI 50 equilibrium level.
────────────────────────────
DIRECTIONAL QUALIFICATION
────────────────────────────
A qualified bullish setup requires:
• Rising Gaussian direction
• Price above the Gaussian baseline
• Valid bullish momentum when momentum confirmation is enabled
• Trend Strength above the configured minimum threshold
A qualified bearish setup requires:
• Falling Gaussian direction
• Price below the Gaussian baseline
• Valid bearish momentum when momentum confirmation is enabled
• Trend Strength above the configured minimum threshold
This means that Gaussian direction, price structure, momentum and trend strength are evaluated together before a directional event is accepted.
────────────────────────────
THREE-LEVEL SIGNAL CLASSIFICATION
────────────────────────────
Qualified transitions are classified according to their Trend Strength Score.
Bullish classifications:
BUY
STRONG BUY
EXTREME BUY
Bearish classifications:
SELL
STRONG SELL
EXTREME SELL
The default thresholds are:
Minimum Signal Strength: 25
Strong Signal Threshold: 55
Extreme Signal Threshold: 75
These thresholds are fully configurable.
A standard signal represents a qualified directional transition below the Strong threshold.
A STRONG signal represents a transition whose Trend Strength reaches the Strong threshold.
An EXTREME signal represents a transition whose Trend Strength reaches the highest configured classification threshold.
These labels describe the strength of the conditions detected by the model. They are not predictions of future returns.
────────────────────────────
CONFIRMED-BAR SIGNAL ENGINE
────────────────────────────
Signal generation uses confirmed-bar logic.
A new directional signal is accepted only when the current chart bar is confirmed.
This prevents temporary intrabar conditions from being treated as completed signals before the candle closes.
The engine also maintains directional signal state.
Once a bullish signal has been generated, another bullish signal is not repeatedly produced while the signal state remains bullish.
A new bullish event becomes possible after the engine has transitioned through the opposite qualified state, and vice versa.
This creates cleaner transition-based signal behavior.
────────────────────────────
VOLATILITY-ADAPTIVE TREND RIBBON
────────────────────────────
The trend ribbon provides a visual representation of directional state and adaptive market conditions.
Its base width is calculated using ATR.
The final ribbon width also incorporates the current Trend Strength Score.
As calculated trend strength increases, the ribbon can expand according to the user-defined Trend Strength Width Effect.
During bullish states, the ribbon is positioned below the Gaussian baseline.
During bearish states, the ribbon is positioned above the Gaussian baseline.
The ribbon consists of multiple visual layers, creating a clear distinction between the Gaussian baseline and the outer volatility-adjusted trend zone.
This makes direction and changes in trend intensity easier to interpret directly from the chart.
────────────────────────────
VISUAL INTERPRETATION
────────────────────────────
GREEN GAUSSIAN / GREEN RIBBON
The Gaussian baseline is rising and the engine is operating in a bullish directional regime.
RED GAUSSIAN / RED RIBBON
The Gaussian baseline is falling and the engine is operating in a bearish directional regime.
BUY / SELL
A new directional setup has passed the minimum qualification requirements.
STRONG BUY / STRONG SELL
A qualified transition has reached the configured Strong Trend Strength threshold.
EXTREME BUY / EXTREME SELL
A qualified transition has reached the configured Extreme Trend Strength threshold.
────────────────────────────
USER CONTROLS
────────────────────────────
Gaussian Engine:
• Source
• Gaussian Period
• Gaussian Poles
Momentum Confirmation:
• Enable / Disable Momentum Confirmation
• RSI Period
• ROC Period
• RSI Neutral Zone
Trend Strength:
• ATR Period
• Gaussian Slope Sensitivity
• Price Distance Sensitivity
• Minimum Signal Strength
• Strong Signal Threshold
• Extreme Signal Threshold
Adaptive Trend Ribbon:
• Show / Hide Adaptive Trend Ribbon
• Ribbon ATR Width
• Trend Strength Width Effect
Visual Settings:
• Show Trading Signals
• Color Price Bars
• Show Gaussian Trend Line
────────────────────────────
ALERTS
────────────────────────────
Six dedicated TradingView alert conditions are included:
• TRADION BUY
• TRADION STRONG BUY
• TRADION EXTREME BUY
• TRADION SELL
• TRADION STRONG SELL
• TRADION EXTREME SELL
This allows each signal classification to be monitored independently.
────────────────────────────
PRACTICAL USE
────────────────────────────
TRADION Gaussian Trend Engine can be used as:
• A directional trend filter
• A trend-strength visualization tool
• A momentum-confirmed transition detector
• A volatility-adaptive trend framework
• A confirmation layer for discretionary analysis
• An alert-based trend monitoring system
Because sensitivity depends on the selected parameters, instrument and timeframe, users should evaluate settings according to their own methodology.
Higher sensitivity may detect directional changes earlier but can increase exposure to market noise.
Greater smoothing and higher qualification thresholds can reduce signal frequency but may identify transitions later.
────────────────────────────
DESIGN PHILOSOPHY
────────────────────────────
The central idea behind TRADION Gaussian Trend Engine is that trend direction alone provides incomplete information.
A rising filter does not necessarily represent a strong trend.
For this reason, the engine evaluates four questions:
1. What direction is the Gaussian structure moving?
2. How significant is that movement relative to volatility?
3. Is price positioned consistently with that direction?
4. Does momentum support the directional structure?
The Trend Strength model then measures the degree of alignment between these components.
This creates a unified framework for analyzing direction, momentum, volatility and trend intensity rather than treating each component as an isolated indicator.
────────────────────────────
IMPORTANT NOTES
────────────────────────────
TRADION Gaussian Trend Engine is an analytical indicator, not a strategy and not a prediction system.
BUY, STRONG BUY, EXTREME BUY, SELL, STRONG SELL and EXTREME SELL labels represent mathematical classifications produced by the indicator's current conditions.
They do not guarantee future price direction, profitability or trade outcomes.
Signals are confirmed at bar close, but confirmed-bar processing does not eliminate normal market risk or signal lag.
Users should independently evaluate the indicator and apply appropriate risk management.
For research and educational purposes. Indicador

Indicador

Median Deviation Anchor | TR🎯 Overview
Median Deviation Anchor | TR is a trend‑detection oscillator that uses a percentile‑based median of a chosen moving average as its central anchor. It measures price deviation relative to this median, scaled by ATR bands and standard deviation zones, to generate bullish/bearish signals. The oscillator is smoothed, normalized, and presented with rich visual feedback including gradient candles, dynamic fills, reversal markers, and a persistent trend table. It’s designed to capture trend strength and reversals with a robust statistical foundation.
⚙️ Core Calculations
1. Moving Average Baseline
The indicator first computes a moving average of the Source (default close) using one of 13 moving average types (EMA, SMA, RMA, WMA, VWMA, HMA, DEMA, TEMA, TRIMA, FRAMA, SWMA, ALMA, T3).
User‑adjustable: Length (default 8), Factor/Sigma for ALMA/T3.
2. Median Anchor
Median_Val = ta.percentile_nearest_rank(MA, Median_Length, Median_per)
– This returns the value at the given percentile (default 50ᵗʰ percentile, i.e., the median) of the MA over Median_Length (default 61) bars.
→ This median acts as the dynamic “center” of the trend.
3. Deviation Bands (Upper/Lower Anchors)
ATR Band (based on ta.atr(ATR_Length)):
Upper_ATR = Median_Val + ATR_Mult * ATR
Lower_ATR = Median_Val - ATR_Mult * ATR
Standard Deviation Band (based on ta.stdev(Median_Val, Length_SD)):
SD_L = Median_Val + ST_Dev (upper +1σ)
SD_S = Median_Val - ST_Dev (lower -1σ)
4. Raw Oscillator (rawOsc)
Two conditions decide the raw value:
Bullish condition (L_Bull_MDA): (Source > Lower_ATR) and (Source >= SD_L)
Then bullForce = (Source - Median_Val) / (Median_Val - Lower_ATR) * 100
→ positive values (0 to +∞)
Bearish condition (S_Bear_MDA): (Source < Upper_ATR) and (Source <= SD_S)
Then bearForce = (Source - Median_Val) / (Upper_ATR - Median_Val) * 100
→ negative values (0 to –∞)
Otherwise rawOsc = 0.
5. Smoothing & Clamping
oscValue = ta.ema(rawOsc, smoothOsc) (user‑defined smoothOsc length, default 5).
osc = math.min(math.max(oscValue, -2000), 2000) – clamps extreme values.
📊 Normalisation & Dynamic Styling
Momentum for Fill Transparency:
absOsc = math.abs(osc) → maxAbsOsc = ta.highest(absOsc, 50) → normalised normAbsOsc → Fill_Transp_OSC = int(math.max(0, math.min(100, 35 - (normAbsOsc * 25))))
→ higher oscillator magnitude ⇒ less transparency (more vivid fills).
Gradient Coloring for Candles:
oscNorm is re‑scaled over the last 50 bars to → candle color interpolates between DnC (bearish) and UpC (bullish) using color.from_gradient.
Color Themes: 9 predefined schemes (Classic, Modern, Heat, Robust, Accented, Monochrome, Moderate, Aqua, Cosmic) with custom bullish/bearish colours.
📈 Signal System
1. Trend Determination (Trend_MDA)
Bullish when osc > Upper_Band (user‑defined Long Threshold, default 50). Sets Trend_MDA = 1.
Bearish when osc < Lower_Band (user‑defined Short Threshold, default -50). Sets Trend_MDA = -1.
Otherwise holds previous value.
2. Reversal Signals (plot as triangles)
Bullish Reversal (reversalBull): Trend_MDA == 1 and Trend_MDA == -1 → green triangle below bar.
Bearish Reversal (reversalBear): Trend_MDA == -1 and Trend_MDA == 1 → red triangle above bar.
3. Alerts (4 conditions)
Bullish MDA – triggered when isBull_MDA (osc > Upper_Band)
Bearish MDA – triggered when isBear_MDA (osc < Lower_Band)
Bullish Cross – ta.crossover(osc, 0)
Bearish Cross – ta.crossunder(osc, 0)
🎨 Visual Features
Trend Table Displays “⬆️ Bullish” or “⬇️ Bearish” (or “➖ Neutral”)
📖 Interpretation Guide
Positive values (osc > 0) indicate price is above the median anchor (bullish bias).
Negative values (osc < 0) indicate price below the median (bearish bias).
Crossing ±50 (default thresholds) signals a confirmed trend change (bullish >50, bearish < -50).
Crossing zero may be used as an early warning of trend shift (alerts available).
Reversal triangles appear when the oscillator crosses a threshold in the opposite direction after being in the other regime – these are potential entry/exit signals.
The dynamic fill transparency highlights momentum: intense colour = strong price deviation.
🚨 Alert Summary
Four alert conditions are ready for automation:
Bullish MDA – enters long zone (osc > Upper_Band)
Bearish MDA – enters short zone (osc < Lower_Band)
Bullish Cross – oscillator crosses above zero
Bearish Cross – oscillator crosses below zero
All alerts can be enabled via the TradingView alerts panel. Indicador

Multi EMA Ribbon (8 Lines) - Style Zone & Labels### Overview
The **Multi EMA Ribbon (8 Lines) with Trend Dashboard** is an all-in-one trend analysis tool designed to give traders both visual chart intuition and real-time quantitative metrics.
By combining an 8-period Exponential Moving Average (EMA) ribbon with a real-time status dashboard, this script helps you quickly identify trend directions, momentum shifts, volatility squeezes, and dynamic support/resistance levels without cluttering your chart.
---
### Key Features
* **8 Fully Customizable EMAs:** Pre-configured with widely used default lengths (10, 20, 50, 100, 200, 400, 600, 800) to cover micro-scalping up to macro-trend levels.
* **Integrated Real-time Dashboard Table:**
* Displays exact price levels for all 8 EMAs.
* Shows real-time status (`BULL 🠅` or `BEAR 🠇`) based on price position relative to each EMA.
* Features an **Overall Trend Score** (e.g., 8/8 Bull = Strong Trend) for instant high-level bias confirmation.
* Fully customizable position (Top Right, Bottom Left, etc.) and text size.
* **Visual Fill Zones (Ribbon Effect):** Smooth background fills between adjacent EMAs allow you to instantly spot trend expansion, compression (squeezes), and reversals.
* **Fully Configurable in Style Tab:** All filled background zones are native plots, meaning you can toggle them individually or adjust their colors and transparency directly in the "Style" settings.
* **Clean & Dynamic Labels:** Clean numerical period tags project to the right of the current bar (with adjustable offset) to keep the chart clutter-free.
---
### How to Use
#### 1. Visual Chart Ribbon Analysis
* **Bullish Alignment:** When shorter EMAs (10, 20) are layered above longer EMAs (200, 800) and expanding outward, the market is in a strong uptrend.
* **Bearish Alignment:** When shorter EMAs are layered below longer EMAs, the market is in an established downtrend.
* **Compression / Squeeze:** When EMA lines converge tightly, volatility is dropping—often signaling an impending breakout.
* **Dynamic Support/Resistance:** During pullbacks in strong trends, price often tests specific EMA zones (e.g., EMA 20–50 or EMA 200) before resuming the primary trend.
#### 2. Dashboard Table
* **Quick Health Check:** Look at the **Overall Score** row at the bottom of the table:
* **6/8 to 8/8 Bullish (`STRONG`):** High probability long conditions / strong uptrend momentum.
* **0/8 to 2/8 Bullish (`WEAK`):** High probability short conditions / strong downtrend momentum.
* **3/8 to 5/8 (`MIXED`):** Consolidation, choppy market, or transition period.
---
### Inputs & Configuration
* **EMA Settings (Length and Color):** Adjust individual lengths, visibility, and line colors.
* **Display Settings:**
* `Show discreet EMA labels on the right`: Toggle right-side period tags.
* `Label offset to the right (bars)`: Adjust spacing of labels from the last bar.
* `Price Source`: Choose price input (Default: `Close`).
* **Dashboard Table Settings:**
* `Show EMA Dashboard Table`: Enable or disable the table.
* `Table Position`: Choose screen alignment (Top Right, Bottom Right, Top Left, Bottom Left).
* `Table Size`: Select display size (Tiny, Small, Normal).
---
### Disclaimer
This script is created for educational and analytical purposes only. Moving averages are lagging indicators and should always be combined with proper risk management, market structure, and volume analysis. Indicador

OminousLine EMAs (13/21/55/200)
OminousLine EMAs (13/21/55/200)
OminousLine EMAs is a clean and customizable trend-following indicator that combines four Exponential Moving Averages — EMA 13, 21, 55, and 200 — in a single chart overlay.
The indicator is designed to provide a clear visual overview of short-, medium-, and long-term market trends while keeping the chart simple and easy to read.
EMA Structure
The four default moving averages represent different layers of market momentum:
EMA 13 — Fast-moving EMA for short-term price action and momentum.
EMA 21 — Short-term trend reference that provides a slightly smoother view of price movement.
EMA 55 — Intermediate trend indicator that helps filter short-term market noise.
EMA 200 — Long-term trend reference commonly used to evaluate the broader market direction.
Trend Alignment
The relationship between the four EMAs can help visualize the current market structure.
A bullish EMA alignment may occur when:
EMA 13 > EMA 21 > EMA 55 > EMA 200
When the averages are aligned and separating upward, it can indicate increasing bullish momentum.
A bearish EMA alignment may occur when:
EMA 13 < EMA 21 < EMA 55 < EMA 200
When the averages are aligned and separating downward, it can indicate increasing bearish momentum.
When the EMAs begin moving closer together, it may indicate consolidation or weakening directional momentum.
Dynamic Support & Resistance
Moving averages can also act as dynamic reference areas during trending markets.
Price reactions around the EMA 13, 21, 55, or 200 can provide additional context when analyzing pullbacks, trend continuation, or changes in market structure.
These areas should not be considered fixed support or resistance levels.
Customization
OminousLine EMAs is fully customizable.
For each EMA, users can independently adjust:
EMA length
Visibility
Line color
Line width
Default configuration:
EMA 13 — Orange
EMA 21 — Cyan
EMA 55 — Amber
EMA 200 — Purple
The default colors are designed to provide clear visual separation, particularly on dark chart backgrounds.
How to Use
OminousLine EMAs can be used to help analyze:
Short-, medium-, and long-term trend direction
Bullish and bearish EMA alignment
Changes in momentum
EMA crossovers
EMA compression and expansion
Price interaction with moving averages
Potential dynamic support and resistance areas
The indicator can be used across different markets and timeframes. Traders can customize the EMA periods and appearance to suit their own analysis and trading methodology.
Important Notice
OminousLine EMAs is a visual trend-analysis tool and does not automatically generate buy or sell signals.
EMA alignment, crossovers, and price interactions should not be interpreted as guaranteed trading opportunities. The indicator is intended to complement other forms of technical analysis, market structure analysis, and appropriate risk management.
For informational and educational purposes only. Not financial advice. Indicador

Multi-Timeframe MA & VWAP FrameworkOverview
The Multi-Timeframe MA & VWAP Framework is a highly customizable, all-in-one trend and volume tracking tool. Designed for professional and minimalist traders, this framework allows you to build the ultimate moving average ribbon without cluttering your charts.
Instead of stacking multiple indicators, this single script gives you access to 10 fully customizable moving averages, 3 true time-based Rolling VWAPs, and integrated SSL Hybrid baselines—all controllable via clean master toggles and right-edge labels.
🔑 Core Features
1. 10 Fully Customizable Moving Averages
Configure up to 10 independent MAs. For each line, you can select:
Type: SMA, EMA, WMA, VWMA, RMA, HMA, ALMA, DEMA, TEMA, and standard VWAP.
Timeframe: Native Multi-Timeframe (MTF) support. Plot 1H, 4H, 1D, or 1W MAs directly on your intraday chart.
Style: Line, Circles, Crosses, Stepline, or Area.
Color & Visibility: Individual toggles for every single MA.
2. Group Master Toggles
To keep your chart perfectly clean, MAs are grouped into three categories (1-4, 5-8, 9-10). Use the Master Toggles to instantly show or hide entire groups without changing individual settings.
3. True Rolling VWAP Engine
Standard VWAPs reset every session. This framework includes a custom-built True Rolling VWAP engine that uses arrays to track exact time windows.
Set a Multiplier and a Timeframe (e.g., 7x 1D for a 7-day Rolling VWAP, or 2x 4H for an 8-hour Rolling VWAP).
The engine dynamically prunes old volume data, ignoring weekends and chart gaps for mathematically accurate institutional volume tracking.
4. Integrated SSL Hybrid Baselines (MAs 9 & 10)
By selecting "SSL1" or "SSL2" for MA 9 and 10, you activate the SSL Hybrid baseline logic. This plots a Hull Moving Average (HMA) baseline with Keltner Channel bands. The baseline dynamically changes color (Bullish, Bearish, Neutral) based on price location, providing instant trend confirmation.
5. Smart Right-Edge Labels
Keep track of your MAs without guessing. The framework places tiny, clean labels on the right edge of the chart detailing the MA Type, Length, and Timeframe (e.g., EMA 50 4H). Label sizes are adjustable (Tiny, Small, Normal).
6. Optional Pair Fills
Enable translucent fills between paired MAs (1-2, 3-4, 5-6, etc.). The fill color dynamically changes based on which MA is currently higher, acting as a subtle visual cue for trend shifts and volume divergence.
🛠 How to Use This Framework
Start Clean: By default, MAs 1-4 are active. Use these for your primary trend (e.g., VWMA/SMA 50 combinations).
Add MTF Anchors: Enable MAs 5-8 and set their timeframes to higher periods (e.g., 4H, 1D, 1W) to see where higher-timeframe price action is respecting moving averages.
Activate SSL for Trend Confirmation: Turn on MA 9 or 10, set the type to SSL1/SSL2, and watch the baseline dynamically shift colors to confirm your trade direction.
Add Institutional Volume: Enable the Rolling VWAPs. A 1x 1D RVWAP gives you the standard daily anchor, while a 30x 1D RVWAP gives you a macro 30-day institutional average.
Declutter: If you only want to look at the SSL and a single EMA, uncheck the Master Toggles for the groups you don't need.
📌 Credits & Inspirations
This framework is an open-source compilation heavily modified and custom-coded into a unified suite. Special thanks to the original concepts:
Rolling VWAP concept: TradingView Official Rolling VWAP
VWMA/SMA Divergence logic: VWMA/SMA Breakout and Divergence Detector
SSL Hybrid baseline: SSL Hybrid by KivancOzbilgic
⚠️ Disclaimer
This script is provided for educational and analytical purposes only. It is not financial advice. Always test indicators on a paper trading account before incorporating them into a live trading strategy. Indicador

3 EMA Trend by TradeZeneThree EMAs in 1 Indicator
Overview
The 3 EMAs in 1 Indicator is a clean, lightweight trend-following tool that plots three customizable Exponential Moving Averages (EMAs) on a single chart, making it easy to identify the short-, medium-, and long-term market trend at a glance.
Designed for traders who prefer simplicity over clutter, this indicator provides visual trend confirmation through subtle background coloring while keeping the chart clean and easy to read.
Features
✅ Three fully customizable EMAs
EMA 1 (Default: 9)
EMA 2 (Default: 27)
EMA 3 (Default: 108)
✅ Individual show/hide options for each EMA
✅ Automatic trend background
Light Blue: Price is above EMA 2 (Bullish Bias)
Light Orange: Price is below EMA 2 (Bearish Bias)
✅ Lightweight and fast
Works smoothly on all timeframes and market instruments.
Suggested Usage
Many traders use the three EMA combination to:
Identify the overall market trend
Stay on the right side of momentum
Filter counter-trend trades
Improve trade selection alongside price action
Combine with support/resistance, VWAP, market structure, or volume analysis
This indicator is intentionally simple so it can fit into almost any trading strategy.
Default Settings
EMA 1: 9
EMA 2: 27
EMA 3: 108
These values can be customized to suit your trading style.
Disclaimer
This indicator is provided for educational and informational purposes only. It should not be considered financial or investment advice. Trading involves risk, and past performance does not guarantee future results. Always perform your own analysis and manage risk appropriately.
If you find this indicator useful, please consider giving it a 👍, adding it to your favorites, and share with your trader friends.
Happy Trading! Indicador

RibbonFlux MA - Adaptive Flow [AFD]
Your averages are stacked and pointing the same way - but is that move widening, just holding, or already compressing?
Every MA ribbon on the shelf draws the same two or three lines and floods the gap with one colour at one opacity. So a ribbon that has pulled four ATR apart and is still separating looks exactly like a ribbon that has collapsed onto itself. The fill never tells you anything the lines didn't, which is why most people end up reading the lines and ignoring the shading entirely.
RibbonFlux makes the space between the lines carry the information. The gap is measured against ATR, ranked against its own recent history, and the shading answers to that: it deepens while the legs separate in agreement, and drains to a restrained neutral the moment they compress or lose their order. Same averages you already read - the space between them now states which of four conditions it is in.
WHY IT MATTERS
Separation and compression are the two things an MA ribbon actually knows, and the standard ribbon throws both away by drawing them identically. RibbonFlux spends its whole visual budget on that one distinction. It describes geometry already on your chart - never a prediction of what comes next, and never an instruction to act.
AT A GLANCE
Three independent averages - Lead, Base, and an optional Third. Each picks its own method, length (2-250) and price source, and a single enabled average still draws on its own.
Eight methods per slot - EMA, SMA, WMA, VWMA, HMA, RMA (Wilder), McGinley Dynamic, Fibonacci EMA Composite. Mixed freely: an HMA Lead over an EMA Base over an RMA Third is a valid setup.
Seven price sources per slot - Open, High, Low, Close, HL2, HLC3, OHLC4. Set per average rather than globally, and always on the chart timeframe.
The Flow Phase Engine - four conditions drive the fill's colour and depth: coherent expansion, stable flow, compression, mixed structure. Display only, and they never touch the MA values.
Each leg measured separately - Lead/Base and Base/Third are scored independently, so one fill can be compressing while the other expands. A single-opacity ribbon cannot show that.
Twelve palettes - Ocean, Indigo, Ember, Mono, Forest, Gold, Violet, Orderflow, Midnight, Copper, Arctic, Carbon. Or set Line color mode to Custom for a fixed colour per average, independent of the flow.
Line width and line style - 1 to 4 pixels, and Solid, Stepped, Dotted or Crosses. Applied to every core line and both halo tiers together, so the whole system thins or thickens as one.
Optional flow candles - bodies, wicks and borders take the relationship colour. Off by default, and under Adaptive dynamics they turn neutral during compression along with the ribbon.
Deliberately quiet - seven plots, two fills, one optional candle overlay. No alerts, no arrows, no dashboard, no labels, no boxes, no trendlines, nothing else drawn.
THE FOUR FLOW PHASES
Each leg of the ribbon is classified on every bar, and its own fill responds. Nothing here produces an event, and no phase ranks, scores or grades the market.
Coherent expansion - the enabled averages are in order, sloping the same way, and that leg is widening. Deepest shading: the phase factor is 1.00.
Stable flow - in order and sloping together, but the leg is not widening. Held back at 0.75.
Compression - the leg's ATR-normalized spacing sits in the bottom fifth of its own last 100 bars. Restrained neutral colour, and a phase factor of 0.00, which leaves depth at its 0.35 floor.
Mixed structure - the ordering or the slope agreement has broken. Restrained neutral colour, minimal shading at 0.25.
Compression uses a deadband, not a single threshold: a leg enters compression at a percent rank of 20 or below and only leaves it at 30 or above, so a leg hovering near one number does not flicker between two appearances. Before 100 bars of history exist, no leg is classified as compressed.
THE MECHANICS, STATED PLAINLY
ATR spacing = abs(faster average - slower average) / max(ATR(14), one tick)
leg depth = 0.35 + 0.65 x clamp(ATR spacing, 0, 1) x phase factor, then EMA-smoothed over the Flow response length
compression: enter at percent rank <= 20 over 100 bars, leave at >= 30
ordered: Lead > Base (> Third), or Lead < Base (< Third)
Flow response sets one number used three ways - the slope lookback, the expansion lookback, and the smoothing length: Quick is 2 bars, Balanced 3, Smooth 5. Setting Ribbon dynamics to Fixed bypasses the engine and holds each fill at the opacity you selected.
HOW IT DIFFERS FROM A STANDARD MA RIBBON
The fill is measured, not decorative - opacity is a function of ATR-normalized spacing and phase, recomputed every bar. A conventional ribbon fills the gap at a constant tone however wide or narrow it is.
Both legs are scored on their own terms - the Lead/Base fill and the Base/Third fill can disagree, so compression in the inner leg does not mute the outer one, or the reverse.
Compression is relative to the instrument, and sticky - a percent rank of its own history with a 20/30 deadband, not a fixed price or tick distance. It travels across symbols and timeframes without retuning.
Two methods a ribbon rarely offers - McGinley Dynamic and a Fibonacci EMA Composite. The composite is the equal-weight mean of five EMAs at Fibonacci-scaled periods; McGinley scales its own step by the fourth power of the price ratio.
The arithmetic ships with an independent open-source reference implementation - every documented formula is reproducible rather than asserted. A trust signal, not the pitch: what you are here for is the ribbon, not the tests.
THE VISUALS
Lead and Base - a crisp core line plus two restrained halo tiers each. At the default width of 2 the Lead halos are 6 and 4 pixels and the Base halos 5 and 3; Line width scales all of it together.
Glow - Off, Soft, Balanced, Rich, with opacity following Lead/Base spacing independently of the ribbon. So the lines themselves brighten as the pair separates, with a floor so they never vanish.
Ribbon shading - Off, Soft, Balanced, Rich sets the maximum depth the Flow Phases then modulate. Off removes both fills and leaves the lines.
A valid Third MA - one crisp line plus its own Base-to-Third shade. It also joins the ordering and slope tests, so enabling it makes coherence a three-line condition.
Line style - Stepped holds each value until the next bar. Dotted and Crosses place one mark per bar, so spacing follows bar width and opens up as you zoom in. Pine's plot() has no stroked dotted or dashed line, and this script uses no drawing objects to fake one.
Layering - the lines and fills draw in front of the candles, not behind them. Deliberate, so the optional flow candles can colour wicks and borders as well as bodies; if it reads heavy, Line width 1 or Glow Soft thins it.
HOW TO USE IT
Start with the defaults - Close EMA 9 over Close EMA 21, Ocean, Balanced glow and shading, Adaptive dynamics. Chosen for readability, not tuned as trading parameters.
Enable the Third MA for slower context - it defaults to Close EMA 50. Ordering then requires all three in sequence, a stricter condition than two.
Reach for Flow response first - Quick if the shading feels sluggish, Smooth if it feels twitchy. It is the one control that changes how fast the appearance reacts.
Set Ribbon dynamics to Fixed to switch the engine off - a plain constant-opacity ribbon, for comparing against what you ran before. Everything else, from palette to custom colours to width, style, glow and candle colouring, is taste: set it once and leave it.
WHAT IT DELIBERATELY DOES NOT DO
It issues no alerts and has no alert conditions at all. It draws no arrows, entries, retests, setup zones, targets or labels, keeps no dashboard or readout, and ranks, scores and grades nothing. It makes no accuracy, reliability, profitability, probability or future-result claim of any kind. Moving averages are lagging transformations of price that has already printed: visible separation, alignment or colour establishes neither future direction nor the quality of any trade. Educational chart context only - not financial advice.
DATA, TIMEFRAMES, AND WHAT TO CHECK YOURSELF
Everything is computed on your chart's own timeframe and data - there are no higher-timeframe requests anywhere in the source, so there is no lookahead argument to disclose and no second feed to reconcile against your chart.
Any MA moves while its bar is still forming , and two parts of this script also carry state from bar to bar: the McGinley recursion and the compression deadband. That describes the mechanism. Confirm it with the bar-replay tool on your own symbol and timeframe before relying on it - a description of mechanism is not that check, and nothing here claims to be.
The averages read chart OHLC - on Heikin Ashi, Renko, Range or similar they average those synthetic values, not traded prices. Use standard time-based candles if you want the averages to describe real prices.
VWMA needs usable volume, and the Fibonacci EMA Composite needs a length of 8 or more - each is simply unavailable otherwise. A selected calculation that cannot be produced stays unavailable: the script never silently substitutes another method.
McGinley seeds from an SMA of its own length, then advances by previous + (source - previous) / (0.6 x length x ratio^4). If its source or recurrence goes invalid the line goes unavailable and reseeds only after the next contiguous valid window.
Identical Lead and Base settings leave nothing to read - both lines still draw, but the ribbon and flow candles switch off and the lines fall back to neutral. A Third duplicating Lead or Base likewise draws its line while taking no shade and no phase depth.
ORIGINALITY AND CREDIT
Ribbon indicators are old ground; what is new here is that the fill is a measurement rather than a decoration - ATR-normalized leg spacing, a relative compression rank with hysteresis, and per-leg depth, all resolved into colour and opacity and nothing else. The engine is deliberately confined to display, and the surface is deliberately small.
Open source under the Mozilla Public License 2.0. (c) Auction Foundry LLC.
This indicator describes the geometry of averages computed from your chart's own price history. It is not a forecast, not a signal, and not financial advice. Indicador

Trender [IQ]IQ Trender - TradingIQ
🔹 OVERVIEW
IQ Trender is a non-repainting trend rail built around one simple visual language:
Flat = range. Ramp = trend. Brightness = conviction.
Most trend tools try to follow every movement in price. In sideways conditions, that can leave you reading a line that bends, twitches, and changes direction inside the same noise you were trying to filter.
IQ Trender is designed to behave differently. While the market remains inside its adaptive hold zone, the rail stays deliberately flat. When the underlying trend evidence becomes strong enough, it commits to a rising or falling leg and moves in one direction until that condition genuinely changes.
The result is a clean distinction between three market states:
Holding - the rail is flat and the market is being treated as a range or consolidation.
Rising - the rail has committed to an upward leg.
Falling - the rail has committed to a downward leg.
Direction is shown by color. Conviction is shown by color intensity and glow. The Trender Radar explains the current state numerically, while the Ghost Forecast extends the rail's present trajectory into a fading uncertainty cone.
This is a trend-reading and visualization tool, not a signal service. It does not issue buy or sell calls, and it makes no claim of profitability or predictive certainty.
🔹 THE ONE-LINE MENTAL MODEL
The fastest way to read IQ Trender is to ignore the mathematics at first and watch the shape of the rail:
A flat rail means the model is holding through noise.
An upward ramp means the model has committed to a rising leg.
A downward ramp means the model has committed to a falling leg.
A stronger glow means the estimated trend is showing greater statistical conviction.
This is the same sequence demonstrated in the walkthrough: a directional leg can flatten during a pause, pullback, or consolidation, then recommit if the broader move resumes. The bearish interpretation is the mirror image - falling leg, flat hold, then a renewed falling leg if downside evidence returns.
The flat section is important. It is not a prediction that a breakout is about to happen. It is the indicator saying that current movement has not earned a directional commitment.
🔸 HOW THE ENGINE WORKS
IQ Trender combines three separate jobs: estimating the trend beneath price, deciding whether that trend is statistically meaningful, and drawing a rail that cannot wiggle backward within a committed leg.
Track the underlying trend
A robust local-linear Kalman filter estimates the level and slope beneath the candles. Unlike a conventional moving average that applies a fixed weighting pattern, this is a state-estimation model: it updates its estimate from the difference between expected and observed price.
Large isolated deviations are reduced with a robust update, so a single wick cannot directly yank the rail to a new location. The model also adapts its measurement-noise estimate as conditions change.
⬞
Measure the uncertainty
The filter calculates an innovation deviation - a live estimate of how much movement is normal relative to its current model. IQ Trender uses that value to size the hold band.
When conditions are noisy, the tolerance can widen. When conditions are calmer, it can tighten. This lets the same mental model adapt across different symbols, price levels, and timeframes without using one fixed distance everywhere.
⬞
Test for commitment and change
The estimated slope is compared with its own uncertainty to produce conviction. Hysteresis uses separate thresholds for entering and leaving a committed trend, helping prevent repeated state changes near one boundary.
A two-sided cumulative change test also monitors standardized price surprises. That evidence helps the rail distinguish a genuine opposing change from ordinary counter-movement when a leg is already active.
⬞
Draw the rail
The visible rail is a separate, slew-limited ratchet guided by the Kalman center. Once an upward leg begins, the rail can only move upward until a valid reversal or hold condition is reached. Once a downward leg begins, it can only move downward.
That monotone-within-leg behavior is what creates IQ Trender's signature geometry: flat holds connected by clean directional ramps instead of a line that bends around every candle.
🔹 THE ADAPTIVE HOLD BAND
The shaded band is the rail's live range corridor.
While the rail is holding, the band opens around it to show the volatility-adjusted area in which price can move without forcing a directional leg. When the rail commits to a trend, the displayed band eases shut onto the rail because the model has left its holding state. When the rail becomes flat again, the band gradually reopens.
The band should be read as a model tolerance, not as conventional support and resistance. Price moving within it means the model can continue to hold. Movement beyond it contributes evidence for a new leg, but it is not, by itself, a guaranteed breakout or trade entry.
🔸 COLOR, GLOW & CONVICTION
IQ Trender communicates direction and commitment through one coordinated visual system:
Rising color - active upward leg.
Falling color - active downward leg.
Holding color - neutral, flat state.
Glow intensity - visual emphasis derived from the current conviction reading.
Conviction measures how strongly the estimated slope differs from zero relative to the model's uncertainty. It is a statistical strength reading, not the probability that a trade will win.
The palette is generated in the Oklab perceptual color space. Hue, lightness, and vibrancy can be adjusted as a coordinated system, while out-of-gamut colors are compressed toward neutral instead of clipping harshly.
Accessibility controls include deuteranopia, protanopia, and tritanopia modes, plus automatic contrast correction against the chart background. A selectable contrast target helps keep the rail and directional Radar accents legible across light and dark themes.
🔹 TRENDER RADAR
The Trender Radar is the live scorecard in the corner of the chart. It reports:
State - HOLDING, RISING, or FALLING.
Conviction - normalized trend commitment from 0-100%.
Slope - the rail's current rate of change per bar.
Hold Band - the current full width of the adaptive range corridor.
Behavior - the active Speed and Pursuit combination.
With Log Geometry enabled, slope is displayed as a percentage per bar and band width is expressed as a percentage of the rail. With linear geometry, both are shown in price units.
The Radar can be moved to any chart corner or disabled entirely.
🔸 GHOST FORECAST
The Ghost Forecast is a translucent forward projection of the rail's current slope.
Its centerline extends the rail's recent trajectory. The surrounding cone widens with distance to communicate increasing uncertainty, then fades away toward the horizon. Two growth modes are available:
√h - tighter near the live bar, then gradually widening like a random-walk spread.
Linear - uncertainty expands at a constant rate.
The forecast is rebuilt only at the live edge and never painted into historical bars. It can also be displayed while the rail is holding, where its centerline remains flat.
This feature is a trajectory read, not a price target. It answers, Where is the rail currently heading if its present slope persists? It does not answer, Where will price trade?
🔹 FLIP MARKERS & ALERTS
Optional markers identify confirmed changes in rail state:
▲ - committed to a rising leg.
▼ - committed to a falling leg.
◇ - flattened back into a hold, when hold markers are enabled.
Markers are created only on confirmed bars. Once printed, they do not move.
Matching alert conditions are included for:
Trender committed to a rising trend.
Trender committed to a falling trend.
Trender flattened into a hold.
These alerts report state changes in the model. They are not automated trade recommendations and should be interpreted in the context of the symbol, timeframe, market structure, and the user's own risk process.
🔸 SPEED - THE OVERALL TEMPO
Speed changes the rail's pursuit rate and the width of its hold zone together:
Glacier - calm, structural behavior for slower or higher-timeframe reading.
Slow - patient swing behavior with a wider hold zone.
Balanced - the recommended reference setting, balancing hold and tracking.
Fast - more reactive behavior for shorter intraday movement.
Scalp - the tightest and quickest micro follower.
Slower settings generally require more displacement and move the rail more gradually. Faster settings use a tighter band and pursue price more aggressively. A faster preset is not automatically better: responsiveness and noise rejection are opposing trade-offs.
🔸 PURSUIT - HOW A COMMITTED LEG MOVES
Pursuit changes the shape of an active leg without changing the underlying trend evidence:
Steady - a constant-speed ramp established when the leg begins.
Eased - pursuit speed scales with conviction and feathers toward the estimated center.
Snap - the most decisive pursuit, with a higher movement rate and faster conviction scaling.
On slower Speed presets, Snap can appear more step-like. Steady produces the cleanest constant ramps, while Eased creates a softer approach.
🔹 HOW TO READ IQ TRENDER
Start with state
Flat rail means the model is holding. Rising or falling rail means it has committed directionally. This gives the chart an immediate range-versus-trend read before any number is considered.
⬞
Weigh the leg
Use conviction, glow, and slope together. A bright rail with firm slope represents stronger model commitment. Fading conviction says the trend estimate is becoming less distinct from noise; it does not guarantee an immediate reversal.
⬞
Watch the sequence
One useful continuation framework is:
Rising rail.
Flat hold during consolidation or pullback.
New rising marker and renewed upward rail.
The bearish sequence is the inverse. This is a way to organize market context, not a complete entry system.
⬞
Keep the forecast in its proper role
Use the Ghost Forecast to visualize current trajectory and uncertainty. Do not treat the cone edge or centerline as a promised future level.
⬞
Confirm with your own process
IQ Trender can be combined with price structure, volume, liquidity, momentum, or a trader's existing risk framework. No single state, marker, or Radar value should replace position sizing and independent confirmation.
🔸 INPUTS
Behavior
Speed
Pursuit
Source & Geometry
Price Source
Use Log Geometry
Close with Log Geometry enabled is the recommended general-purpose setup for ordinary positive price series. Log mode keeps slope and band behavior proportional across different price levels.
Rail, Band & Glow
Hold Band on/off
Band transparency
Rail Glow on/off
Glow intensity
Glow spread
Rail line width
Colors
Rising, Falling, and Holding anchors
Global hue rotation
Lightness adjustment
Vibrancy adjustment
Conviction Color response
Accessibility
Color-Blind Mode
Auto Contrast
Contrast Ratio
State Readout
Show Trender Radar
Radar location
Forecast
Ghost Forecast on/off
Horizon in bars
√h or Linear cone growth
Show While Holding
Markers
Flip Markers on/off
Optional hold markers
Marker size
🔹 NON-REPAINTING BEHAVIOR
IQ Trender is calculated causally with no future-bar lookahead.
Confirmed historical rail values and confirmed flip markers remain where they were calculated. The current, still-open bar can update as new price arrives, as any live indicator can. The Ghost Forecast is intentionally rebuilt at the live edge because it represents the rail's current slope and uncertainty; it does not rewrite historical bars.
What was confirmed in history stays confirmed. What is still live remains live.
🔸 LIMITATIONS & HONEST NOTES
IQ Trender is an indicator, not a validated trading strategy. It makes no performance, win-rate, profit, or edge claim.
Kalman filtering is still a causal estimation process. It reduces noise but cannot remove lag, uncertainty, or false transitions.
Faster settings react sooner but can respond to more noise. Slower settings filter more movement but can confirm later.
A Holding state identifies insufficient directional commitment in this model; it does not guarantee that price will remain inside a range or that a breakout is imminent.
Conviction measures the strength of the estimated slope relative to uncertainty. It is not a probability of future direction or trade success.
The Ghost Forecast extrapolates the rail, not price. It is a visual scenario if the current trajectory persists, not a target or prediction.
Alerts and markers identify model state transitions only. They should not be treated as standalone entries or exits.
Results depend on symbol behavior, timeframe, data quality, and the selected Speed/Pursuit combination.
IQ Trender is built to make one difficult market question easier to see:
Is the market still ranging, or has a trend actually committed?
One rail. Three states. No hindsight redraws.
Indicador