Indicador

Indicador

Indicador

Indicador
Indicador

Indicador

Indicador

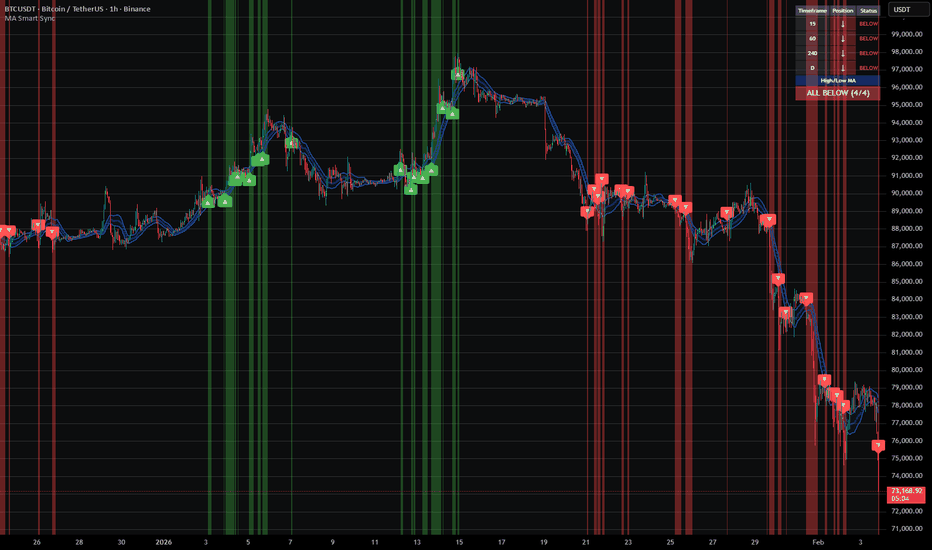
MA Smart SyncMA Smart Sync determines the market bias by evaluating the price position relative to a moving average channel on four independent timeframes and returning a confluence signal when a configurable number of them agree.
Unlike standard MTF trend indicators that rely on EMA crossovers or slope direction, this script builds a channel around each timeframe and classifies price into three discrete zones: above, below, or inside. The "inside" state acts as a neutral filter, preventing false confluence signals during consolidation — a key distinction from binary up/down dashboards.
The channel itself can be constructed using five different methods selectable from a single input: High/Low MA (separate MAs applied to high and low), Close ± ATR, Close ± Standard Deviation, Close ± percentage offset, or classic Bollinger Bands. All five use the same MA type and length inputs, making it straightforward to compare how different volatility envelopes behave on the same instrument without rebuilding the indicator.
How to use:
— Set four timeframes matching your trading plan (defaults: 15m, 1h, 4h, D).
— Choose the channel method that fits your instrument's volatility profile. ATR-based channels adapt well to forex; StdDev and Bollinger suit equities and indices.
— Set "Minimum Confluence" to 3 or 4. A value of 4 means all timeframes must agree before a signal fires.
— The background color and arrow labels update only when bias changes, keeping the chart clean.
— Use the status table (top-right) to monitor each timeframe independently and identify which TFs are lagging. Indicador
Indicador
Indicador

Indicador
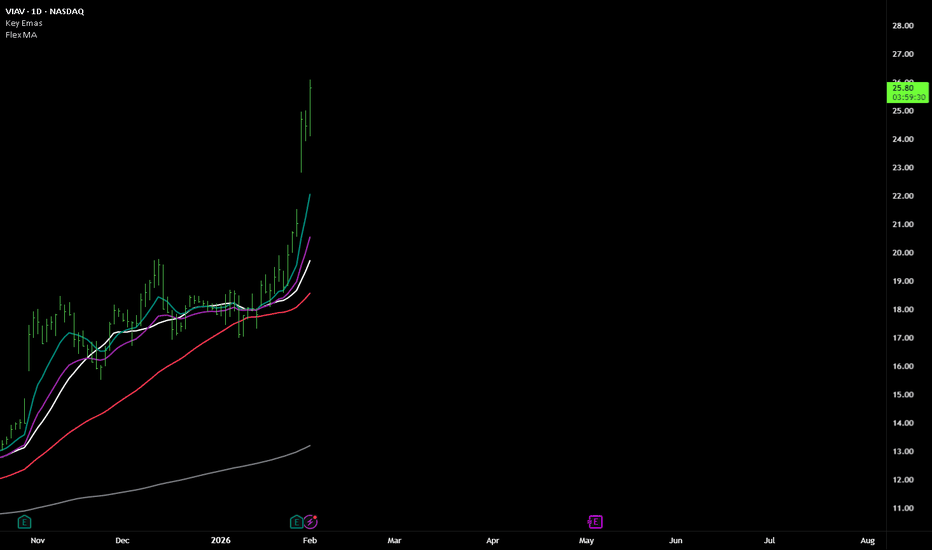
Multi Moving Averages (EMA / SMA Toggle) ConfigurableMulti Moving Averages (EMA / SMA Toggle) is a lightweight and highly configurable indicator designed to plot up to three moving averages on your chart with a clean and minimalist input panel.
The indicator allows you to switch seamlessly between Exponential Moving Averages (EMA) and Simple Moving Averages (SMA) using a single toggle, while preserving the same lengths, sources, and visual settings. Each moving average can be independently shown or hidden and fully customized for color, line width, and plot style.
This tool is ideal for traders who rely on multiple moving averages for trend identification, dynamic support and resistance, pullback analysis, and crossover-based strategies, while keeping their charts uncluttered and easy to read.
Key Features
Plot up to three moving averages
Global EMA / SMA toggle
Individual show / hide control for each MA
Customizable length, source, color, width, and style
Minimalist input layout with low scrolling
Fully compatible with the Style panel
Whether you prefer fast-reacting EMAs or smoother SMAs, this indicator adapts instantly to your workflow without requiring multiple indicators or duplicate settings. Indicador

Indicador

Indicador

Indicador
Indicador

Indicador
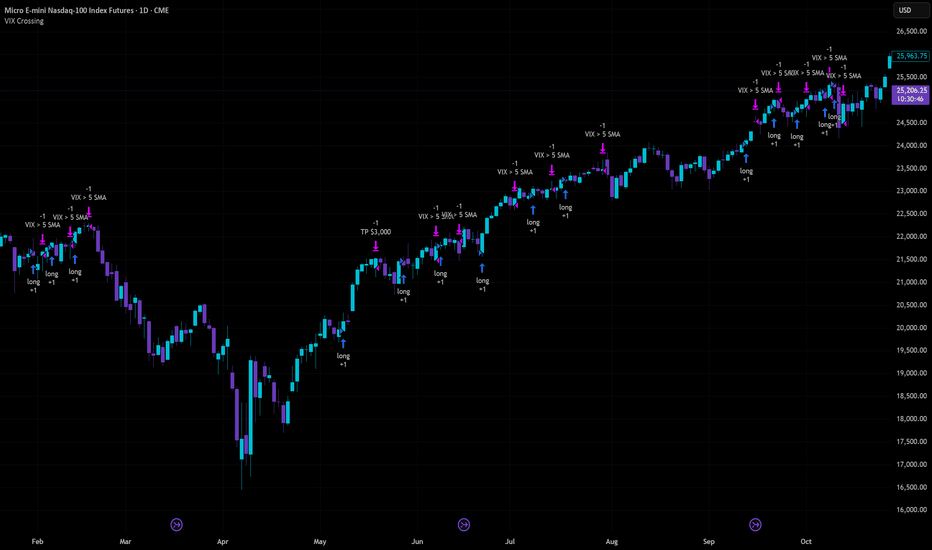
VIX Crossing# VIX Crossing Strategy
## Overview
VIX Crossing is a quantitative trading strategy that combines volatility signals from the VIX index with trend confirmation from the Nasdaq-100 (NDX) to generate long entry signals. The strategy employs multiple exit conditions to manage risk and lock in profits systematically.
## Strategy Logic
### Entry Condition
The strategy initiates a long position when:
- **VIX Crossunder**: The VIX closing price crosses below its 5-bar simple moving average (SMA), signaling a decrease in implied volatility
- **AND NDX Confirmation**: The Nasdaq-100 closes above its 21-bar exponential moving average (EMA), confirming uptrend strength
This dual-signal approach reduces false entries by requiring both volatility normalization and positive market momentum.
### Exit Conditions
The strategy automatically closes positions when any of the following conditions are met:
1. **VIX Crossover (Volatility Exit)**: VIX closes above its SMA, indicating rising volatility
2. **Time-Based Exit**: Position is force-closed after 10 bars from entry, preventing prolonged drawdowns
3. **Take-Profit Exit**: Position closes when unrealized profit exceeds $3,000 per contract
4. **Stop-Loss Exit**: Position closes when unrealized loss exceeds $1,500 per contract
Exit conditions are evaluated each bar while the position is open, with explicit logging of the exit reason for trade analysis.
## Configuration Parameters
| Parameter | Default | Purpose |
|-----------|---------|---------|
| VIX SMA Length | 5 | Smoothing period for VIX volatility baseline |
| NDX EMA Length | 21 | Smoothing period for Nasdaq-100 trend confirmation |
| Force Close After X Bars | 10 | Maximum holding period in bars |
| TP Amount per Contract | $3,000 | Profit target per contract |
| SL Amount per Contract | $1,500 | Loss limit per contract |
## Risk Management Features
- **Position Sizing**: Capital allocation based on profit/loss per contract rather than fixed units, allowing for scalable risk
- **Dual Risk Controls**: Combined time-based and price-based exits prevent extended exposure
- **Profit Asymmetry**: 2:1 profit-to-loss ratio encourages risk/reward discipline
- **Contract-Based Accounting**: Profit targets and stop losses scale with position size
## Capital Requirements
- **Initial Capital**: $50,000
- **Commission**: $3 per contract (cash-based)
- **Instrument**: Designed for index-based derivatives or equities with liquid options markets
## Technical Indicators Used
- Simple Moving Average (SMA) for VIX smoothing
- Exponential Moving Average (EMA) for NDX trend detection
- Crossover/Crossunder detection for signal generation
## Underlying Assumptions
1. VIX crossunder events represent mean-reversion opportunities in Nasdaq-heavy portfolios
2. NDX EMA confirmation filters out uncorrelated volatility spikes
3. 10-bar holding period aligns with typical mean-reversion timeframes
4. Contract-based profit targets accommodate varying leverage levels
Estratégia
Indicador

RS Proxy Suite (Sector-Weighted) - by kuokkuokIndicator Description
RS Proxy Suite (Sector-Weighted) is a Pine Script indicator for TradingView, designed for stock traders to calculate a stock's Relative Strength (RS) proxy score. This indicator simulates a market proxy universe by weighting multiple sector ETFs, evaluating a stock's strength relative to a benchmark like the SPX. Inspired by the M.E.T.S. (Multiple Edge Trading Strategy) system, it helps users identify market-leading stocks, potential breakout opportunities, and low-risk entry points.
Key Features and Benefits:
RS Proxy Rating (1–99 Score): Computes the stock's RS score (higher is stronger), aiding in screening super-strong stocks. A score above 80 indicates the stock outperforms most peers, making it a prime buy candidate.
RS Line and Blue Dot Divergence: Displays the RS line trend and marks RS-leading new high divergences. This acts like an "early warning light," signaling potential low-risk entries (e.g., when RS hits a new high but price hasn't caught up yet).
Sector-Weighted Design: Integrates Growth, Cyclical, Defensive, and Policy ETFs to simulate a comprehensive market environment. Weights are adjustable for flexibility across market phases.
Dashboard Display: A concise panel shows RS Rating, RS Trend, and Blue Dot status for quick decision-making.
Application Scenarios: Ideal for technical analysts to screen leaders, spot trend reversals, or confirm breakouts with VCP patterns (Volatility Contraction Patterns). Its strength lies in avoiding single-index bias for more stable RS assessments.
This indicator avoids subjective judgments, relying on quantitative momentum calculations to help traders "go with the flow" and reduce false breakout risks. Shared for community use—feedback welcome for improvements.
User Manual -
This manual guides you on installing and using the RS Proxy Suite (Sector-Weighted) indicator on TradingView. It's suited for daily or weekly charts, applicable to US stocks or markets correlated with SPX. Ensure your TradingView account supports Pine Script v6.
1. Installation Steps
Step 1: Log in to TradingView and open the Chart page.
Step 2: Click the "Indicators" button in the top toolbar, search for "RS Proxy Suite (Sector-Weighted)" (or paste the Pine Script code into the Pine Editor and add it).
Step 3: If installing from the Community Scripts library, click "Add to Chart"; for custom code, save and add to the chart.
Step 4: The indicator will appear below the chart (overlay=false). Confirm no error messages.
2. Parameter Adjustment Guide
The indicator offers multiple input parameters in TradingView's "Settings" panel. Defaults are optimized, but adjust based on market conditions. Here's a grouped breakdown:
Data Source:
Market Index SPX: Default "SP:SPX", changeable to other indices (e.g., "TVC:NDX").
Calculation Price: Default close (closing price), switch to high/low/open for sensitivity tweaks.
RS Momentum Periods (Adjustable):
Short Term (Default 63 days): Short-term momentum; larger values smooth it out.
Medium Term (Default 126 days): Mid-term momentum.
Long Term (Default 252 days): Long-term momentum for capturing major trends.
Momentum Weights:
Short Term Weight: Default 0.4, emphasizes recent performance.
Medium Term Weight: Default 0.2.
Long Term Weight: Default 0.4. Sum doesn't need to be 1; system normalizes automatically.
Sector Weights: Each ETF weight is independently adjustable (step 0.1). Defaults reflect sector importance, e.g., higher for growth ETFs.
XLK Weight (Technology): Default 1.5.
SOXX Weight (Semiconductors): Default 1.3.
XLY Weight (Consumer Discretionary): Default 1.2.
XLC Weight (Communication Services): Default 1.1.
XLG Weight (Large Cap Growth): Default 1.3.
XLI Weight (Industrials): Default 1.0.
XLF Weight (Financials): Default 1.0.
XLB Weight (Materials): Default 0.9.
XLE Weight (Energy): Default 0.9.
XLV Weight (Health Care): Default 0.8.
XLP Weight (Consumer Staples): Default 0.8.
XLU Weight (Utilities): Default 0.7.
XLRE Weight (Real Estate): Default 0.7.
PPA Weight (Aerospace & Defense): Default 0.9.
Adjustment Tips: Boost XLK/SOXX for tech-favorable markets; increase XLV/XLP for defensive phases.
Visualization Settings:
Show RS Line: Displays RS line (black) and 50-day MA (gray).
Show Blue Dot Divergence (Blue Dot): Marks divergence signals.
Show Dashboard: Enables the dashboard.
Dashboard Position: Choose locations like "Bottom Right".
3. Output Interpretation
RS Line: Black line shows stock strength vs. SPX; upward trend means outperforming. Gray line is 50-day MA—breaking above signals strength.
Blue Dot: Blue circle appears for RS leading price new highs (like a "coiled spring"), indicating potential low-risk entries. Confirm with: RS > 50-day MA and volume surge.
Dashboard:
RS Rating: Score 1–99; green (>80) for strong, yellow (50–80) neutral, red (<50) weak.
RS Trend: Green "Strong" or red "Weak".
Blue Dot: Blue "Present" or red "None".
Interpretation Analogy: RS Rating is like a stock's "health score"—above 80 is an "athlete" worth tracking for breakouts; Blue Dot is a "green light," but pair with volume to confirm true breakouts (avoid fakes).
4. Usage Examples
Screening Leaders: Add to AAPL chart—if RS Rating > 85 and Blue Dot appears, check if price nears VCP pivot; this is a low-risk buy setup.
Trend Judgment: Rising RS line with M.E.T.S. Stage 2 (uptrend) confirms trend-following trades.
Weight Tweaks: For defensive markets, raise XLV/XLU weights and recalculate RS Proxy.
5. Common Issues and Warnings
Q: Indicator not showing? A: Verify ETF symbols (e.g., AMEX:XLK) or switch timeframes.
Q: Inaccurate scores? A: Adjust periods/weights and backtest on historical data.
Q: Avoiding false breakouts? A: Combine with volume and support/resistance; Blue Dot is a alert, not a buy signal.
Warnings: Based on historical data; markets are volatile—use with other tools. Results are for reference only, not investment advice. Test in a demo account. Indicador

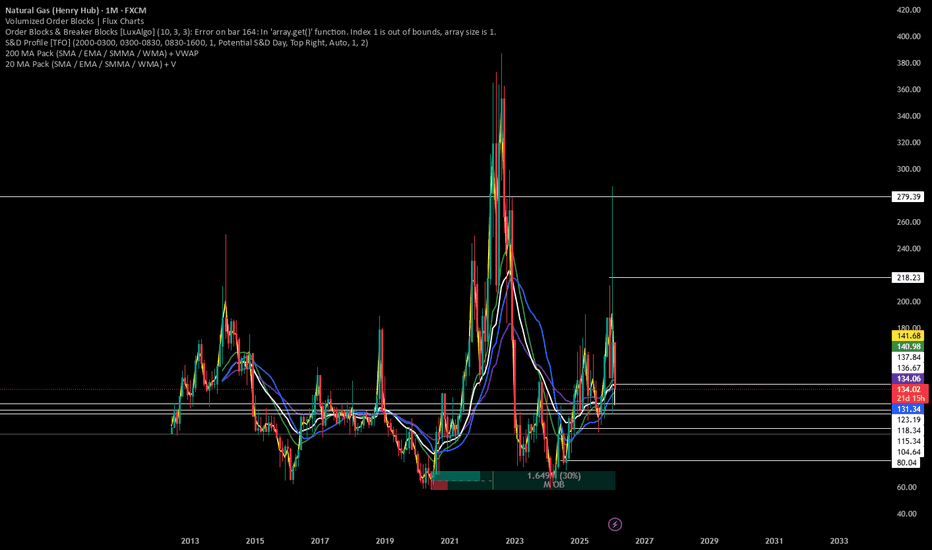
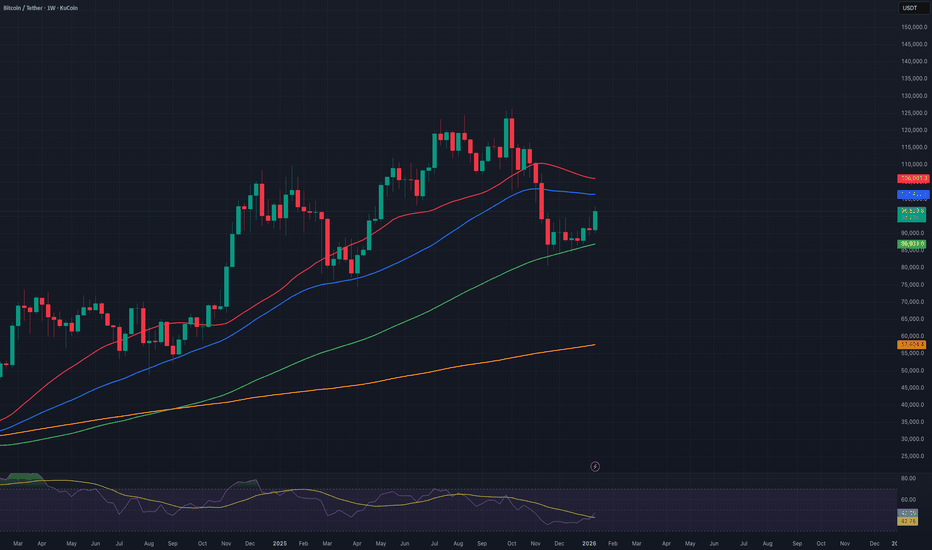
10x Multi-Timeframe SMA Suite📊 Professional Multi-Timeframe Simple Moving Average Indicator
Track up to 10 independent Simple Moving Averages from different timeframes on a single chart with full customization control.
✨ KEY FEATURES:
- 10 independent SMA lines
- Individual timeframe selection for each SMA (Daily, Weekly, Monthly, 4H, 1H, etc.)
- Flexible source options (Close, Open, High, Low, HL2, HLC3, OHLC4)
- Fully customizable colors
- Adjustable line thickness (1-5)
- Toggle on/off for each SMA
- Clean and intuitive interface
- Optimized for performance
🎯 DEFAULT SETTINGS:
First 4 SMAs are enabled by default:
- SMA 1: 200-period Daily (Red)
- SMA 2: 50-period Weekly (Blue)
- SMA 3: 100-period Weekly (Green)
- SMA 4: 200-period Weekly (Orange)
Additional 6 SMAs are ready to activate and customize as needed!
💡 PERFECT FOR:
- Multi-timeframe trend analysis
- Support and resistance level identification
- Long-term and short-term momentum tracking
- Professional traders who need multiple MAs simultaneously
⚡ Simple to use, powerful in functionality - All your moving averages in one indicator! Indicador
Daily SMA (Historical Plotting with RTH/ETH, (5))Daily SMA (RTH/ETH Dynamic Session Handling) — Midnight + RTH Open Locks
This indicator plots projected daily Simple Moving Averages (SMAs) on intraday charts by anchoring calculations to a Regular Trading Hours (RTH) daily SMA reference, while visualizing how the daily SMA evolves intraday during Extended Trading Hours (ETH) and RTH sessions.
When daily SMAs are evaluated strictly at the daily timeframe, they do not form a continuous intraday history and may appear flat on historical intraday bars until realtime bars begin updating. This script visualizes the daily SMA’s intraday progression while keeping the underlying daily SMA reference unchanged.
Purpose
Standard daily SMAs plotted on intraday charts are evaluated at the daily timeframe and therefore do not form a continuous intraday history. When charts are refreshed or reloaded, these values may appear flat until realtime data resumes.
This script addresses that visualization limitation by projecting the daily SMA across historical and realtime intraday bars, while keeping the daily SMA reference intact.
How it works
• Daily SMA seed values are sourced exclusively from an RTH-only daily timeframe series.
• At ETH midnight, the SMA seed is locked using completed daily closes from the RTH daily series.
• At the RTH open, the seed is re-locked using the completed RTH daily window.
• After each seed event, the SMA is projected intraday using the active chart bar’s price.
Price semantics
• Historical bars use fully closed candle data only.
• The realtime bar uses the last traded price until the candle closes.
• Once a bar closes, its value is final and does not repaint.
Higher-timeframe data usage
• request.security() is used intentionally to access daily SMA data.
• lookahead=barmerge.lookahead_on is used only to reference the developing daily timeframe value during the active session for projection purposes.
• No future bars are accessed and no historical values are retroactively altered.
Data integrity
• SMA seed values are derived solely from the daily timeframe and do not depend on intraday bar history.
• SMA values are computed forward from the locked seed and do not revise prior bars.
• If insufficient daily history exists for a symbol, values safely return na.
Scope and limitations
• Intended for chart timeframes up to and including daily.
• Designed for instruments with defined RTH sessions (such as equities and equity-based products).
• This script does not replace or modify the underlying daily SMA reference; it visualizes an intraday projection anchored to the RTH daily SMA.
Other notes
• Pine Script version: v6
• No future data access
• No historical repainting; only the active realtime bar updates until close Indicador

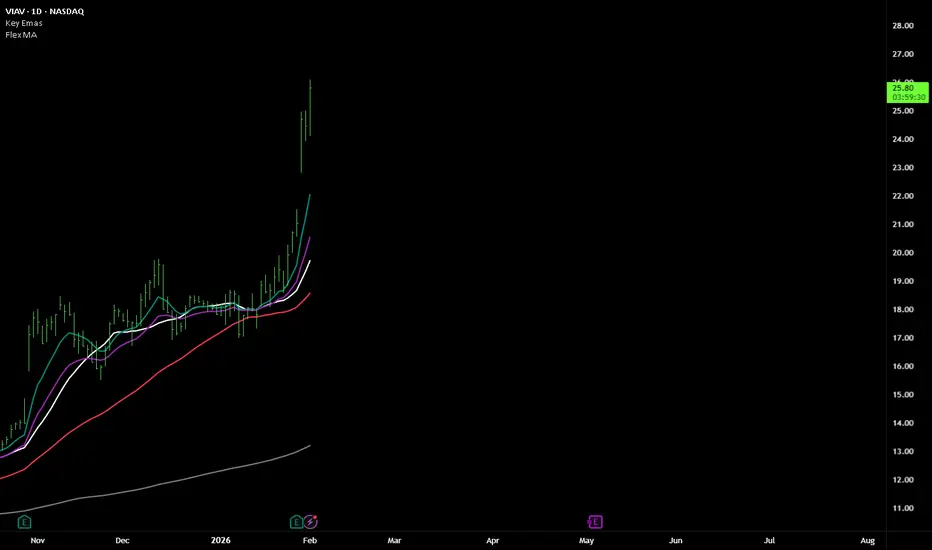
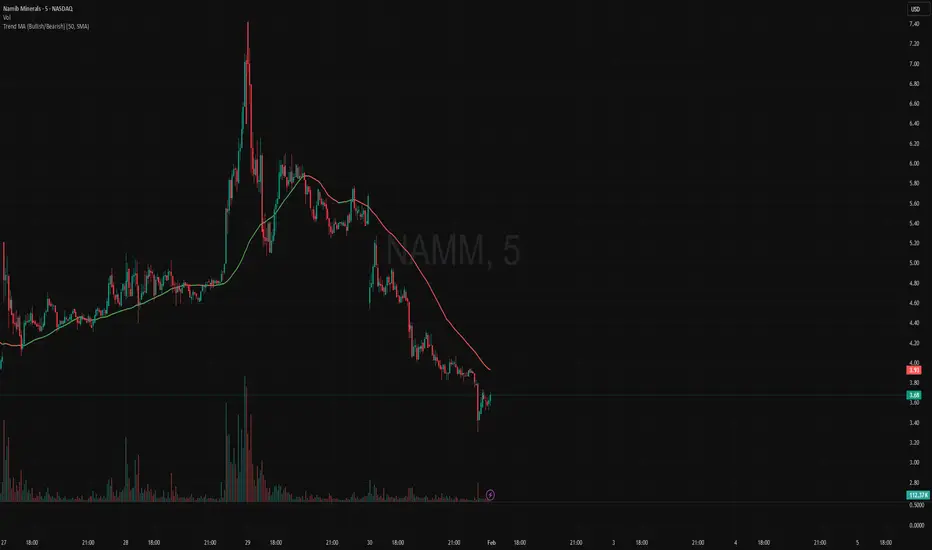
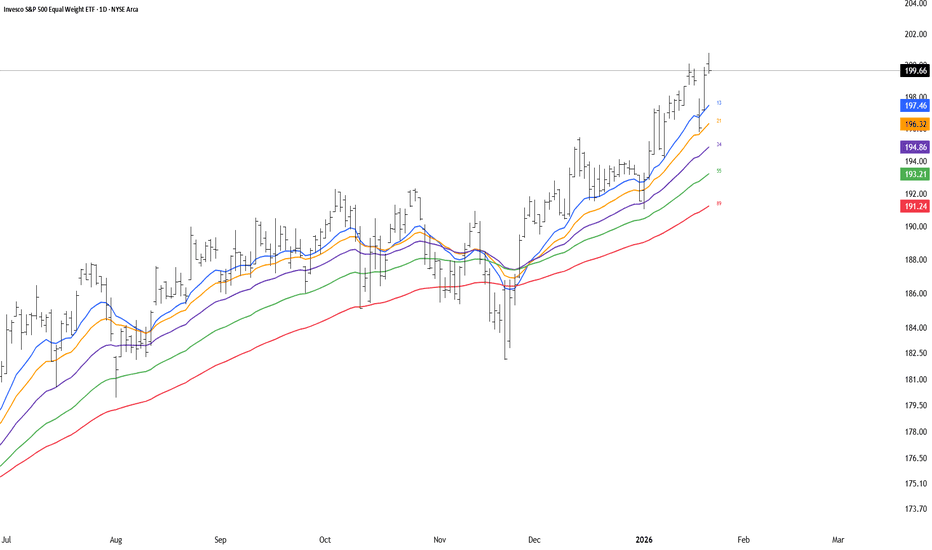
6 Moving Averages (SMA, WMA, EMA etc.)6 Moving Averages is a simple and flexible overlay indicator that lets you plot up to six moving averages on the price chart. Each moving average can be customized by type (SMA, EMA, WMA, etc.), length, color, and visibility, making it ideal for trend analysis, dynamic support and resistance, and moving-average confluence across any market or timeframe. Indicador