SmartFlow Kill ZoneSmartFlow Kill Zone highlights the three major trading sessions (Tokyo, London, New York) and their corresponding ICT Kill Zones directly on your chart. Designed for intraday traders who use session-based and Smart Money Concepts (SMC) strategies, this indicator gives you instant visual clarity on when high-probability trading windows are active.
█ WHAT IT DOES
This indicator identifies and displays the three global forex sessions and three ICT Kill Zones using distinct background colors. It also tracks the High and Low of each session in real time and draws horizontal reference lines that update as the session progresses.
A built-in dashboard provides a quick overview of which sessions and Kill Zones are currently active, along with each session's range in pips.
█ HOW IT WORKS
Session and Kill Zone detection is based on time-of-day logic using the user-selected timezone (default: America/New_York):
Sessions:
- Tokyo: 19:00 – 04:00 ET
- London: 03:00 – 12:00 ET
- New York: 08:00 – 17:00 ET
Kill Zones (ICT):
- London Kill Zone: 02:00 – 05:00 ET
- New York Kill Zone: 07:00 – 10:00 ET
- Asian Kill Zone: 20:00 – 00:00 ET (off by default)
Session High/Low lines are drawn from the session's opening bar and updated on every new bar during the session. When a session closes, lines optionally extend to the right until the next session of the same type begins. Previous sessions' High/Low lines are preserved across multiple days (configurable via "Days to Display").
The dashboard table uses the last bar's data to show open/closed status, the session's current range, and whether any Kill Zone is active.
█ HOW TO USE
- Apply the indicator to any intraday chart (1m to 1h recommended).
- Use the background shading to quickly identify which session you are trading in.
- The brighter Kill Zone overlay tells you when the highest-probability reversal windows are active — this is where ICT traders look for optimal trade entries.
- Session High/Low lines act as key reference levels. Price often reacts at these levels as they represent session-based liquidity.
- The dashboard gives you a heads-up display so you never miss a Kill Zone activation.
█ FEATURES
- Three session backgrounds with independent on/off toggles
- Three ICT Kill Zone backgrounds with independent on/off toggles
- Real-time Session High/Low tracking with configurable line style and width
- High/Low labels that update live during the session
- "Extend Lines Right" option for lines to project forward until the next session
- Multi-day history (up to 30 days of past session H/L lines)
- Dashboard with session status, range (pips), and Kill Zone status
- Dashboard position and size are fully customizable
- 9 alert conditions (session open/close and Kill Zone activation)
- Full timezone support (10 major timezones)
- Works on any symbol and any intraday timeframe
█ SETTINGS
Sessions — Toggle visibility for Tokyo, London, and New York sessions.
Kill Zones — Toggle each ICT Kill Zone independently. Asian KZ is off by default.
Colors — Customize background colors for each session and Kill Zone.
Session High/Low — Toggle H/L lines and labels, set line width, style, and right extension.
Dashboard — Toggle, reposition, and resize the info panel.
Timezone — Select the timezone used for session calculations.
History — Set how many days of past session H/L lines to display (1–30).
█ NOTES
- This indicator does not generate buy or sell signals. It provides session structure and timing context to support your own trading strategy and decision-making.
- Kill Zone times are based on the ICT (Inner Circle Trader) framework. Different educators may define slightly different windows.
- For best results, use on timeframes of 1 hour or lower where session boundaries are clearly visible. Indicador

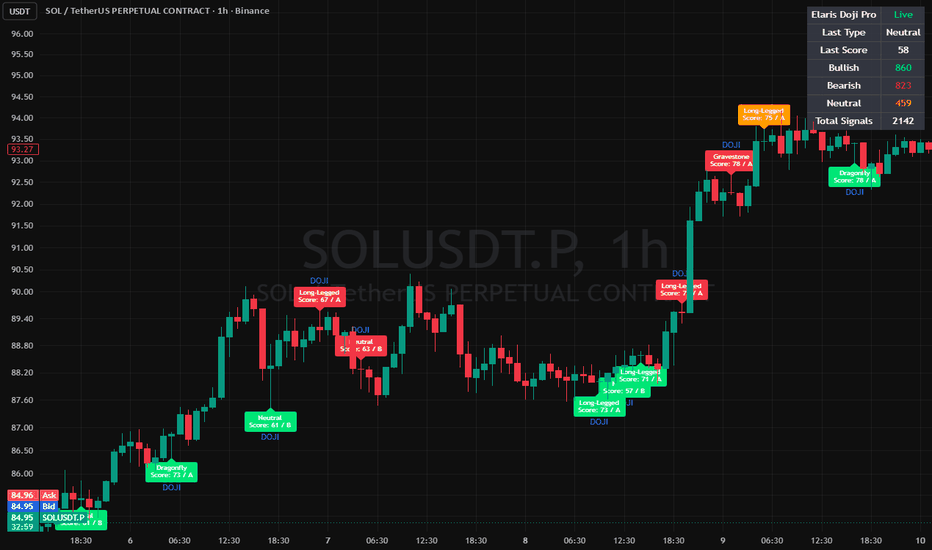
Elaris Doji Finder ProElaris Doji Finder Pro is a professional-grade candlestick analysis indicator designed to detect high-quality Doji formations with advanced context filtering, signal scoring, and clean visual confirmations.
Unlike basic Doji detectors that simply highlight small candle bodies, this indicator evaluates market structure, volatility, wick behavior, trend context, and optional volume confirmation to help traders identify stronger indecision and potential reversal zones.
The indicator supports multiple Doji types including Neutral Doji, Long-Legged Doji, Dragonfly Doji, and Gravestone Doji while providing a premium TradingView experience with customizable visuals, signal quality scoring, smart dashboards, and non-repainting confirmed signals.
━━━━━━━━━━━━━━━━━━
FEATURES
━━━━━━━━━━━━━━━━━━
• Detects multiple Doji candle types
• Advanced candle body and wick analysis
• ATR-based volatility filtering
• EMA trend context filtering
• Volume confirmation system
• Swing support & resistance proximity filter
• Bullish / bearish contextual bias detection
• Signal quality scoring engine
• Professional dashboard interface
• Dark mode and light mode support
• Clean labels and compact signal markers
• Fully customizable settings
• Optimized for crypto, forex, indices, and stocks
• Non-repainting candle-close confirmation mode
• Built-in alert conditions
━━━━━━━━━━━━━━━━━━
SUPPORTED DOJI TYPES
━━━━━━━━━━━━━━━━━━
• Neutral Doji
Classic indecision candle with a very small body.
• Long-Legged Doji
High-volatility indecision candle with extended upper and lower wicks.
• Dragonfly Doji
Bullish rejection-style Doji often appearing near local lows or support zones.
• Gravestone Doji
Bearish rejection-style Doji often appearing near local highs or resistance zones.
━━━━━━━━━━━━━━━━━━
HOW TO USE
━━━━━━━━━━━━━━━━━━
Bullish Doji signals may become more effective when:
• Appearing near support
• Forming after strong sell pressure
• Confirmed by rising volume
• Appearing against an extended downtrend
Bearish Doji signals may become more effective when:
• Appearing near resistance
• Forming after strong buying pressure
• Confirmed by elevated volume
• Appearing after aggressive trend extensions
The signal quality score can help filter weaker setups and focus on higher-probability Doji structures.
━━━━━━━━━━━━━━━━━━
NON-REPAINTING
━━━━━━━━━━━━━━━━━━
This indicator can operate in non-repainting mode when “Confirm Signals On Candle Close” is enabled. Signals are confirmed only after candle close.
━━━━━━━━━━━━━━━━━━
DISCLAIMER
━━━━━━━━━━━━━━━━━━
This indicator is designed for educational and analytical purposes only. Always use proper risk management and combine candlestick signals with broader market context before making trading decisions.
Indicador
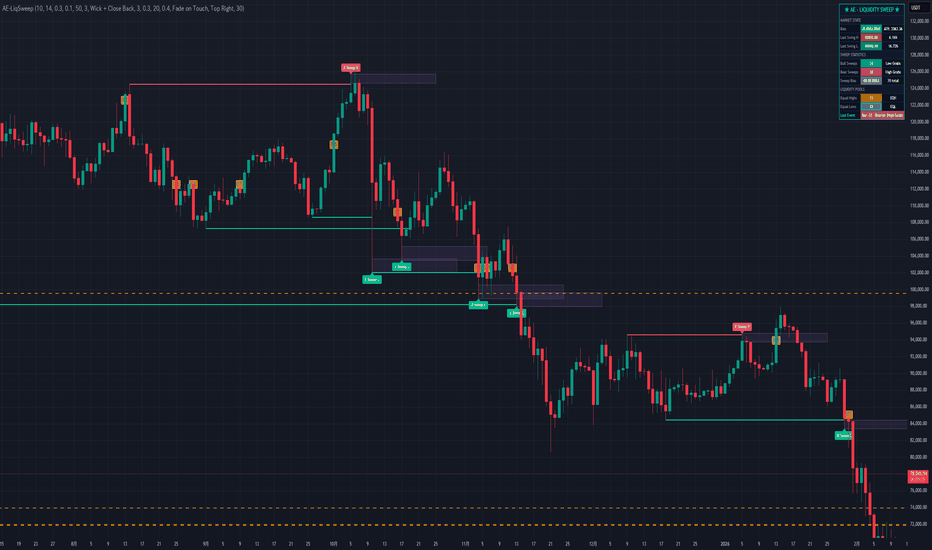
AetherEdge - Liquidity Sweep & Raid Detector🖊️ Overview
AetherEdge Liquidity Sweep & Raid Detector is a professional-grade smart money analysis tool that exposes institutional stop hunts (liquidity raids) and Equal Highs/Lows liquidity pools in real time. By integrating ATR-based significance filters, three-tier sweep confirmation modes, and projected stop hunt zones, it visualizes "who, where, and why" liquidity is being taken—enabling traders to follow institutional footprints with both reversal and continuation entries.
🔶 Key Features
ATR-Adaptive Pivot Detection: Extracts only meaningful swings
Equal Highs/Lows Detection: Auto-marks liquidity pools
3 Sweep Confirmation Modes: Wick Only / Close Back / Wick + Close Back
Stop Hunt Zone Projection: Boxes mark institutional revisit zones
3 Zone Management Modes: Keep / Fade on Touch / Remove on Touch
Reversal Candle Requirement: Filters false sweeps
Break of Structure (BOS): Auto-detects structural shifts
ATR Wick Size Filter: Eliminates shallow sweeps
Pending Sweep System: Configurable max-bars window for close-back confirmation
Statistics Dashboard: Bull/Bear sweep counts, EQH/EQL, active hot zones
🧠 Technical Architecture
This indicator implements core ICT/SMC concepts via pivot array management and a pending state machine to deliver a professional liquidity-tracking engine.
Significance Pivot Layer:
ta.pivothigh/low for confirmed swing detection
ATR × multiplier filters out "noise swings"
Arrays manage 50 historical pivots (price, bar, swept flag)
Equal Highs/Lows Detection:
Scans pivots within eqLookback
|currentPivot - prevPivot| ≤ ATR × tolerance for equality
Draws horizontal line at midpoint with optional right-extension
Sweep Detection Engine:
Wick Only: Wick breaks pivot + immediate inside close + reversal confirmation
Close Back: Wick breaks, then close returns inside within sweepMaxBars
Wick + Close Back: Both conditions met (highest precision)
Pending arrays handle multi-stage confirmation asynchronously
Stop Hunt Zones:
Box generated at sweep point with zoneHeightATR height
Extended zoneExtend bars right
Lifecycle managed via Fade / Remove / Keep on touch
BOS Detection: Unswept pivot's close-break marks structural shift
Memory Management: maxObjects FIFO-prunes all lines/labels/boxes
⚙️ Recommended Settings & Tuning Guide
Crypto Defaults:
BTC (15M–1H): pivLen=10, atrMinMult=0.3, sweepMode=Wick + Close Back (standard)
ETH (5M–15M): pivLen=8, sweepMaxBars=4 for faster confirmation
SOL (high-vol): atrMinMult=0.5, sweepMinWick=0.4 for stricter filter
XRP (range): eqTolerance=0.15 to relax equality detection
Sweep Mode Selection:
Wick Only: High frequency, day trading / scalping
Close Back: Medium frequency, most balanced
Wick + Close Back: Highest precision, swing trading (recommended)
Zone Management:
Fade on Touch: Preserves history, tracks revisits (recommended)
Remove on Touch: Cleaner charts
Keep: Full retention, long-term analysis
Tuning:
Too many signals: atrMinMult=0.5, sweepMinWick=0.5
Too few signals: requireReverse=false, sweepMaxBars=5
Better EQ accuracy: eqMinDistance=5 to suppress clusters
💡 How to Use in Practice
Bullish Sweep (Low Grab) → Long: Buy the bounce after institutions raid downside stops
Bearish Sweep (High Grab) → Short: Sell after upside stop hunt
EQH/EQL → Liquidity Targets: Price likely magnetizes here
Stop Hunt Zone Revisit: Once-swept zones often retest
BOS + Sweep Combined: Strongest structural shift confirmation
AetherEdge Synergy:
WaveTrend Enhanced OS Extreme + Bullish Sweep = max-conviction bottom
Self-Evolving S/R Grid strong support + Low Grab = institutional-sync entry
SuperTrend Multi-Factor Bull flip + BOS Up = trend ignition capture
Multi-TF Strategy: 1H EQH for liquidity map → 15M sweep for entry → 5M for precision timing
⚠️ Important Notes
Pivot Lag: pivLen-bar delay inherent (no real-time detection)
ATR Filter Dependency: Sweep detection drops in low-volatility regimes
Close Back Pending: Auto-cancels after sweepMaxBars—watch for missed signals
EQ Over-detection: Large eqLookback may match outdated pivots
Zone Revisit: Probabilistic, not guaranteed
Sweeps in Strong Trends: Can be confused with breakouts—context confirmation required
🚨 Disclaimer
This indicator is a technical analysis tool provided for educational and research purposes only and does not constitute financial advice. Liquidity sweeps and stop hunt zones represent probabilistic market behavior patterns and do not guarantee profits. All trading decisions are made at your own risk and should be accompanied by proper risk management. Indicador
AetherEdge KNN Breakout Fortress🖊️ Overview
AetherEdge KNN Breakout Fortress is a revolutionary fortress-style indicator that automatically detects price congestion zones (walls) via K-Means clustering and uses a KNN classifier to distinguish "real breakouts" from "fake breakouts" in real time. Every breakout becomes labeled training data after a confirmation window, allowing the system to evolve and adapt to your specific market's wall patterns. End the era of being trapped by fake-outs — this is the next-generation tool built exclusively for breakout strategy.
🔶 Key Features
K-Means Zone Detection: Lloyd's algorithm auto-clusters key price levels
Volume-Weighted Seeding: Volume-weighted price-point clustering
7D KNN Classifier: Density, distance, volatility, RSI, BB-width, age, touches
Real vs Fake Classification: Probability-based wall strength color coding
Pending Learning: Labels assigned N bars after break, then memory updates
Volume Confirmation: Breakouts validated only above volMult threshold
ATR Buffer: Filters out noise-level breaks
Dynamic Zone Extension: Post-break zone projection
Stats Dashboard: Real/fake counts visualization
🧠 Technical Architecture
This indicator is an AI-driven decision system designed to "see through the true nature of every wall."
K-Means Zone Detection: Collects high/low/close price points within lookback, applies volume weighting, then iterates Lloyd's algorithm (kIters passes) to optimize kClusters centroids. Only clusters above minDensity become zones.
Quantile Seeding: Initial centroids placed via quantiles for deterministic, well-spread initialization (more stable than random).
Zone Construction: Each centroid is bounded by ±zoneWidth × ATR and rendered as a box. Resistance/support classification dynamically based on relative position to current price.
7D Feature Extraction: ①Normalized density, ②distance from price (ATR units), ③volatility regime, ④RSI at formation, ⑤BB width, ⑥age, ⑦approach count.
KNN Fortress Classifier: Stores up to maxMemory labeled past samples ("held = 1.0" / "broken = 0.0"). New zones queried via Top-K neighbor search to compute probability scores.
Pending Learning: At break events, features and direction stored in pending arrays. After confirmBars, real outcomes (rejected or continued) determine the label, then added to memory.
Real vs Fake Threshold: Score ≥ realThresh = strong wall (green); ≤ fakeThresh = weak wall (orange); middle = neutral (gray).
Break Detection: Validated when price exceeds breakBuf × ATR with volume above volMult, triggering zone extension display.
⚙️ Recommended Settings & Tuning Guide
Crypto Defaults:
BTC (4H): lookback=150, kClusters=6, refreshN=15, realThresh=0.60
ETH (1H): lookback=120, kClusters=5, refreshN=10, fakeThresh=0.40
SOL/XRP (15M): lookback=100, kClusters=5, refreshN=8, breakBuf=0.15
Long-Term (1D): lookback=300, kClusters=8, refreshN=20, minDensity=6
Parameter Tuning:
Too many zones: Reduce kClusters to 4, raise minDensity to 6
Too few zones: Expand lookback to 200, lower minDensity to 3
Choppy markets: Raise fakeThresh to 0.45 and breakBuf to 0.20
Strong trends: Lower realThresh to 0.50 for early genuine break capture
Faster learning: Shorten confirmBars to 3 (higher mislabel risk)
Conservative learning: Set confirmBars=10 for high-confidence labels only
💡 How to Use in Practice
Strong Wall Reversal: Counter-trade tags on green strong walls
True Breakout Follow: Break of a strong wall = high-conviction trend start
Weak Wall Trap Avoidance: Skip breaks on orange walls, prepare reversal entries
Double Wall Strategy: Consecutive strong walls form a fortress S/R cluster
Multi-Timeframe: Use 1D strong walls as precision entry zones on 1H
AetherEdge Combinations: Overlap with AI Trendline Architect's top-scored lines = elite zone
⚠️ Important Notes
KNN memory requires 30–50 initial samples for reliable scores
Memory and stats reset on indicator reload
Too-small refreshN causes flickering zone updates
Flash crashes or gaps can distort density measurements
K-Means operates on 1D price space — extreme outliers may bias clustering
🚨 Disclaimer
This indicator is provided for educational and research purposes only and does not constitute financial advice. AI classifications and probability scores are based on historical data and do not guarantee future performance. All trading decisions are made at your own risk and should be accompanied by proper risk management.
Indicador

AetherEdge AI Dynamic Trendline Architect🖊️ Overview
AetherEdge AI Dynamic Trendline Architect is a next-generation automatic trendline system powered by a four-layer AI architecture: pivot detection, KNN pattern memory, a neural quality network, and structural prior validation. Every candidate line is evaluated through machine learning, ensuring that only truly meaningful, high-quality lines are drawn and lifecycle-managed — delivering accuracy and practicality unreachable by conventional approaches.
🔶 Key Features
Pivot Engine: High-precision swing high/low detection with dynamic candidate pairing
5D Feature Extraction: Slope, duration, volatility ratio, RSI state, angle
KNN Pattern Memory: Stores up to 300 historical line patterns
Neural Quality Network: Online learning updates quality scores in real time
Structural Prior: Physical validation via touch counts and violations
Dynamic Hybrid Fusion: Mixes NN predictions with structural prior
Line Lifecycle Management: TTL, break detection, minimum score threshold
Break Detection: ATR-buffered to suppress false signals
Premium Visuals: Age fading, strength labels, support/resistance color coding
🧠 Technical Architecture
This indicator is a multi-layer decision system centered on AI-based line quality evaluation.
Pivot Engine: Detects swings via ta.pivothigh/low, maintaining up to 25 pivots per side. From each new pivot, candidate pairs are generated by scanning back scanBack pivots.
Feature Engineering: ①ATR-normalized slope, ②normalized duration, ③ATR-ratio volatility, ④RSI deviation, ⑤atan-based angle — all standardized to or .
KNN Pattern Memory: Up to maxMemory historical patterns with outcome labels. Each candidate undergoes Euclidean distance comparison in the 5D feature space; Top-K neighbors are weighted by inverse distance to produce a consensus score.
Neural Quality Network: An online neural net learns to predict line quality, updated via real outcomes (breaks, bounces) over nnEpochs.
Structural Prior: Physically verifies the line by counting actual touches and violations along its projection, computing touchScore + durationQuality − violationPenalty.
Hybrid Score Fusion: priorMix dynamically blends NN prediction with structural prior — only lines with consensus from both layers reach top-tier scoring.
Line Lifecycle: Only lines above minScore are drawn; ttlBars triggers auto-expiry; breaks exceeding breakBuf × ATR change color and are recorded.
⚙️ Recommended Settings & Tuning Guide
Crypto Defaults:
BTC/ETH (4H–1D): pivLen=5, maxLines=6, ttlBars=80, minScore=0.55
SOL/XRP (1H): pivLen=4, maxLines=8, ttlBars=60, minScore=0.50
Scalping (5M–15M): pivLen=3, maxLines=4, ttlBars=40, knnK=3
Long Swing (1D): pivLen=8, maxLines=10, ttlBars=200, minScore=0.65
Parameter Tuning:
Too many lines: Raise minScore to 0.65–0.75 to display only premium lines
Too few lines: Increase scanBack to 6 and lower minScore to 0.45
Choppy markets: Raise breakBuf to 0.30 to avoid fake breaks
Quiet ranges: Set priorMix=0.6 for structure-favored detection
Trending markets: Set priorMix=0.3 to leverage NN learning
💡 How to Use in Practice
High-Score Line Reversal: Long at score ≥ 0.70 supports, short at resistances
Breakout Strategy: Color shifts (colBkU/colBkD) signal trend-following entries
S/R Flip: Capture the moment a broken resistance flips to support
Multi-Timeframe: Use 1D strong lines as zones for 1H precision entries
AetherEdge Combinations: Hybrid AI Bias bullish + high-score support bounce = elite long setup
⚠️ Important Notes
NN weights start from defaults; memory requires 50–100 events to mature
KNN memory and NN weights reset on indicator reload
Too-small pivLen creates noise; too-large delays detection
Excessive maxLines clutters the chart
Extreme gaps or flash crashes may trigger false break detection
🚨 Disclaimer
This indicator is provided for educational and research purposes only and does not constitute financial advice. AI predictions and line quality scores are based on historical data and do not guarantee future performance. All trading decisions are made at your own risk and should be accompanied by proper risk management.
Indicador

Indicador
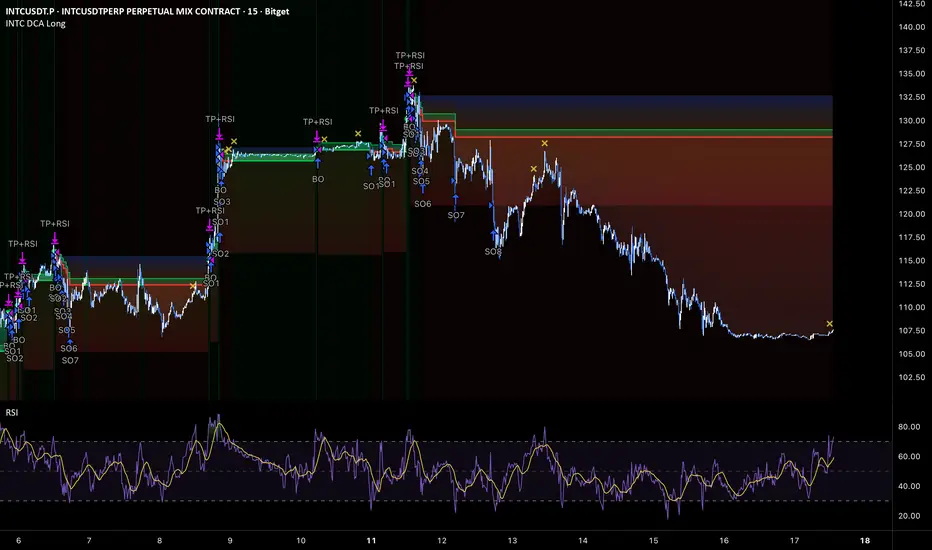
[3Commas] Silicon Vault Long - INTC DCA Strategy Silicon Vault Long — INTC DCA Strategy
🔷 What it does:
This strategy executes a long-only Dollar-Cost-Averaging approach on tokenized Intel (INTCUSDT) perpetuals, using an RSI-based exit gate to capture momentum-confirmed take-profits on overbought rebounds. It opens base orders continuously when no active deal exists, layers a structured 8-level safety order ladder during price drawdowns, and exits only when RSI crosses above the overbought threshold AND the position has accumulated the minimum profit target from the average entry. Calibrated for the volatility profile of tokenized semiconductor stocks, where structural bullish drift in mega-cap tech combines with intraday volatility unique to perpetual contracts on equity tokens.
- Base Order entry: nonstop — opens immediately when no active deal exists
- Safety Order ladder: 8 levels with cumulative deviation (step coef 1.22), all SOs equal size
- Exit: RSI(14) on 15m crosses above 70 AND profit ≥ 0.6% from average entry (dual-gate close)
- 2× leverage (isolated), no stop loss
🔷 Who is it for:
Traders looking to apply DCA logic to tokenized semiconductor / tech equity perpetuals.
Bot operators who automate execution through webhook integration with a DCA Bot.
Traders seeking exposure to mainstream tech stocks through perpetual contracts during structural bull phases.
Discretionary traders who want a signal framework with momentum-confirmed exits rather than fixed-percentage closes.
🔷 How does it work:
Long Entry: A base order opens whenever no active deal exists and the bar is confirmed within the configured window. There is no signal-based entry filter — the strategy reloads continuously, treating each new deal as a fresh DCA cycle. This is appropriate for instruments with sustained upward bias, as Intel's tokenized perpetual demonstrates during the reference period.
Short Entry: Not used — strategy is long-only by design.
Exit Management: The full position closes when two conditions align simultaneously — RSI(14, 15m) crosses above 70 (momentum-confirmed overbought signal) AND unrealized profit from average entry reaches the minimum threshold (default 0.6%). The dual gate prevents premature exits during shallow rebounds and prevents structural exits when profit is below threshold. The strategy carries no stop loss; invalidation is replaced by the depth of the safety order ladder (cumulative −8.88% from base across 8 levels) plus the underlying bullish drift assumption for tokenized equities.
🔷 Why it's unique:
Dual-gate exit logic — most DCA strategies use either a fixed-percentage TP or a signal-only exit. This combines them: the RSI signal acts as a momentum-confirmed exit trigger, but only fires when the position is also profitable above the minimum threshold. This filters out RSI-triggered exits that would close deep-averaged positions at a loss, ensuring every signaled close is both timing-confirmed and economically rational.
Semiconductor sector focus — calibrated for tokenized semiconductor stocks (Intel, AMD, NVDA proxies) where chip-cycle volatility creates the kind of intraday range that DCA bots monetize through structured averaging. Intel's specific volatility profile of 2025–2026 produced an ideal regime for this framework.
Bot Integration — entry and exit alerts ship with webhook-ready JSON payloads. Bot ID, Email Token, and pair label are exposed as inputs and automatically embedded into the alert message format.
🔷 Considerations Before Using the Indicator:
Market & Timeframe: Designed for a 15-minute chart on tokenized equity perpetuals with active intraday range. Best suited to mega-cap tech instruments with sustained bullish drift and regular pullback structure (Intel, AMD, MSFT, GOOGL, NVDA proxies). Less suited for sustained downtrends or instruments without structural upside bias — tokenized stocks have an embedded long-term upward expectation that crypto-native pairs do not always share.
Limitations: The strategy carries no stop loss. In sustained downtrends extending beyond the deepest safety order (−8.88% from base), the position holds unrealized loss until either the average is recovered through subsequent bounces or the deal is manually closed. The structural assumption is that the underlying tokenized equity will mean-revert upward over time due to its embedded bullish drift. If this assumption breaks (e.g., during a sustained semiconductor sector bear cycle), the strategy is materially exposed.
Backtesting & Demo Testing: The reference results were generated on Bitget USDT-M Perpetual Futures for INTCUSDT during a strong bullish phase for Intel stock (Jan 2025 — Mar 2026, 437 days). Performance during different equity market regimes (chip cycle downturns, broad tech corrections, rangebound periods) may differ significantly. Always validate on extended history and re-test across multiple instruments before deploying real capital. Demo-trade for at least one month before live deployment. Past performance is not indicative of future results.
Parameter Adjustments: Commission defaults to 0.06% (Bitget USDT-M taker). Adjust for your venue. Leverage is set to 2× isolated — increase or decrease per your risk tolerance. RSI threshold (70) and the minimum profit gate (0.6%) should be tuned per instrument volatility — tighter thresholds for lower-volatility tokenized stocks, wider for high-beta semiconductor tickers. SO step (0.5%) and step coefficient (1.22) define ladder depth; widen the step for instruments with bigger intraday swings.
🔷 STRATEGY PROPERTIES
Symbol: BITGET:INTCUSDT.P (Intel Corp tokenized perpetual on Bitget). Strategy is generic — works on any tokenized equity perpetual.
Timeframe: 15m chart.
Test Period: Jan 2025 — May 17, 2026.
Initial Capital: 500 USDT.
Order Size per Trade: Base Order 11.25 USDT, Safety Orders 7.5 USDT each (×8 = 60 USDT). Maximum cumulative position notional ≈ 71.25 USDT per deal. With 2× isolated leverage, margin requirement ≈ 35.6 USDT.
Commission: 0.06% taker (Bitget USDT-M Perpetual reference). Adjust per venue.
Slippage: 2 ticks — typical taker execution on liquid perpetuals.
Margin for Long and Short Positions: 50% (2× isolated leverage).
Indicator Settings: Default Configuration.
Base Order Volume: 11.25 USDT
Safety Order Volume: 7.5 USDT
Max Safety Orders: 8
Price Step (1st SO): 0.5%
Step Coefficient: 1.22
Volume Coefficient: 1.0
RSI Length: 14
RSI Threshold: 70
RSI Timeframe: 15m
Min Profit: 0.6% from average entry
Strategy: Long Only.
🔷 STRATEGY RESULTS
⚠️ Remember, past results do not guarantee future performance.
Net Profit: +55.96 USDT (+11.19%)
Max Drawdown: 16.75 USDT (3.13%)
Total Closed Trades: 320
Percent Profitable: 88.75% (284 / 320)
Profit Factor: 23.701
Reference TradingView Pine backtest on BITGET:INTCUSDT.P (15m chart) for the available history window Jan 1 2025 — May 17 2026 (252 days). The exceptional win rate (88.75%) and Profit Factor (23.701) reflect the structurally bullish phase for Intel stock during the test window combined with the strategy's deep safety order ladder that absorbs intraday pullbacks. These metrics are regime-dependent and not expected to persist through semiconductor sector downturns or sustained bear cycles. Re-test on your own venue with venue-specific commission before live deployment.
🔷 How to Use It:
🔸 Adjust Settings: Set Base Order and Safety Order volumes proportional to your account size and risk tolerance. The default 11.25 / 7.5-USDT structure is calibrated for a 500-USDT test account with 2× leverage; scale linearly to your equity. RSI threshold can be tightened to 65 for more frequent exits or widened to 75 for fewer, larger captures. The SO step should be widened on instruments with higher intraday volatility.
🔸 Results Review: Verify Maximum Drawdown stays within your personal risk budget. The strategy is configured for a conservative per-deal risk envelope (max position 71.25 USDT, full ladder coverage at −8.88% from base), but extended history may shift this profile. Re-test on your own venue using venue-specific commission and slippage. The strategy's performance on the tested window is regime-dependent — performance during semiconductor sector downturns has not been validated. Demo-trade for at least one month before any live deployment.
🔸 Create alerts to trigger the DCA Bot: Two alert messages are exposed by the strategy — "Deal Start" fires on each new base order, and "Deal Close" fires when the dual-gate exit triggers. Configure both alerts in TradingView with the webhook URL pointing to your DCA Bot's signal endpoint. Once configured, the strategy publishes the signal and the bot handles execution on the exchange autonomously.
🔷 INDICATOR SETTINGS
Base Order Volume (USDT) — Notional value of the initial entry per cycle.
Safety Order Volume (USDT) — Notional value of each averaging-down order; all SOs equal size by default.
Max Safety Orders — Total number of averaging steps available per deal.
Price Step % (1st SO from base) — Percentage deviation from base price for the first safety order.
Martingale Step Coefficient — Multiplier applied to each successive deviation step.
Martingale Volume Coefficient — Size multiplier applied to each successive safety order (default 1.0 = all equal).
Require RSI cross-above for close — Toggle the dual-gate exit; off makes it pure %-profit close.
RSI Length / Threshold / Timeframe — Parameters for the exit RSI signal.
Min Profit % (from avg entry) — Minimum unrealized profit threshold required for the exit gate.
Limit by Date Range — Constrain backtest to a specific date window.
Stats card / Watermark — Display layer controls for on-chart backtest summary and branding.
Webhook — Bot ID, Email Token, and Pair label for DCA Bot signal routing.
👨🏻💻💭 We hope this tool helps enhance your trading. Your feedback is invaluable, so feel free to share any suggestions for improvements or new features you'd like to see implemented.
__
The information and publications within the 3Commas TradingView account are not meant to be and do not constitute financial, investment, trading, or other types of advice or recommendations supplied or endorsed by 3Commas and any of the parties acting on behalf of 3Commas, including its employees, contractors, ambassadors, etc. Estratégia

Indicador
Indicador
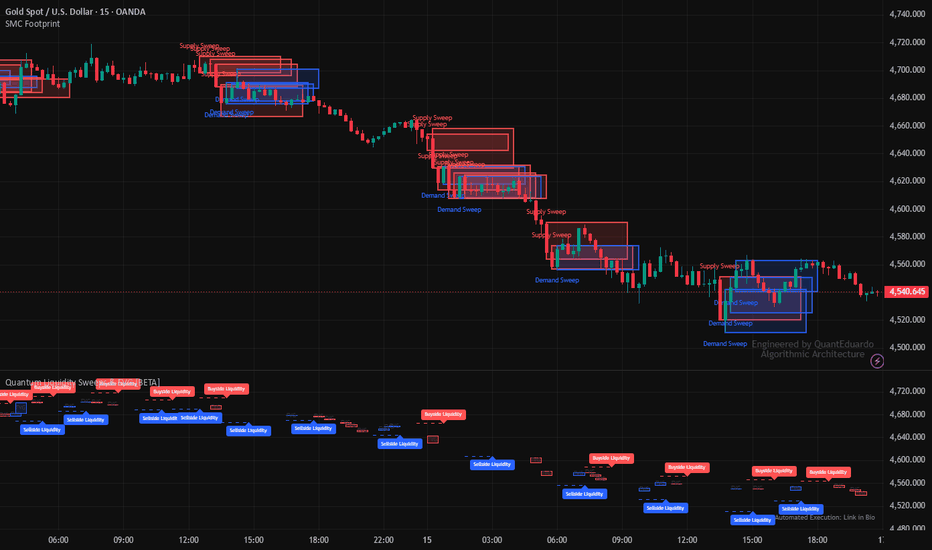
Indicador

Indicador

RBD Confluence ZonesConfluence Zones highlights areas on the chart where multiple key support/resistance levels stack within a tight range — places where multiple timeframes "agree." These zones tend to act as stronger S/R than any single level alone.
How it works
Each bar the indicator calculates a set of important price levels and groups any that fall within a user-defined proximity threshold (ATR-based by default). Groups of 2 or more levels are drawn as colored zones:
- Cyan = 2 levels (light confluence)
- Magenta = 3 levels (medium confluence)
- Yellow = 4+ levels (strong confluence, rare)
Levels included (each toggleable)
- Weekly Pivot Points: P, R1, R2, S1, S2 (+ optional R3/S3)
- Monthly Pivot Points: P, R1, R2, S1, S2 (+ optional R3/S3)
- Previous Week High / Low
- Previous Month High / Low
- Previous Day High / Low
- Previous Weekly Market Profile VAH / VAL (TPO method, 20 bins, 70% VA)
Key inputs
- Proximity Mode: ATR / Percent of Price / Ticks
- ATR Multiplier (default 0.5): how close levels must be to cluster
- Min Levels per Zone (default 2)
- Value Area % for the Weekly Market Profile (default 70%)
- Border width, label size, colors, lookback all customizable
Reading the chart
- Plain dotted lines: individual levels that did not cluster
- Colored boxes: confluence zones, labeled with what is inside (e.g. "PMH + WVAL + MR1 x3")
- The "xN" count tells you how many levels formed the zone — higher = higher-probability reaction area
Tips
- Default ATR threshold (0.5) works well across most assets/timeframes
- Increase the multiplier for wider clusters, decrease for tighter
- Match the label content to your bias: heavier-timeframe levels (monthly, prev H/L) carry more weight than weekly pivots alone
Credits
The Weekly Market Profile (VAH/VAL) TPO logic is derived from the RBD Market Profile indicator — 20-bin TPO, expanding from POC to cover the chosen Value Area percentage. Standard pivot formulas are Classic Floor.
Indicador

ORB + FVG Long Only🎯 TL;DR
Opening Range Breakout for NQ futures, long-only. Marks the first 15
minutes after NY open, then signals a BUY when price breaks above that
range during the morning Power Hour — but only if 6 smart filters
confirm the conditions are right. Auto-draws your full trade plan
(Entry, Stop, TP1, TP2) the moment a signal fires.
━━━━━━━━━━━━━━━━━━━━━━━━━━━━━━━━━━━━━━━━━━━━━━━━━━━━━━━━
🟢 SUPER SIMPLE — How To Use This
1. Watch your chart during 9:30–11:00 AM EST.
2. Wait for a GREEN TRIANGLE 🔺 with a "🚀 BUY 🚀" label.
3. When you see it:
• BUY at the black line (Entry)
• Stop loss at the RED line
• Take Profit 1 at the GREEN line
• Take Profit 2 at the LIME line
4. Walk away. The lines are drawn for you.
No triangle = no trade. The indicator checks everything for you —
you just execute what it draws.
━━━━━━━━━━━━━━━━━━━━━━━━━━━━━━━━━━━━━━━━━━━━━━━━━━━━━━━━
📊 OPENING RANGE BREAKOUT + FAIR VALUE GAPS
Long-Only · Built for NQ/MNQ futures · NY session
🟢 WHAT IT DOES
This indicator combines the classic Opening Range Breakout setup with
ICT Fair Value Gap detection and a stack of smart filters designed to
skip low-quality, choppy days. When a clean bullish breakout fires, it
auto-plots a complete trade plan — Entry, Stop Loss, and two Take
Profit targets — with R-multiples and dollar values, right on your
chart.
📋 HOW IT WORKS
1. Marks the High and Low of the first 15 minutes after NY open
(9:30–9:45 AM EST) — the "Opening Range"
2. Watches for a breakout above the OR High during the morning
Power Hour window (9:30–11:00 AM EST)
3. Confirms the breakout against 6 smart filters
4. Fires a single, clear BUY signal with an alert
5. Auto-draws the trade plan: Entry / SL / TP1 / TP2
🔍 6 SMART FILTERS
✅ Bullish daily bias — price above today's open
✅ 20-EMA uptrend — daily trend confirmation
✅ Trend-day filter — yesterday closed strong
✅ Power Hour window — restricts signals to the highest-quality hours
✅ Loss streak protection — pauses after consecutive weak days
✅ Volume confirmation (optional) — breakout backed by real volume
✅ FVG confluence (optional) — require a fresh bullish Fair Value Gap
📈 AUTO-PLOTTED TRADE PLAN
When a BUY fires, the indicator instantly draws:
• Entry line (black)
• Stop Loss (red) — configurable: OR Low / OR Midpoint / ATR-based
• TP1 (green) — default 2R
• TP2 (lime) — default 4R
• Labels showing prices AND dollar amounts
Lines auto-cap at 4 PM EST so they never bleed into the next day.
🎛️ FAIR VALUE GAPS
• Detects bullish and bearish 3-candle imbalances
• Drawn as clean translucent boxes
• Close-based mitigation — gaps are removed once price closes through
them (stricter, more accurate than wick-touch)
• Optional: require a recent bullish FVG before a BUY can fire
🕐 OPENING RANGE VISUALIZATION
• OR box over the 9:30–9:45 window
• OR High / Low / Midpoint lines extend through the session
• Price labels on the right edge
📊 FILTER STATUS DASHBOARD
A compact panel shows each filter's live status (✓ / ✗) and an
overall READY 🟢 / 🔴 light — so you can see at a glance how close
the setup is to triggering.
📱 ALERTS
Built-in alert fires on every BUY signal — works with TradingView's
push notification system for phone alerts. Custom message includes
ticker, breakout price, and entry.
⚙️ FULLY CONFIGURABLE
• Opening Range window time
• Trade window (Power Hour) time
• Every filter individually toggleable
• R-multiples for TP1 / TP2
• Stop loss placement method
• Line extension length
• Label sizes (tiny → huge)
• Zen Mode — hides all context, shows only the signal + trade plan
🛡️ ANTI-REPAINT
Signals confirm on bar close — what you see is final. No flickering,
no after-the-fact repainting.
⚠️ DISCLAIMER
This indicator is for educational and informational purposes only.
It is not financial advice. Trading futures involves substantial risk
of loss and is not suitable for everyone. Always practice on a demo
account before risking real capital. The author is not responsible
for any trading losses incurred using this tool.
🚀 INITIAL RELEASE — v1.0
Features:
• Opening Range Breakout detection (configurable window)
• 6-filter confluence system for high-quality entries
• Auto-plotted trade plan — Entry / SL / TP1 / TP2 with R-multiples
and dollar values
• Fair Value Gap detection with close-based mitigation
• Optional FVG confluence requirement for entries
• Optional volume confirmation filter
• Filter status dashboard with READY light
• Configurable stop placement (OR Low / OR Midpoint / ATR)
• Lines auto-cap at 4 PM EST — no overflow into the next day
• Anti-repaint — signals confirm on bar close
• Zen Mode for clean, distraction-free execution
• Comma-formatted price labels, adjustable label sizes
• Built-in alerts compatible with mobile push notifications
Notes:
• Long-only by design
• Built and tuned for NQ/MNQ — works on other liquid instruments
• Default trade window is the morning Power Hour (9:30–11:00 EST)
• Always forward-test on a demo account before going live
Indicador

Tri-Vector Flow Predictor Tri-Vector Flow Predictor v3.2 is an adaptive directional trading indicator designed to help traders read the next probable price movement with clean visuals and structured signal logic.
This tool combines trend, volatility, market structure, liquidity sweeps, Fair Value Gap impulses, compression breakouts, volume pressure, regression quality, and multi-timeframe confirmation into one visual decision-support engine.
The goal is not to predict the future with certainty. The goal is to organize multiple important market conditions into one clean framework so traders can better understand when price may continue, reverse, expand, or lose momentum.
What the indicator includes:
* Adaptive fused trend core
* Value cloud around fair price
* Pulse rail for trend and invalidation structure
* Long and short entry signals
* Long and short exit signals
* One-entry / one-exit trade state logic
* Liquidity sweep detection
* Structure break and retest logic
* Fair Value Gap impulse detection
* Multi-timeframe trend agreement
* Regression-based forecast quality
* Next-move prediction cone
* Risk / reward projection with entry, invalidation, TP1, and TP2
* Clean dashboard showing bias, trigger, prediction, regime, scores, MTF stack, and regression quality
How to use it:
Use the LONG and SHORT labels as the main directional signal markers. The signal is not based on one condition only. It requires trigger logic, score confirmation, filtering, and directional dominance.
The EXIT L and EXIT S labels show the internal exit logic for the active virtual trade state. Exits can occur from an opposite signal, invalidation hit, TP2, or confidence loss.
The prediction cone is a probabilistic visual guide. It shows where price may move next based on the current flow vector, volatility, score dominance, trend pressure, MTF context, and regression quality. It should not be treated as a guaranteed target.
The Pulse Rail can be used as an adaptive structure line. When price holds above it, bullish structure is stronger. When price holds below it, bearish structure is stronger.
The Value Cloud helps identify whether price is near fair value or extended. Signals near value are usually cleaner. Signals very far from value can be late unless strong impulse conditions are present.
Recommended settings:
For scalping:
Use Fast mode with Clean or Minimal visuals.
For day trading:
Use Balanced mode with MTF Stack enabled.
For swing trading:
Use Precision mode with MTF Stack enabled.
For screenshots and deeper analysis:
Use Full visual density.
Honest limitations:
This indicator does not know the future. It cannot guarantee the next price movement. It can produce losing signals during chop, news events, low liquidity, fakeouts, abnormal spreads, and sudden volatility shocks.
The prediction cone is an estimation, not a promise.
This tool is best used as a confluence engine together with market structure, higher-timeframe direction, liquidity zones, and proper risk management.
For safer behavior, keep Confirm Signals On Candle Close enabled.
Honest Opinion / Carefully Read
Tri-Vector Flow Predictor v3.2 is designed as a clean decision-support engine, not a perfect signal system.
Its strongest feature is the one-entry / one-exit trade state. Instead of spamming repeated labels, it shows a clearer flow: LONG entry, LONG exit, SHORT entry, and SHORT exit.
The indicator combines trend, volatility, structure, liquidity sweeps, FVG impulses, retests, volume pressure, regression quality, and MTF agreement to estimate the probable next move.
The prediction cone is only a probabilistic guide. It is not a guaranteed future price path. Price can still move against the forecast during chop, news, fakeouts, low liquidity, or sudden volatility.
This tool is best used as confluence with market structure, higher-timeframe direction, liquidity zones, and proper risk management.
Use it as a trading assistant, not as financial advice.
Indicador
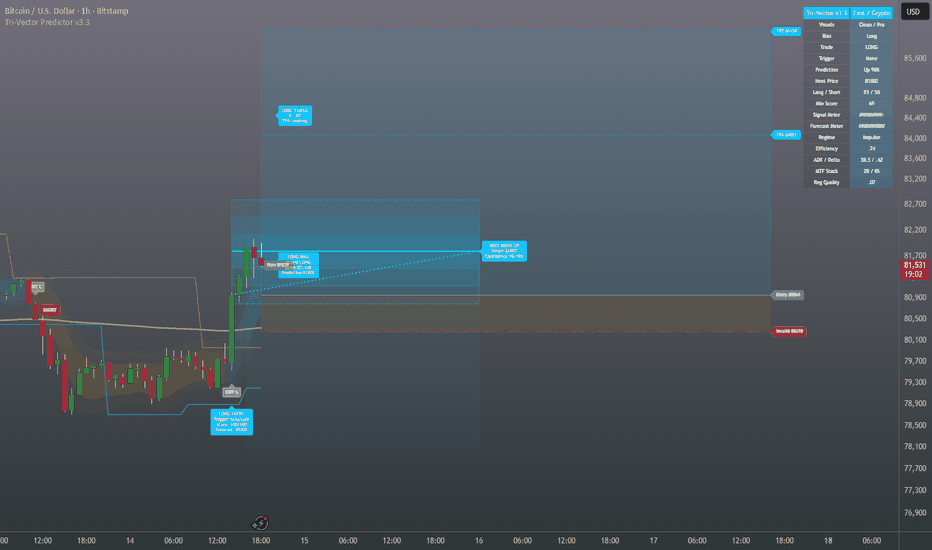
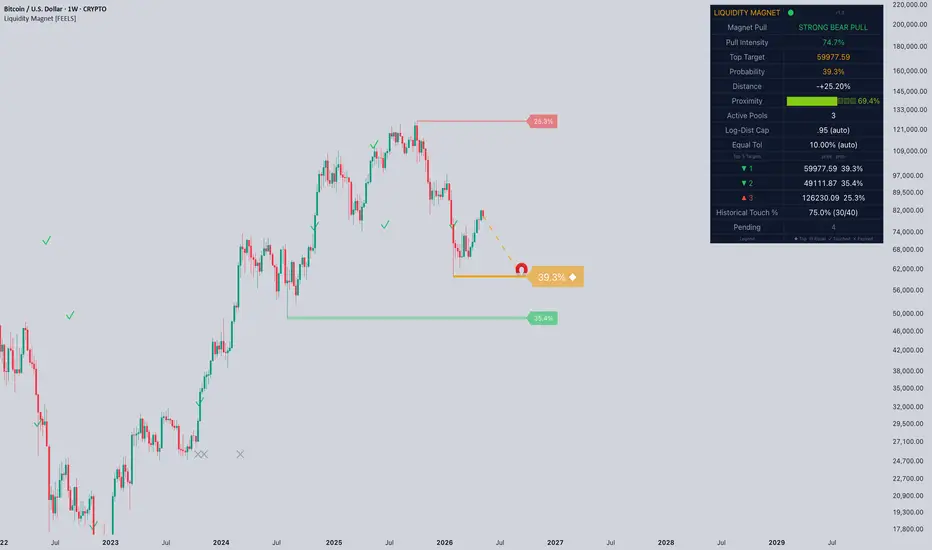
Liquidity Magnet [FEELS]A scoring engine for liquidity zones. Every active pool (swing high,
swing low, or equal-level cluster) gets ranked by probability of being
reached. The highest-probability zone is marked as the top magnet —
the single most likely target right now.
OVERVIEW
Liquidity Magnet is a composite probability scoring system for liquidity zones —
the price levels where resting orders cluster around swing highs, swing lows,
and equal levels. The script ranks every active zone by likelihood of being
reached by price and highlights the single most probable target as the
"top magnet". This is a probabilistic analysis tool, not a predictive signal
generator.
WHAT MAKES IT ORIGINAL
Most existing liquidity tools simply plot pivots or equal highs/lows as static
lines. This script does three things differently:
1. Probability ranking, not binary detection.
Each zone receives a composite score from four independent factors and is
converted into a percentage probability relative to all other active zones.
The result is a relative ranking instead of an undifferentiated list of
levels.
2. Logarithmic distance filtering with timeframe auto-scaling.
Distance to price is measured in log space, which makes the filter
symmetric across price decades. A pool 50% below price has the same
"distance weight" as a pool 50% above. The acceptable distance range
also auto-adjusts to the chart timeframe — weekly charts use a wider
range than 1-minute charts.
3. Transparent track record.
When the top magnet changes, the previous one is recorded and its outcome
tracked over a configurable window. Each historical magnet is marked as
"touched" (price reached it) or "expired" (window passed without reaching).
The dashboard shows the rolling touch rate so users can evaluate the
scoring behavior on the instrument and timeframe they actually trade.
HOW IT WORKS
Liquidity zone detection
The script identifies confirmed swing highs and swing lows using a
configurable pivot lookback. Pivots in the same direction that fall within
a tolerance band are merged into a single "equal liquidity" zone. The
tolerance band auto-scales to timeframe (wider on higher timeframes where
each bar covers more range, narrower on intraday).
Composite probability score
Every active zone receives a raw score combining four weighted components:
- Strength : volume at the pivot bar normalized against a 50-bar volume SMA,
multiplied by a clustering bonus if the zone was formed by merged pivots.
- Proximity : an inverted-U curve over the logarithmic distance to price,
peaking around 2% from current price and decaying symmetrically in both
directions.
- Age : a maturity curve. Very fresh zones are discounted (the market has
not had time to confirm them), mature zones get full weight, and very
old zones decay gradually.
- Momentum : a directional alignment factor. If short-term EMA momentum
points toward a zone, that zone's score is boosted; if momentum points
away, the score is reduced.
All zone scores are then divided by their sum to produce a probability
percentage. The highest-percentage zone is the top magnet.
Magnet Pull direction
The dashboard's Magnet Pull metric reports the direction toward the top
magnet (bullish if the top zone is above price, bearish if below), weighted
by the share of total score on that side. This is a direction indicator,
not a momentum signal.
Pruning
Zones are removed when one of three things happens: price reaches the zone
(swept), the zone exceeds the maximum age in bars, or the zone moves outside
the log-distance filter as price evolves.
HOW TO USE IT
The intended workflow is contextual, not signal-based:
1. Open the chart on your trading timeframe. Auto-scale picks reasonable
defaults for clustering tolerance and distance filter; both can be
overridden manually.
2. Read the dashboard. The top target price and probability give you the
single most likely magnet. The Magnet Pull and Pull Intensity describe
directional bias. The proximity progress bar shows how close price
currently is to the top magnet in log space.
3. Use Top 3 targets for alternatives. The probability gap between rank 1
and ranks 2-3 tells you how dominant the top magnet is. A 40% / 38% /
22% spread is much less decisive than a 60% / 25% / 15% spread.
4. Enable Historical Track to evaluate behavior. Past top magnets are
marked with their outcome on the chart. The rolling Historical Touch %
in the dashboard summarizes the script's recent behavior on the current
instrument and timeframe. This is observational data, not a guarantee.
5. Treat outputs as context, not signals. The script highlights where
liquidity is concentrated and which target the composite model considers
most probable. Trade entries, stop placement, and position sizing remain
the user's responsibility.
PARAMETERS
Pivot Lookback — bars on each side used to confirm a swing point. Higher
values produce fewer but more significant zones.
Equal H/L Tolerance % — clustering threshold. Pivots within this percentage
in the same direction merge into a single zone. Auto-scaled by default.
Log-Distance — maximum allowed distance in log space between price and any
active zone. Auto-scaled by default. Symmetric: covers both above and below
price.
Weight inputs (Strength, Proximity, Age, Momentum) — relative influence of
each scoring component. Default values are calibrated for crypto and equity
intraday/swing usage. Adjusting weights changes the character of the ranking.
Tracking Window (bars) — how long a former top magnet stays "pending" before
being marked as expired.
UI Sizing controls — dashboard position, dashboard text size, zone label
sizes, magnet marker size, historical marker size, all independently
adjustable for personal screen and screenshot preferences.
QUICK START
1. Add the script to any chart
2. Auto-scale handles parameters automatically
3. Look at "Top Target" in the dashboard — that's the most likely magnet
4. Look at "Magnet Pull" — that's the directional bias
5. Turn on "Show Historical Top Magnets" to see past behavior
No setup required. All defaults are calibrated.
TESTED ACROSS
Verified visually on multiple instruments and timeframes:
- Cryptocurrency: BTCUSD, ETHUSD, SOLUSD on 1H to 1W
- Equity indices: NQ, ES on 4H to 1D
- Forex majors: EURUSD, GBPUSD on 1H to 1D
- Commodities: Gold (XAUUSD), Crude Oil on 1D
Auto-scale parameters cover all these instruments and timeframes without
manual tuning. Manual override is available for specific instrument behavior.
NOTES AND LIMITATIONS
- The script is non-repainting on confirmed bars. Pivot detection uses a
fixed forward lookback, which means zones appear after the pivot is
confirmed (lookback bars after the high/low), not in real-time at the
exact bar of the high/low. This is intentional.
- Probability percentages are relative weights inside the active zone set,
not absolute statistical probabilities. They describe the composite
model's ranking, not a calibrated forecast.
- The Historical Touch % is a descriptive statistic over a rolling window.
It reflects observed behavior and does not project future performance.
- Bar Replay is supported: scoring updates on every confirmed bar and
historical markers are placed at the recorded positions, so the chart
behaves consistently when scrubbing through history.
- The script does not generate buy/sell signals. There is no entry/exit
logic, no stop/target output, and no strategy() conversion. It is a
visual analysis tool.
This script is original work. The composite scoring formula, the log-distance
filtering approach, the pool merging algorithm, the directional Magnet Pull
metric, and the historical tracking logic are all custom implementations
written specifically for this script. Indicador

Indicador

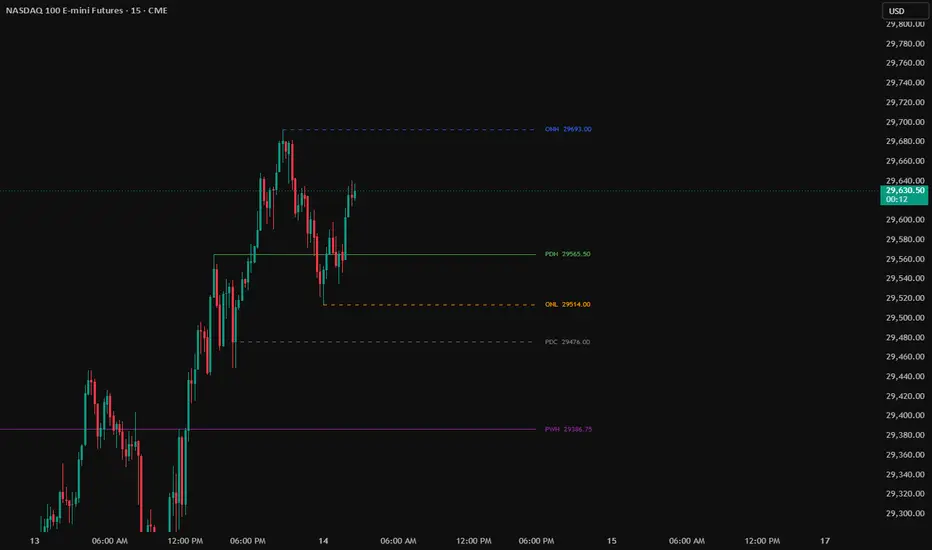
Key Levels: PDH/PDL + ONH/ONL + PWH/PWL + PMH/PMLA clean, no-repaint indicator that plots the most important reference levels traders watch every session — anchored exactly at the candle that made each high or low, with right-side labels showing the price.
Levels included:
PDH / PDL — Previous Day High & Low, calculated strictly from your chosen Regular Trading Hours session (default 0930-1600 ET), so overnight wicks don't contaminate the levels
PDC — Previous Day Close (optional), anchored at the actual 4:00 PM RTH close
ONH / ONL — Overnight High & Low, with a fully customizable session window (default 2000-0400 ET, ending before pre-market). The lines paint live during the overnight session, expanding as new highs/lows print, then freeze in place when the session ends
PWH / PWL — Previous Week High & Low
PMH / PML — Previous Month High & Low
Features:
Per-level toggles, colors, line widths (1–5), styles (solid / dashed / dotted), and transparency
Each line is anchored at the actual wick that created the high or low — no floating horizontals
Only one set of lines on the chart at any time — clean and uncluttered
Right-side labels with the level name and exact price
Configurable session timezone (defaults to America/New_York)
Adjustable right-extension distance
Uses time-based anchoring, so it works on every timeframe from 1-minute up to daily without bar-limit errors
No repainting — previous-period values freeze the moment a new period begins Indicador

Indicador

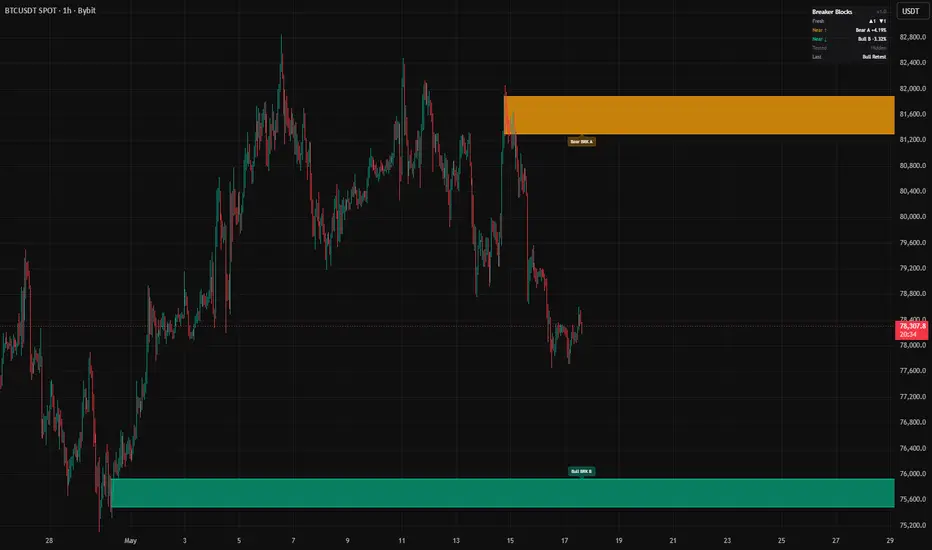
Acceptance Failure Path Map [AGPro Series]Acceptance Failure Path Map
🧠 Core Idea
Did price truly accept beyond a market boundary, or did that acceptance fail and create a new reaction path?
📌 Overview / What it does
Acceptance Failure Path Map is a market-structure visualization tool designed to study acceptance, failed acceptance, reclaim attempts, and continuation behavior around a defined reference range.
The script maps an acceptance band, detects whether price holds above or below that band, and highlights when accepted price fails back through the boundary. It produces compact labels, a centered path zone, right-side state tags, and an AG Pro panel that summarizes the current acceptance context.
It does not predict price direction, automate decisions, or claim that any acceptance event must continue. Its purpose is to make acceptance quality easier to read.
🎯 Purpose & Design Philosophy
This script was built for traders who want to understand whether a move is being accepted by the market or rejected after a temporary push beyond structure.
Many breakout tools mark only the breakout event. This script focuses on what happens after the breakout: acceptance, failure, reclaim pressure, and continuation risk.
The design supports a patient, context-first workflow where the trader reads the path of price around a boundary instead of reacting to a single candle.
⚡ Why This Script Is Different
Most tools focus on breakout signals, support and resistance touches, or simple range breaks.
This script does NOT treat every break as meaningful acceptance.
Instead, it builds a path map around acceptance quality, failure timing, reclaim behavior, and current risk state. The result is a cleaner view of whether price is holding acceptance or losing it.
⚙️ Methodology
1. Context Detection
The script builds a reference range from recent market structure and applies an ATR-based buffer to reduce noise.
2. Reference Mapping
It defines upper and lower acceptance boundaries and tracks whether price closes beyond them for the required number of bars.
3. Reaction Evaluation
After acceptance appears, the script monitors whether price fails back through the boundary, attempts reclaim, or holds continuation.
4. Visual Output
The chart displays an acceptance path zone, event labels, right-side state tags, and a panel summarizing the current condition.
🗺️ How to Read the Chart
Zones show the current acceptance path area around the active boundary.
Labels highlight acceptance above, acceptance below, acceptance failure, reclaim tests, and held acceptance.
Colors separate bullish acceptance, bearish acceptance, neutral failure risk, and reclaim context.
The panel shows the current path state, acceptance side, failure risk, path quality, reference range, active boundary, and next context.
🚦 Signals & States
• ACCEPT ABOVE → Price has accepted above the reference boundary.
• ACCEPT BELOW → Price has accepted below the reference boundary.
• ACCEPT FAIL → Accepted price failed back through the boundary within the failure window.
• RECLAIM TEST → Price is testing reclaim after a failed acceptance event.
• ACCEPT HELD → Acceptance remained valid after the failure window.
🔔 Alerts Logic
Alerts trigger when the script detects acceptance above, acceptance below, acceptance failure, or reclaim testing.
These alerts are attention markers. They are not trade instructions, entry signals, or guaranteed outcomes.
🧩 Confluence Logic
The context becomes stronger when acceptance quality, distance from the reference range, participation, and follow-through direction align.
If acceptance appears without follow-through or quickly returns through the boundary, the failure context becomes more important.
📊 When to Use
• After range breaks
• Around support and resistance transitions
• During breakout retests
• When price is attempting to hold above or below a major boundary
• When evaluating whether market structure is accepted or rejected
⚠️ When NOT to Use
• Extremely illiquid markets
• Very noisy low-timeframe candles
• News-driven spikes with unstable spreads
• Markets with no meaningful reference range
• Situations where a single indicator is being used without broader context
🎛️ Key Inputs
• Reference Range Length → controls how much structure is used to build the acceptance boundary.
• Acceptance Bars → controls how many closes are required before acceptance is recognized.
• Failure Window → controls how quickly accepted price must fail back through the boundary.
• Boundary Buffer ATR → adjusts the buffer around the reference range.
• Label and Panel Font Size → adjust chart readability.
• Visible Band Bars and Band Projection Bars → control how the acceptance zone appears on the chart.
🖥️ Interface & Visual Design
The interface is designed for a premium, clean chart view.
The panel provides the current summary. The acceptance zone carries the main story. Labels are compact and spaced to avoid hiding candles.
The visual hierarchy is intentionally simple: zone first, current state second, event labels third.
🧪 Practical Usage Workflow
1. Read the AG Pro panel to identify the current path state.
2. Check whether price is above, below, or inside the acceptance path zone.
3. Review recent labels to understand whether acceptance held, failed, or reclaimed.
4. Compare the current failure risk and path quality with broader market context.
5. Use alerts only as attention markers for further review.
🔍 Interpretation Guidelines
Acceptance is stronger when price remains outside the boundary with follow-through.
Acceptance failure is more meaningful when price quickly returns through the boundary after appearing accepted.
Reclaim tests should be interpreted as context changes, not automatic reversal signals.
Held acceptance suggests the market is continuing to respect the accepted side, but it still requires confirmation from broader structure.
🚫 What This Script Is NOT
This script is not a prediction engine.
It is not financial advice.
It is not an automated trading system.
It does not provide guaranteed buy or sell signals.
It does not replace risk management, market context, or independent analysis.
⚠️ Limitations & Transparency
Acceptance behavior can look different across timeframes.
High volatility can create temporary false readings.
Low-liquidity markets may produce unstable boundary behavior.
The script is rule-based and depends on the selected settings, symbol behavior, and chart timeframe.
🧠 Market Context Notes
Acceptance and failure are closely related to market structure, liquidity reaction, and participant commitment.
When price breaks a boundary but cannot hold it, the failed side may become the more important context.
When price accepts and holds, the market may be showing stronger directional commitment.
🧾 Use Case Examples
When price accepts above a range and holds beyond the failure window, the chart may show an ACCEPT HELD context.
When price accepts above a boundary but quickly closes back below it, the script may mark ACCEPT FAIL.
When price returns back toward a failed boundary, the script may show a RECLAIM TEST state.
🧱 System Philosophy
AGPro Series tools are built to visualize market context without turning analysis into prediction.
The goal is to make structure, risk, and reaction quality easier to observe in real time.
🔐 Non-Promise Statement
No script can guarantee market direction, timing, or outcome.
This tool provides structured visual context only.
📉 Risk Disclosure
Trading involves risk.
Users are responsible for their own decisions, risk management, and position sizing.
This script does not provide financial advice or guaranteed trading results.
📚 Educational Note
Use this script as a learning and analysis tool for studying acceptance, failed acceptance, reclaim pressure, and continuation behavior around market boundaries.
Indicador

Indicador

Smart Liquidity Map - Institutional MTFSmart Liquidity Map (SLM) - Multi-Timeframe Institutional Orderblocks
Description:
This advanced trading tool generates a fully automated institutional liquidity map directly on your price chart. By scanning key algorithmic levels, it precisely targets institutional resting orders (Buy-Side & Sell-Side Liquidity). Thanks to a smart adaptive script engine, it works perfectly across any chart resolution, maintaining a rock-solid, constant multi-timeframe perspective.
Core Features:
Fixed Multi-Timeframe Matrix (1H, 4H, 1D):
Removes lower-timeframe noise. The indicator strictly tracks the three most critical institutional horizons: 1-Hour, 4-Hour, and Daily pivots.
Smart Confluence Engine (Combo Zones):
When opposing liquidity levels (BSL & SSL) collide within a narrow price threshold, they instantly merge into a highly significant, dark orange Combo Zone .
Overlay & Cluster Aggregation:
If same-direction levels overlap across different timeframes (e.g., 1H BSL + 4H BSL), the chart remains clean. The dynamic label automatically lists all involved timeframes (e.g., BSL ).
Volume Profile POC Box:
Dynamically computes the Point of Control (POC) based on historical volume distribution and renders it as a clean, custom gray box with high-contrast labeling.
Real-Time Sweep Mitigation:
As soon as price sweeps a liquidity level, the zone gets updated instantly (removed or faded) to keep your workspace clean and efficient.
Visual Color Guide:
Red: Pure Buy-Side Liquidity (BSL) – Resistance / Short Targets.
Green: Pure Sell-Side Liquidity (SSL) – Support / Long Targets.
Orange: Mixed Combo Zones (BSL + SSL Confluence).
Gray: Volume Profile Point of Control (POC). Indicador
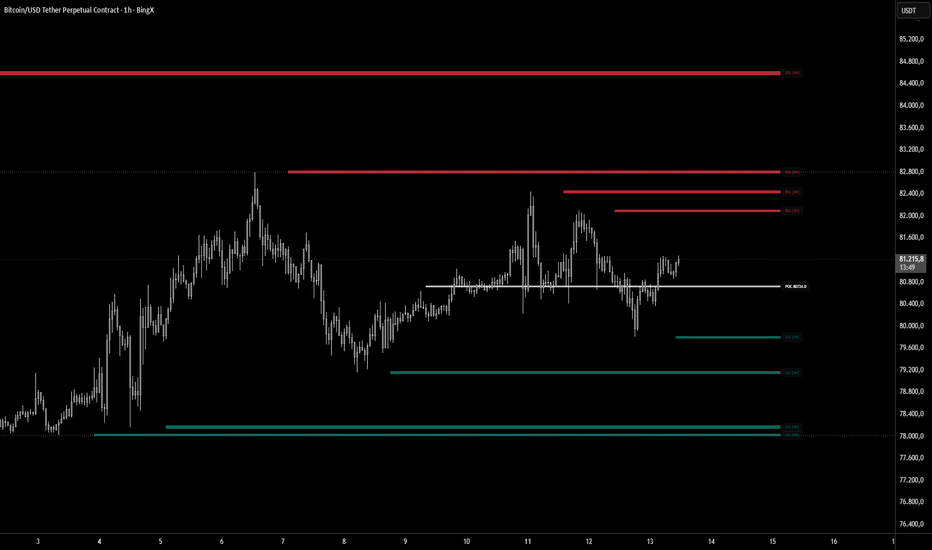
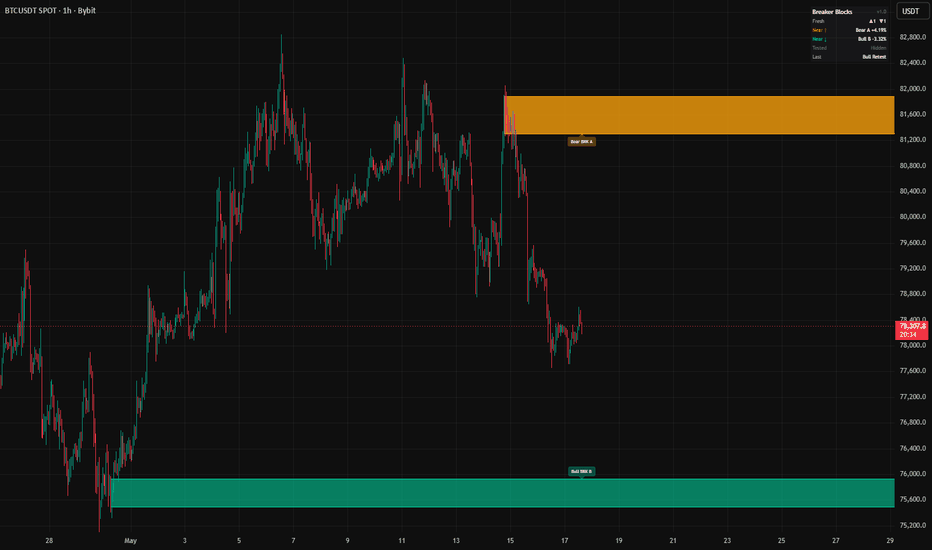
Stop Cluster Magnet Map [AGPro Series]Stop Cluster Magnet Map
🧠 Core Idea
Where are clustered stops likely sitting, and is price being pulled toward them or rejecting after a sweep?
📌 Overview / What it does
Stop Cluster Magnet Map is a rule-based liquidity and market-structure visualization tool designed to identify repeated swing-high and swing-low areas where stop orders may cluster.
The script maps upper and lower stop-cluster zones, grades their quality, tracks magnet pressure, and highlights potential sweep or rejection behavior after price interacts with those zones.
It does not predict future price direction, automate trades, or claim that any stop cluster must be taken. It only visualizes structural conditions that may deserve attention.
🎯 Purpose & Design Philosophy
This script was built to solve a common chart-reading problem: traders often talk about liquidity above highs or below lows, but many tools do not clearly separate clustered stop areas from random swing points.
The design goal is to make stop-cluster context visible at a glance without turning the chart into a noisy signal machine.
It helps traders who study price action, liquidity sweeps, equal highs, equal lows, stop hunts, and structural reaction zones.
⚡ Why This Script Is Different
Most tools mark every swing high or swing low as if each level has the same importance.
This script does NOT treat every pivot as meaningful liquidity.
Instead, it looks for repeated nearby swing points, builds a mapped stop-cluster zone, grades the cluster, tracks magnet pressure, and separates sweep behavior from simple proximity.
⚙️ Methodology
1. Context Detection
The script detects confirmed swing highs and swing lows using a configurable pivot length.
2. Reference Mapping
Nearby repeated swing highs are grouped into an upper stop cluster, while nearby repeated swing lows are grouped into a lower stop cluster.
3. Reaction Evaluation
The script evaluates distance, recency, number of touches, sweep events, and post-sweep close behavior.
4. Visual Output
The active stop-cluster zones, magnet rail, right-side tags, event labels, and decision panel are displayed using a clean AGPro visual hierarchy.
🗺️ How to Read the Chart
Zones represent areas where repeated highs or lows have created potential clustered stops.
Labels identify important events such as upper stops, lower stops, magnet pressure, and sweep behavior.
Colors follow the AGPro visual language: teal for lower-side or recovery-oriented context, pink for upper-side or risk-oriented context, yellow for neutral attention, and indigo for magnet reference.
The panel summarizes the current magnet state, score, upper/lower cluster quality, cluster prices, sweep risk, next context, and active timeframe.
🚦 Signals & States
• UPPER STOPS → repeated swing highs have formed a valid upper stop cluster
• LOWER STOPS → repeated swing lows have formed a valid lower stop cluster
• UPSIDE MAGNET → price is near a higher-quality upper stop cluster
• DOWNSIDE MAGNET → price is near a higher-quality lower stop cluster
• UPPER SWEEP → price moved above the upper cluster and closed back inside
• LOWER SWEEP → price moved below the lower cluster and closed back inside
• BALANCED CLUSTERS → both upper and lower clusters are active, with no dominant side
🔔 Alerts Logic
Alerts can trigger when a new upper or lower stop cluster becomes valid, when price sweeps a stop cluster and closes back inside, or when the dominant magnet side changes.
These alerts are attention markers only. They are not buy or sell signals.
🧩 Confluence Logic (Optional)
The context becomes stronger when a valid stop cluster has multiple touches, remains recent, price approaches the cluster, and sweep behavior appears with a close back inside the mapped zone.
Cluster quality plus proximity plus reaction behavior creates a stronger read than any single condition alone.
📊 When to Use
• Around equal highs or equal lows
• During range-bound markets where stop pools may form
• Before or after liquidity sweeps
• When price is approaching a visible cluster of prior swing points
• When evaluating whether a move is targeting external liquidity
⚠️ When NOT to Use
• In extremely illiquid markets
• During chaotic news-driven candles
• When price history is too short to build reliable clusters
• When the chart is dominated by random spikes rather than readable structure
• As a standalone entry or exit system
🎛️ Key Inputs
• Swing Pivot Length → controls how swing highs and lows are confirmed
• Cluster Validity Lookback → controls how long a cluster remains relevant
• Minimum Cluster Touches → controls how many nearby pivots are needed
• Cluster Width ATR → controls how wide each stop-cluster grouping can be
• Magnet Nearness ATR → controls how sensitive magnet proximity becomes
• Visual settings → control zones, labels, right-side tags, panel, and font sizes
🖥️ Interface & Visual Design
The interface is designed for fast chart reading.
The panel gives the current decision context. Zones show where clustered stops may sit. Labels mark key events. Right-side tags keep current levels readable without forcing the trader to inspect every candle.
The layout is intentionally clean, premium, and structured for public-chart screenshots.
🧪 Practical Usage Workflow
1. Read the panel to identify the current magnet state.
2. Check whether the upper or lower stop-cluster zone is active.
3. Watch how price behaves near the mapped cluster.
4. Evaluate whether a sweep closes back inside or continues beyond the zone.
5. Use broader market context before making any decision.
🔍 Interpretation Guidelines
A strong stop cluster does not mean price must move there.
A sweep does not automatically mean reversal.
The best interpretation comes from combining cluster quality, distance, market structure, volume behavior, volatility, and the trader's own higher-timeframe context.
🚫 What This Script Is NOT
This script is not a prediction engine.
It is not financial advice.
It is not an automated trading system.
It does not provide guaranteed signals.
It does not know where actual broker stop orders are placed.
⚠️ Limitations & Transparency
The script estimates stop-cluster areas using visible chart structure only.
Different timeframes may show different clusters.
High volatility can expand zones and change quality scores quickly.
Market conditions can shift, and a previously important cluster may lose relevance over time.
🧠 Market Context Notes (Optional)
Stop clusters often matter because repeated highs and lows can become obvious reference points.
When many traders see the same level, price may react around that area, sweep it, reject from it, or continue through it.
This script is designed to make that structural pressure easier to observe.
🧾 Use Case Examples (Optional)
When price approaches an upper stop cluster with a high quality score, the trader can monitor whether the market sweeps above it and closes back inside.
When lower stops cluster beneath a range, the trader can watch whether price is being pulled toward downside liquidity or rejecting before reaching it.
🧱 System Philosophy (Advanced)
The AGPro approach focuses on structured decision support, not hype.
This script turns repeated swing references into a readable liquidity map so traders can evaluate context instead of reacting to isolated candles.
🔐 Non-Promise Statement
No script can guarantee outcomes.
Stop-cluster mapping is a contextual tool, not certainty.
📉 Risk Disclosure
Trading involves risk.
Users are fully responsible for their own analysis, risk management, and trading decisions.
This script is provided for educational and analytical purposes only and does not constitute financial advice.
📚 Educational Note (Optional)
Use this tool to study how repeated highs, repeated lows, sweeps, and reactions appear across different timeframes.
The goal is to improve market observation, not to replace disciplined analysis. Indicador

Initial Balance Suite [ChartSmith]Initial Balance Suite tracks the high, low, and midpoint established during a configurable opening window, then projects extension levels and archives prior sessions — giving you a complete picture of the day's structural framework from the first bar after the IB closes.
━━━━━━━━━━━━━━━━━━━━━━━━━━━━━━━━━━
WHAT IS THE INITIAL BALANCE?
━━━━━━━━━━━━━━━━━━━━━━━━━━━━━━━━━━
The Initial Balance is the price range established during the opening period of a session — traditionally the first hour of RTH trading. The high and low formed during this window define the day's foundational structure. When price stays inside the IB, the market is balancing. When price breaks out of it, the market is entering price discovery. Extension levels above and below the IB project how far that discovery might reach.
━━━━━━━━━━━━━━━━━━━━━━━━━━━━━━━━━━
SESSION SETTINGS
━━━━━━━━━━━━━━━━━━━━━━━━━━━━━━━━━━
Session Start — Set the hour and minute at which the IB window begins. Defaults to 9:30, the RTH open.
Timezone — Aligns the session start to the correct local time. Options: America/New_York · America/Chicago · Europe/London · Asia/Tokyo · UTC.
IB Length — Controls how long the opening window runs before the IB is considered complete. Available options: 30s · 1m · 2m · 3m · 5m · 10m · 15m · 30m · 1hr · 2hr · 4hr. The IB high and low accumulate bar by bar throughout this window, locking in the final levels only when the window closes.
Note: your chart timeframe must be shorter than or equal to the selected IB length for the levels to calculate correctly.
━━━━━━━━━━━━━━━━━━━━━━━━━━━━━━━━━━
INITIAL BALANCE LEVELS
━━━━━━━━━━━━━━━━━━━━━━━━━━━━━━━━━━
IB High (IBH) — The highest price reached during the IB window.
IB Low (IBL) — The lowest price reached during the IB window.
IB Mid (IBM) — The midpoint of the IB range: (IBH + IBL) / 2.
Fill Area — Shades the region between IBH and IBL to visually define the balance zone.
Extend Right — Extends all IB lines to the right edge of the chart until the next session begins.
Each level has independent color, width, and line style (Solid / Dashed / Dotted) controls.
━━━━━━━━━━━━━━━━━━━━━━━━━━━━━━━━━━
EXTENSION LEVELS
━━━━━━━━━━━━━━━━━━━━━━━━━━━━━━━━━━
Extension levels project above IBH and below IBL using multiples of the IB range. Each level can be toggled and colored independently.
+/− 50% — IBH/IBL ± (0.5 × IB Range)
+/− 100% — IBH/IBL ± (1.0 × IB Range)
+/− 150% — IBH/IBL ± (1.5 × IB Range)
+/− 200% — IBH/IBL ± (2.0 × IB Range)
+/− 300% — IBH/IBL ± (3.0 × IB Range)
All extensions share a global width and style setting. Extensions are off by default — enable Show Extensions to display them.
━━━━━━━━━━━━━━━━━━━━━━━━━━━━━━━━━━
PREVIOUS DAYS
━━━━━━━━━━━━━━━━━━━━━━━━━━━━━━━━━━
Completed sessions are automatically archived and displayed as prior-day reference levels. Each prior session is restyled with its own color, width, and line style so it stays visually distinct from the current session.
Days to Show — Controls how many prior sessions are kept on the chart (1–10). Sessions beyond this count are deleted automatically.
Fill Area — Optionally shades the prior session's IBH-to-IBL range. Off by default.
Show Extensions — Optionally carries prior session extension lines forward. Off by default.
When a new session begins, the current IB is immediately reclassified as a prior-day level — no manual management required.
━━━━━━━━━━━━━━━━━━━━━━━━━━━━━━━━━━
LABELS
━━━━━━━━━━━━━━━━━━━━━━━━━━━━━━━━━━
Labels appear at the right edge of each line and display the level name alongside its current price, formatted to the instrument's minimum tick. Size options: Auto · Tiny · Small · Normal · Large · Huge.
━━━━━━━━━━━━━━━━━━━━━━━━━━━━━━━━━━
ALERTS
━━━━━━━━━━━━━━━━━━━━━━━━━━━━━━━━━━
Twelve alert conditions are built in, all gated so they only fire after the IB has fully formed:
- IBH Cross Up / IBL Cross Down
- IBH Touch / IBL Touch
- +50% Cross Up / −50% Cross Down
- +100% Cross Up / −100% Cross Down
- +200% Cross Up / −200% Cross Down
- +300% Cross Up / −300% Cross Down
━━━━━━━━━━━━━━━━━━━━━━━━━━━━━━━━━━
USAGE NOTES
━━━━━━━━━━━━━━━━━━━━━━━━━━━━━━━━━━
- The IB locks in the moment the opening window closes — levels will not repaint after that point.
- Extensions default to off. Enable Show Extensions first, then toggle individual levels.
- Previous session extensions are also off by default and are controlled separately from the current session under Previous Days → Show Extensions .
- To use with non-US sessions, adjust both the Session Start time and the Timezone to match your exchange. Indicador