Session VWAP Reaction Engine [AGPro Series]Session VWAP Reaction Engine
Session VWAP Reaction Engine builds the active intraday session VWAP as a reaction anchor and classifies confirmed price behaviour around it into three clear event types — Reclaim, Bounce, and Reject — each validated by a configurable confirmation window, a minimum prior-side bar filter, and an optional VWAP slope alignment filter. A volatility-scaled reaction corridor, compact reaction zones, a session box, and a minimal right-side bias panel turn raw session flow into a clean, publication-ready read on acceptance, rejection, and continuation.
🔷 OVERVIEW
Most session VWAP tools simply plot the line. Session VWAP Reaction Engine goes further: it reads how price behaves around the line inside a selected session window (Asia, London, New York, or Custom) and labels that behaviour using three structural event classes:
• Reclaim — a confirmed cross and acceptance on the new side of session VWAP, after price has spent a minimum number of bars on the opposite side.
• Bounce — a test of the reaction corridor edge that closes back on the prevailing side, with body-range and slope alignment quality checks feeding a Strong / Clean / Weak strength read.
• Reject — a wick into session VWAP that fails to accept on the other side, resolving as pressure against the crossing attempt.
Each confirmed event paints a compact rectangular reaction zone, a single label near the zone, and updates a right-side bias panel so the current session's story is always readable at a glance.
🟦 WHAT MAKES IT DIFFERENT
▸ Event classification, not just a line. Reclaim, Bounce, and Reject are treated as distinct structural events — each with its own confirmation path and visual signature — instead of blending into a single "crossed VWAP" signal.
▸ Corridor-based reaction detection. Bounce and Reject use a volatility-scaled ATR corridor around session VWAP rather than a single-pixel touch, which matches how VWAP is typically tested in real intraday flow.
▸ Slope-aware trend filter. Optional VWAP slope alignment biases bounce events toward the prevailing session direction and filters out counter-flow reactions that tend to fail.
▸ Reaction Strength read. Bounces are classified Strong / Clean / Weak using body-to-range ratio, close location in range, and slope alignment — turning every bounce into a quality-graded event.
▸ Active-Only and Publish Focus visual modes. The chart stays clean by surfacing only the latest session and the latest confirmed reaction, with older structure fading or removed. Ideal for decision-making and presentation.
🟣 METHODOLOGY
1) Session anchor. The selected session (Asia / London / New York / Custom) resets a cumulative PV / V VWAP on every new session bar, giving a fresh reaction reference for that window.
2) Prior-side filter. Before any Reclaim or opposite-side reaction can qualify, price must have spent a minimum configurable number of bars on one side of session VWAP. This isolates structural interactions and rejects chop.
3) Reclaim confirmation. A raw cross must be followed by N consecutive confirmed closes on the new side (default 2) before the Reclaim is validated and painted.
4) Corridor reactions. A volatility-scaled corridor (ATR × user multiplier) around session VWAP defines where Bounce and Reject qualify. Bounces require a corridor-edge test plus a close back on the prevailing side with body confirmation; Rejects require a wick into session VWAP that closes on the originating side.
5) Bias and state synthesis. Live Bias (Bullish / Bearish Acceptance or Pressure, or Neutral Rotation) is derived from close position relative to VWAP and corridor. Reaction State reflects the latest confirmed event (Bullish Acceptance, Bearish Acceptance, Bounce Support, Bounce Resistance, Reject Pressure, Reject Lift).
6) Post-session context. After the session ends, the last session VWAP and corridor stay on the chart for a configurable number of bars so recent structure remains visible without polluting older history.
🟢 SIGNALS & ALERTS
Eight alertcondition hooks are provided, all bar-close confirmable:
• Bullish Session VWAP Reclaim Confirmed
• Bearish Session VWAP Reclaim Confirmed
• Bullish Session VWAP Bounce Confirmed
• Bearish Session VWAP Bounce Confirmed
• Bullish Session VWAP Reject Confirmed
• Bearish Session VWAP Reject Confirmed
• Reaction State Shifted Bullish
• Reaction State Shifted Bearish
A "Confirmed Alerts Only" toggle restricts firing to barstate.isconfirmed so alerts will not repaint before close.
🟡 KEY INPUTS
Session Engine
• Selected Session — Asia / London / New York / Custom
• Custom Session — HHmm-HHmm format (used when Custom is selected)
• Session Timezone — Exchange / UTC / London / New York / Singapore
Reaction Engine
• Reclaim Confirm Bars — number of confirmed closes required after a cross (default 2)
• Minimum Prior Side Bars — whipsaw filter on the opposite side before qualifying (default 2)
• Reaction Corridor Width (ATR) — half-width of the ATR corridor around VWAP (default 0.20)
• Reaction Zone Length (Bars) — how far a confirmed zone extends right (default 14)
• Use VWAP Slope Alignment — trend filter for bounce events (default on)
• VWAP Slope Lookback — slope estimation window (default 3)
• Post-Session Context Bars — how long last session structure stays visible (default 18)
Visual Story
• Active-Only Mode, Publish Focus Mode, Show Previous Reaction Ghost
• Show Session Box, Show VWAP Reaction Corridor, Show Confirmed Reaction Zone
• Show Reaction Label, Show Session VWAP, Show Right-Edge SVWAP Tag
• Visible History Bars (default 700), Label Font Size (default Normal)
Panel
• Show Bias Panel (top-right), Panel Font Size (default Normal)
Alerts
• Confirmed Alerts Only (default on)
🟠 HOW TO USE
1) Apply to any intraday timeframe (1m–4h). Session VWAP requires intraday data to anchor the session reference.
2) Choose the session that best fits your market focus — New York for US equities and US-hours crypto, London for FX and European hours, Asia for Asian-session flow, or a Custom window.
3) Watch the corridor as the session develops. Bounce and Reject events inside the corridor describe how the session is defending or failing the VWAP reference.
4) Use Reclaim events as session-context shifts — combine with your own structure (HTF trend, S/R, order flow) rather than treating them as standalone entries.
5) Read the right-side Bias Panel for a compact summary: Session Status, Bias, Last Reaction, Reaction Strength, Signal Age, Reaction State, and Latest Line status.
6) For screenshots and presentation use, keep Publish Focus Mode and Active-Only Mode enabled — older sessions fade and only the latest structure remains dominant.
🟤 LIMITATIONS & TRANSPARENCY
• Intraday-only. Session VWAP is meaningful only on intraday timeframes; on daily and higher, the indicator will remain idle.
• Session VWAP resets at the start of each selected session. Reactions are evaluated within that window only.
• Confirmed events use bar-close logic. Intra-bar touches of the corridor are not counted as events until the bar closes.
• Volume-dependent. Session VWAP uses symbol volume. On symbols without meaningful volume, VWAP accuracy will be limited.
• The Reaction Corridor is a volatility-scaled visual and detection band, not a support/resistance guarantee.
⚠️ RISK DISCLOSURE
This indicator is an analytical and visualisation tool. It is not a trading strategy, does not generate buy/sell recommendations, does not predict future price direction, and does not guarantee any specific outcome. All signals, zones, and panel readings describe past and current price behaviour around session VWAP, not forecasts.
Markets carry risk of loss. Always use independent risk management, position sizing, and your own trading plan. Past behaviour of any signal does not imply future performance.
Indicador

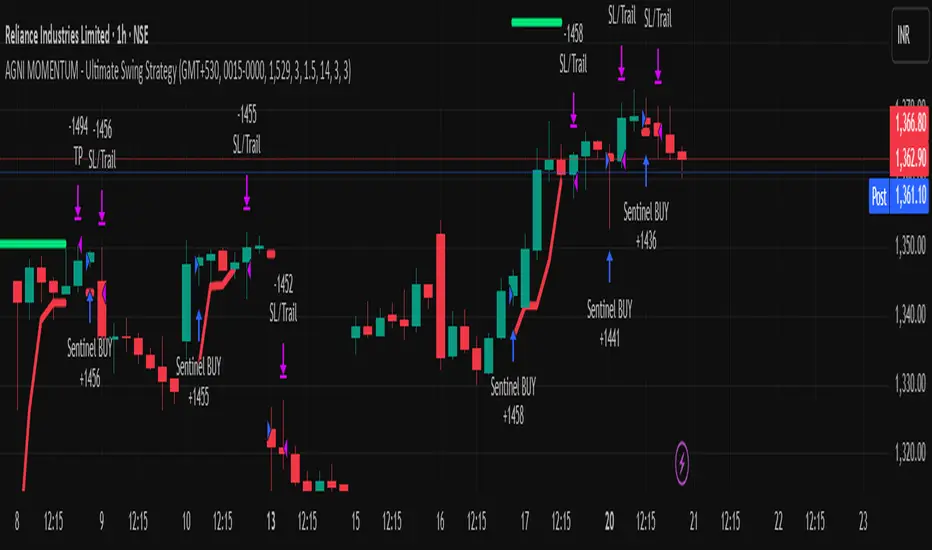
AGNI MOMENTUM - Ultimate Swing StrategyThe AGNI MOMENTUM is a high-performance swing trading system developed by The Stock Yogi. Designed specifically for the 1-Hour, 4-Hour, and Daily timeframes, this strategy is built to identify and ride major market waves while maintaining professional-grade risk controls.
Why "AGNI" Momentum?
In the Indian markets, catching a trend at the right moment is like capturing fire. This strategy uses a triple-layered approach to ensure you only enter when the "spark" is confirmed and the trend has the fuel to continue.
Technical Pillars:
The Institutional Anchor (VWAP): We only look for Long opportunities when the price is trading above the Volume Weighted Average Price, ensuring we are on the side of institutional money.
The Momentum Trigger (Stochastic RSI): A precision-tuned oscillator that identifies overextended markets and triggers entries exactly as momentum shifts in our favor.
The Volatility Shield (ATR): Instead of fixed-point stops, we use Average True Range. This allows your stop loss to adjust automatically based on market "Garam-Hawa" (volatility), preventing unnecessary stop-outs.
The Trailing Sentinel: A built-in trailing stop follows the price, protecting your "Kamai" (earnings) as the trade progresses.
Key Features:
Optimized for Indian Markets: Defaulted to IST (GMT+5:30) with customizable session windows.
Aggressive Reward: Set to a default 1:3 Risk-to-Reward ratio to ensure long-term profitability.
Clean Visuals: Thick Target/SL lines and "AGNI Stickers" ($) make the trade status clear at a glance.
Toggle Flexibility: Easily switch off Sell trades to focus on a "Buy Only" trending market.
How to Use:
Preferred Timeframes: 1H, 4H for aggressive swings, 1D for structural wealth building.
Assets: Optimized for Nifty, BankNifty, and high-volume Blue-chip stocks. Estratégia

Multi-Anchor VWAP Grid [AGPro Series]Multi-Anchor VWAP Grid
🔹 Overview
Multi-Anchor VWAP Grid is a volume-weighted analysis tool that plots five independently anchored VWAP lines on the same chart — anchored from swing high, swing low, higher-timeframe pivot, all-time high, and session open. Each anchored VWAP includes optional ±1σ and ±2σ standard deviation bands, forming a dynamic grid of volume-weighted support and resistance levels. When three or more VWAPs converge within a tight ATR-based band, the indicator draws a rectangular confluence zone highlighting the area as a higher-probability price reaction region.
The script is fully automatic. All five anchors are detected by internal engines (pivot detection, session detection, timeframe change detection, all-time-high tracker) and require no manual date picking or retroactive anchor placement. Install the indicator, select which anchors you want active, and the grid builds itself.
🔹 What It Does Differently
Most anchored VWAP tools plot one anchor at a time and require the user to manually place the anchor each time a new swing or event is identified. This script plots five anchors simultaneously and lets them compete for relevance. When multiple independent anchors agree on a price level, that agreement itself becomes the signal — visualized as a confluence zone. A single VWAP is one data point. Five VWAPs intersecting within 0.5 ATR of each other is a structural event.
The confluence detection engine tests each active VWAP as a reference point, counts how many others fall within the user-defined ATR tolerance, and picks the densest cluster on each bar. A minimum VWAP count threshold (default 3) prevents noise, and a lifecycle manager extends, adaptively resizes, and expires zones based on bar age and midpoint drift.
🔹 Methodology
**Anchor engines**
Swing High and Swing Low VWAPs reset on each confirmed pivot using the standard ta.pivothigh / ta.pivotlow detector with a configurable lookback length. HTF Pivot VWAP resets at the start of each selected higher-timeframe period (daily, weekly, or monthly) using timeframe.change. ATH VWAP resets whenever a new all-time high is printed on the visible chart. Session Open VWAP resets at the first bar of each trading session defined by the session window input.
**VWAP calculation**
Each anchor maintains three running accumulators since its last reset: sum of (price × volume), sum of volume, and sum of (price² × volume). VWAP is computed as the first divided by the second. Standard deviation is derived from the variance identity: sqrt(E − E ²), where E and E are computed from the running accumulators. Bands are plotted at configurable multipliers of this running standard deviation.
**Confluence engine**
On each bar, the script evaluates every active VWAP as a potential cluster center. For each candidate center, it counts how many other active VWAPs fall within ATR × tolerance distance. The cluster with the highest count wins. If the winning count meets or exceeds the minimum threshold, the bar is marked as confluence-active.
**Zone lifecycle**
When confluence becomes active, a new rectangular zone is created spanning the min/max of the clustered VWAPs. As long as confluence remains active and the cluster midpoint drifts less than 0.5 ATR from its original midpoint, the zone extends to the current bar and adaptively resizes with rate-limited expansion (maximum 1 ATR growth per bar per direction, preventing erratic stretching). If the midpoint drifts more than 0.5 ATR, a new zone is created. A 5-bar debounce prevents micro-breaks in confluence from prematurely closing active zones. Zones auto-expire after a configurable age limit (default 120 bars).
🔹 Signals and Panel Readouts
The information panel in the top-right corner (position and theme configurable) displays:
- **Price Bias** — count of VWAPs price is currently above vs below, with an overall BULL / BEAR / MIXED classification
- **Confluence** — current status (active with cluster count, or none) and the minimum-count threshold in use
- **Closest VWAP** — which of the five VWAPs is currently closest to price, and the distance in ATR units
- **Active VWAPs** — each enabled VWAP's current value and percent distance from close
Two alert conditions are built in: new confluence zone detection, and price crossing any active VWAP line.
🔹 Key Inputs
**Anchor Points group** — toggle each of the five VWAPs on or off, set swing pivot lookback length, choose HTF timeframe (D/W/M), define the session window for intraday anchoring.
**Deviation Bands group** — toggle bands on or off, configure band 1 and band 2 multipliers, enable or disable gradient fills between VWAP and the first band.
**Confluence Zones group** — toggle zones on or off, set minimum VWAPs required for a confluence (2 to 5), adjust the ATR-based tolerance, define maximum zone age in bars.
**Panel group** — toggle panel, choose location (six positions), select Dark or Light theme, set font size (Small / Normal / Large).
**Labels group** — toggle the compact end-of-line labels that identify each VWAP at the right edge of the chart.
🔹 How to Use
This indicator is designed as a context layer, not a standalone entry signal. Suggested workflow:
**1. Identify structural bias.** Check the Price Bias row in the panel. If 4 or 5 VWAPs sit below price (BULL), the market is trading above its most relevant volume-weighted averages across multiple timeframes and event contexts. The opposite applies for BEAR.
**2. Watch for confluence formation.** When the panel shows Confluence ACTIVE with 3 or more VWAPs clustered, a meaningful volume-weighted support or resistance area is forming. These zones often precede reaction or reversal behavior.
**3. Use bands for context.** When price trades near the ±1σ band of a single VWAP, reversion back toward that VWAP is statistically more likely. ±2σ extensions indicate volatility outliers.
**4. Cross-reference with your own tools.** This script is most useful combined with price action, volume profile, or a trend filter of your choice. It does not generate entries or exits on its own.
🔹 Tips
- On crypto 24h markets, set Session Window to 0000-2359 for a full-day session VWAP.
- Higher Swing Pivot Length values (30–50) filter noise on higher timeframes; lower values (10–15) are better for intraday.
- If the chart feels visually crowded, disable the ±2σ bands or reduce the number of active anchors. All five are rarely needed simultaneously.
- For the strongest confluence signals, increase Min VWAPs for Confluence to 4 — rarer but higher conviction.
🔹 Limitations and Transparency
- The script uses standard Pine Script pivot detection for swing anchors. Pivots are confirmed only after the pivot length has passed, which means swing VWAP anchors are placed retrospectively by that many bars. This is an inherent limitation of all pivot-based tools, not a bug.
- ATH tracking is limited to the visible chart range. On timeframes or symbols where the chart does not load full history, the "ATH" anchor represents the highest point within loaded data, not the true all-time high.
- Standard deviation bands assume price dispersion around each VWAP is approximately normal over the anchored period. In strongly trending markets, this assumption weakens and bands may widen significantly.
- Confluence zones are descriptive, not predictive. They mark areas where multiple volume-weighted averages happen to agree. They do not guarantee price reaction, only indicate where reaction is more plausible than average.
- Session Window input must match the instrument's trading hours to produce a meaningful intraday VWAP. Incorrect session definitions will produce misleading anchor points.
🔹 Risk Disclosure
This indicator is provided for educational and analytical purposes only. It is not financial advice, investment advice, or a recommendation to buy, sell, or hold any asset. All trading involves substantial risk of loss. Past chart behavior and historical VWAP reactions do not guarantee future results. Users are solely responsible for their own trading decisions and risk management. Always combine indicator output with independent analysis and appropriate position sizing. The author accepts no responsibility for any financial outcome resulting from the use of this script. Indicador

Indicador

SHK 3 MA EMA WMA | VWAP | TRIANGLE CROSS━━━━━━━━━━━━━━━━━━━━━━━━━━━━━━━━━━━━━━
SHK 3 MA EMA WMA | VWAP | ▲▼ CROSS
━━━━━━━━━━━━━━━━━━━━━━━━━━━━━━━━━━━━━━
A clean and powerful multi-purpose trend indicator combining
3 fully customisable Moving Averages with crossover signals
and an anchored VWAP — all in one overlay.
━━━━━━━━━━━━━━━━━━━━━━━━━━━━━━━━━━━━━━
MOVING AVERAGES
━━━━━━━━━━━━━━━━━━━━━━━━━━━━━━━━━━━━━━
• 3 independent Moving Averages — MA1, MA2, MA3
• Each MA is individually selectable as EMA / SMA / WMA
• Each MA has its own length input
• Default lengths: MA1 = 9 | MA2 = 21 | MA3 = 50
• Color, opacity, thickness and line style controlled
directly from the chart legend (click the line name)
━━━━━━━━━━━━━━━━━━━━━━━━━━━━━━━━━━━━━━
CROSSOVER SIGNALS
━━━━━━━━━━━━━━━━━━━━━━━━━━━━━━━━━━━━━━
Two sets of cross signals with triangle labels:
▲ MA1 × MA2 — Bullish cross (triangle below bar)
Label shows actual lengths e.g. "9×21"
▼ MA1 × MA2 — Bearish cross (triangle above bar)
Label shows reversed lengths e.g. "21×9"
▲ MA2 × MA3 — Bullish cross (triangle below bar)
Label shows actual lengths e.g. "21×50"
▼ MA2 × MA3 — Bearish cross (triangle above bar)
Label shows reversed lengths e.g. "50×21"
Triangle colors match their respective MA line colors.
━━━━━━━━━━━━━━━━━━━━━━━━━━━━━━━━━━━━━━
VWAP
━━━━━━━━━━━━━━━━━━━━━━━━━━━━━━━━━━━━━━
• Volume Weighted Average Price (VWAP)
• Selectable anchor period:
Session | Week | Month | Quarter | Year
• Toggle on/off from settings
• Color, opacity, thickness and line style
controlled from chart legend
━━━━━━━━━━━━━━━━━━━━━━━━━━━━━━━━━━━━━━
ALERTS
━━━━━━━━━━━━━━━━━━━━━━━━━━━━━━━━━━━━━━
4 built-in alert conditions:
• MA1 Crossed Above MA2 ▲ (Bullish)
• MA1 Crossed Below MA2 ▼ (Bearish)
• MA2 Crossed Above MA3 ▲ (Bullish)
• MA2 Crossed Below MA3 ▼ (Bearish)
━━━━━━━━━━━━━━━━━━━━━━━━━━━━━━━━━━━━━━
HOW TO USE
━━━━━━━━━━━━━━━━━━━━━━━━━━━━━━━━━━━━━━
1. Add indicator to chart
2. Set MA types and lengths in Settings
3. Click any line name in chart legend to
adjust color, opacity, thickness and style
4. Use VWAP as dynamic support/resistance
5. Set alerts from the Alerts menu
━━━━━━━━━━━━━━━━━━━━━━━━━━━━━━━━━━━━━━
⚠️ DISCLAIMER
━━━━━━━━━━━━━━━━━━━━━━━━━━━━━━━━━━━━━━
This indicator is for educational and
informational purposes only. It does NOT
constitute financial advice, investment
advice, or a recommendation to buy or sell
any financial instrument.
Past performance of any indicator or strategy
does not guarantee future results. Trading
involves significant risk of loss and is not
suitable for all investors. Always do your own
research and consult a qualified financial
advisor before making any trading decisions.
The author accepts no responsibility for any
losses incurred from the use of this indicator.
━━━━━━━━━━━━━━━━━━━━━━━━━━━━━━━━━━━━━━
© SHK — All rights reserved
━━━━━━━━━━━━━━━━━━━━━━━━━━━━━━━━━━━━━━ Indicador

Indicador

Indicador

Indicador

Indicador

Statistical VWAP study: Session and RTH VWAPSession & RTH VWAP — Statistical VWAP Study
This indicator plots two independently calculated Volume Weighted Average Price lines — one anchored to a user-defined pre-market or custom session, and one anchored to the Regular Trading Hours (RTH) open — and combines them into a statistical study that tracks the relationship between the two lines over time. Beyond the two VWAP lines themselves, the indicator calculates a set of statistical deviation bands derived from the midpoint between both VWAPs, maintains a live stats table that tracks retest and crossover behaviour with timing data, and records win/loss statistics based on the directional relationship between the two lines at the close of each RTH session.
The indicator is designed for equity futures traders and anyone who trades instruments with a defined RTH session, though it will function on any market where session times can be configured. It is most useful on intraday timeframes, particularly 1-minute through 15-minute charts, where the two VWAP lines are meaningfully separated and the statistical bands have enough bar data to fill in during the session.
─────────────────────────────────────────────
HOW THE TWO VWAPs WORK
─────────────────────────────────────────────
The Session VWAP anchors to the start of a configurable pre-market or custom session each day and recalculates bar by bar from that anchor using the standard cumulative price-times-volume divided by cumulative volume formula. Because it anchors before the RTH open on most configurations, it captures the overnight sentiment and carry-forward context that the RTH VWAP does not see. The line resets each day at the session start and, uniquely, reanchors dynamically if price makes a new session high — meaning the anchor always sits at the highest point reached during the session rather than being fixed at the first bar. This makes the Session VWAP a high-anchored VWAP that tracks where the average transaction has occurred relative to the session's developing high.
The RTH VWAP anchors to the first bar of the Regular Trading Hours session each day — defaulting to 09:30 EST — and calculates forward from that point. It is a straightforward daily VWAP in the conventional sense, widely used by institutional participants as an execution benchmark. It resets at the RTH open every day regardless of overnight price action.
Both VWAPs have independent price source inputs, so you can, for example, run the Session VWAP on HLC3 and the RTH VWAP on the close, or set both to the same source. Both default to HLC3. Previous session VWAP lines can be displayed on chart for historical context, with the number of retained sessions configurable up to 100.
─────────────────────────────────────────────
THE ANCHOR AND DEVIATION BANDS
─────────────────────────────────────────────
Once both VWAPs are active during the RTH session, the indicator calculates a midpoint anchor on each bar as the simple average of the two VWAP values at that moment. This anchor represents an equilibrium level between the two measures — a price around which both institutional benchmarks are balanced. The anchor can be plotted as a standalone line if desired.
All statistical bands are then derived as offsets from this anchor, calculated from the distribution of bar-by-bar deviations of the price source from the anchor during the current RTH session. Each bar inside the RTH session contributes a deviation value (price minus anchor) and an absolute deviation value to a running intraday dataset that the band calculations draw from. Every band type resets at the RTH open and builds from scratch each session, meaning the bands are always describing the current day's price behaviour relative to the anchor rather than any historical average.
Symmetric Standard Deviation Bands (± 1σ and ± 2σ)
These are calculated using the volume-weighted variance of all bar deviations from the anchor during the session. The formula weights each bar's squared deviation by its volume, so high-volume bars contribute proportionally more to the width of the bands than low-volume bars. The result is a proper volume-weighted standard deviation, not a simple statistical standard deviation. The ± 1σ bands mark the range within which approximately 68% of volume-weighted price activity has occurred relative to the anchor, and ± 2σ marks roughly 95%. On a well-behaved session these bands will tend to expand gradually and consistently as the day progresses. A sudden widening indicates a volatile push away from the anchor with significant volume behind it.
Asymmetric Standard Deviation Bands
Rather than computing a single standard deviation across all deviations, the asymmetric bands split the deviation dataset into two groups: bars where price was above the anchor and bars where price was below the anchor. A separate volume-weighted variance is computed for each group, yielding an upper sigma and a lower sigma. The upper band sits at anchor plus the upper sigma, and the lower band sits at anchor minus the lower sigma. When the upper band is wider than the lower band, the session's upside volatility has been greater than its downside volatility — the distribution is stretched to the upside. The reverse indicates downside skew. This is a more honest representation of intraday volatility than symmetric bands when the session has a directional bias, since symmetric bands will always produce identical upper and lower widths regardless of where price has actually been spending its time.
Median Absolute Deviation Bands (MAD)
The MAD bands are calculated from the median of all absolute deviation values collected during the session. Rather than squaring deviations as standard deviation does, MAD takes the median of their absolute values, making it substantially more resistant to outlier bars. A single spike bar with a large deviation will pull the standard deviation bands outward significantly, but will have very little impact on the MAD bands if the majority of bars have remained close to the anchor. In practice, if the MAD bands are noticeably narrower than the ± 1σ bands, it suggests the session has had one or more sharp but brief excursions from the anchor while most activity has been tightly contained. If the two are similar in width, price volatility has been more evenly distributed throughout the session.
Percentile Bands (10th, 25th, 75th, 90th)
These bands are calculated by sorting the full array of per-bar deviations accumulated during the session and finding the deviation at each percentile using linear interpolation between adjacent values. The result is added to the anchor to produce the plotted level. The 25th and 75th percentile bands define the interquartile range — the zone within which the middle 50% of bars have traded relative to the anchor. The 10th and 90th percentile bands mark the outer boundaries that only 10% of bars have exceeded on each side. Unlike standard deviation bands, percentile bands make no assumption about the shape of the deviation distribution. They are purely empirical — they describe exactly where price has been during the session without any statistical model underlying them. On a trending session the percentile bands will be visibly asymmetric, sitting closer together on one side of the anchor and more spread on the other, directly reflecting the directional distribution of bars.
VWAP of Deviations
This is a single line calculated as the volume-weighted mean of all bar deviations from the anchor during the session. It is plotted as an offset from the anchor — if the line is above the anchor, it means that volume has been transacting above the anchor on a net basis throughout the day. If it is below, the heavier volume has been printing below the anchor. At the very start of the RTH session when both VWAPs are close to each other the line will be near the anchor, and it will drift in the direction where the heavier volume has been occurring as the session progresses. It functions as a volume-weighted bias indicator — a reading consistently above the anchor suggests buyers have been more active on a volume basis, and vice versa.
─────────────────────────────────────────────
CONFIGURATION — SESSIONS SETTINGS
─────────────────────────────────────────────
Time Zone sets the timezone used to interpret the Session window. The tooltip reminds you that GMT and UTC are equivalent. Match this to the timezone shown in the bottom right of your TradingView chart. The default is GMT-4, which corresponds to US Eastern Daylight Time.
Session defines the start and end time of the window within which the Session VWAP is active and accumulating. The default is 0600-0900, representing the pre-market period from 6am to 9am Eastern. You can change this to any time window that suits your instrument and trading style. On instruments without an extended pre-market you might set this to your own session open or any other meaningful anchor time.
Highlight Session enables a background colour fill on bars that fall within the session window, making it easy to see which bars are contributing to the Session VWAP. The colour is configurable next to the toggle and defaults to a faint aqua.
─────────────────────────────────────────────
CONFIGURATION — ANCHOR SESSION VWAP SETTINGS
─────────────────────────────────────────────
VWAP Source sets the price input used for the Session VWAP calculation. The default is HLC3 (the average of high, low, and close), which is the conventional choice for VWAP calculations. Other available options include close, open, HL2, OHLC4, and HLCC4. Changing this will affect both the VWAP line itself and the deviation values used in the band calculations, since the bands use vsrc as their price input.
Session VWAP enables or disables the Session VWAP line on the chart. The colour and line width are set using the colour picker and width field next to the toggle.
Show Previous Session VWAPs enables the display of completed Session VWAP lines from prior days, drawn in the same colour as the live line. These give you a visual history of where previous sessions' VWAPs settled and how the current session compares.
Number of Previous Sessions controls how many prior session VWAP lines are retained on the chart. The range is 1 to 100, defaulting to 50. Higher values provide more historical context but may create visual clutter on longer lookback charts.
─────────────────────────────────────────────
CONFIGURATION — RTH VWAP SETTINGS
─────────────────────────────────────────────
Show RTH VWAP enables or disables the RTH VWAP line. The colour and width are set using the adjacent controls. The RTH VWAP defaults to purple at width 2, making it visually distinct from the thinner Session VWAP.
RTH Session Time (EST) sets the start and end of the RTH window using a session string in the format HHMM-HHMM, interpreted in the America/New_York timezone. The default is 0930-1600, representing the standard US equity market session. Change this for futures instruments that have different session boundaries, or for non-US markets where you want to define a custom RTH equivalent.
RTH VWAP Source sets the price input used specifically for the RTH VWAP calculation, independently of the Session VWAP source. It defaults to HLC3. Having separate source inputs means you can experiment with different price inputs on each line — for example running the RTH VWAP on the close while keeping the Session VWAP on HLC3 — or simply keep both on the same source for consistency.
─────────────────────────────────────────────
CONFIGURATION — STATS TABLE
─────────────────────────────────────────────
Show Stats Table enables or disables the on-chart statistics table.
Position sets where the table appears on the chart. Options cover all eight corners and edge-centre positions. The default is Top Right.
Text Size controls the font size used throughout the table. Options are Tiny, Small, and Normal. Small is the default and suits most screen configurations.
Max Days to Track sets the maximum number of completed RTH sessions the indicator retains in its historical arrays for statistical calculations. The range is 10 to 500, defaulting to 100. Increasing this provides more statistically stable averages but increases memory usage. All statistics in the table — win rate, retest averages, timing distributions, hourly breakdowns — are computed across however many sessions have been recorded up to this limit.
─────────────────────────────────────────────
CONFIGURATION — BAND LEVELS
─────────────────────────────────────────────
Each band type has a checkbox to enable it and one or more colour pickers to control how it appears. All bands are off by default. Each is described in detail in the statistical bands section above. The controls are:
Anchor (midpoint) — enables the midpoint line between the two VWAPs, with a single colour picker. Useful as a reference when evaluating the bands.
± 1σ (symmetric) — enables the symmetric ± 1 standard deviation bands, with a single shared colour applied to both the upper and lower line.
± 2σ (symmetric) — enables the symmetric ± 2 standard deviation bands, with a single shared colour.
Asymmetric σ (upper/lower) — enables the asymmetric bands with separate colour pickers for the upper and lower line, allowing you to visually distinguish upside from downside volatility.
MAD (± median abs dev) — enables the MAD bands with a single shared colour.
Percentile bands (10/25/75/90) — enables all four percentile bands with separate colour pickers for the inner pair (25th/75th) and the outer pair (10th/90th).
VWAP of deviations — enables the volume-weighted mean deviation line with a single colour picker.
─────────────────────────────────────────────
THE STATS TABLE — WHAT IT SHOWS AND HOW TO READ IT
─────────────────────────────────────────────
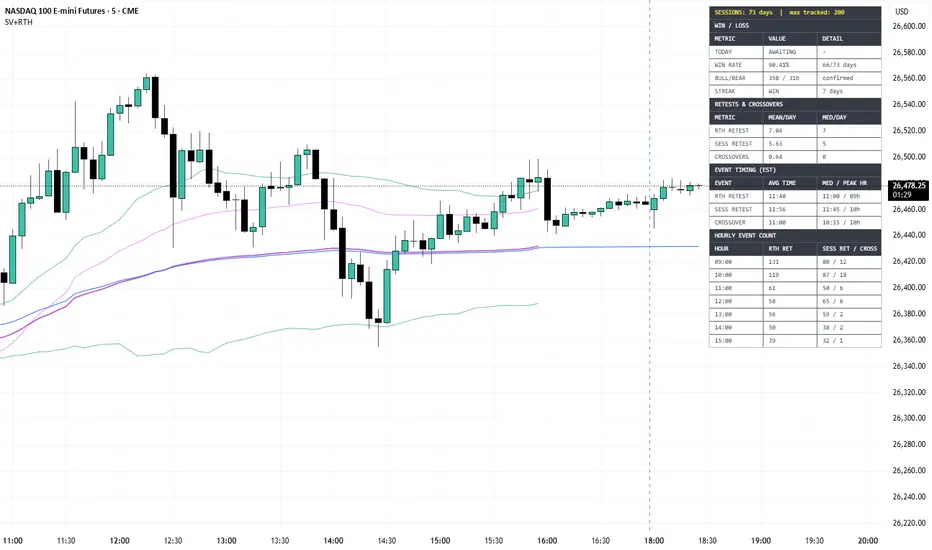
The table is divided into four sections. A yellow header row at the very top shows the total number of completed RTH sessions recorded and the maximum days setting, so you always know the sample size behind the statistics.
Sessions Coverage
The coverage row reads as "SESSIONS: X days | max tracked: Y". X is the number of completed RTH sessions the indicator has observed and recorded since being applied to the chart. Y is the Max Days to Track setting. Once X equals Y the oldest sessions begin dropping off as new ones are added, keeping a rolling window. On a 1-minute chart with 100 max days, the indicator will typically reach the maximum within the first few weeks of chart data.
Win / Loss
This section tracks whether the relative position of the two VWAPs at the end of the RTH session correctly predicted the directional close for that day.
The TODAY row shows the current live state: whether the RTH VWAP is currently above or below the Session VWAP (RTH ABOVE or RTH BELOW), and whether price is currently above or below the RTH open (BULL or BEAR). If the RTH session has not yet started, it shows AWAITING.
WIN RATE shows the percentage of completed sessions in which the end-of-day RTH VWAP position correctly predicted the directional close. A session is counted as a win when the RTH VWAP finished above the Session VWAP and price closed above the RTH open (a bullish alignment), or when the RTH VWAP finished below the Session VWAP and price closed below the RTH open (a bearish alignment). The detail column shows the raw count as wins over total sessions.
BULL/BEAR shows the breakdown of winning sessions by direction — how many of the wins were in the bullish alignment versus the bearish alignment. This helps identify whether the signal has directional asymmetry on your instrument.
STREAK shows whether the current streak is a run of wins or losses and how many consecutive sessions it has lasted.
Retests & Crossovers
This section measures two types of intraday behaviour: VWAP retests and VWAP crossovers.
A retest is recorded when a bar's wick crosses through one of the VWAPs but the bar's close remains on the same side it was on before the wick. In other words, price touches or briefly pierces the VWAP level but the candle does not close through it, indicating the level held. RTH RETEST counts retests of the RTH VWAP and SESS RETEST counts retests of the Session VWAP. The mean and median columns show the average and median number of these events per day across the recorded session history. A mean of 3.2 for RTH retests, for example, means the RTH VWAP is typically touched and rejected roughly three times per session.
A crossover is recorded when the RTH VWAP crosses above or below the Session VWAP on a confirmed bar. This is a stronger event than a retest because it means the two benchmarks have swapped relative positions. CROSSOVERS shows the average and median number of such crosses per day. On low-volatility days in a clearly directional instrument the crossover count may be zero or one. On ranging or volatile days it may be several.
Event Timing
This section answers the question of when during the RTH session these events tend to happen. For each of the three event types — RTH retest, Session retest, and crossover — it shows the average time, the median time, and the peak hour, all in EST.
The average time is the mean of the fractional hour at which each event has occurred across the full history, converted to a HH:MM display. The median time is the 50th percentile of that same distribution. The peak hour is whichever one-hour bucket between 09:00 and 15:00 has accumulated the most events in total across the session history.
If the median RTH retest time is 10:08 and the peak hour is 10h, that tells you retests of the RTH VWAP have historically been most concentrated in the first hour after the open. If the average and median are separated — say average is 11:30 but median is 10:45 — it suggests there is a tail of late-session events pulling the mean later, but most activity happens earlier.
Hourly Event Count
This section gives you the raw breakdown of event counts by hour, running from the 09:00 hour through to the 15:00 hour. Each row represents one hour and shows the total number of RTH retests, Session retests, and crossovers that have occurred during that hour across all recorded sessions. This is the full distribution from which the peak hour in the timing section is derived, and it lets you see the shape of that distribution rather than just the peak. An instrument where the hourly counts are spread fairly evenly across all hours behaves very differently to one where most events are concentrated in the 09:00 and 15:00 hours, and that pattern is immediately visible here.
─────────────────────────────────────────────
TIPS FOR EFFECTIVE USE
─────────────────────────────────────────────
Start with the two VWAP lines alone and observe how often the RTH VWAP and Session VWAP converge, diverge, and cross during your instrument's typical session. The relative position of the two lines at the open versus at midday and close is the core input to the win/loss tracking, so developing an intuition for how they interact on your specific instrument before enabling the bands is worthwhile.
The win rate statistic is a measure of historical alignment between the two VWAPs and the daily directional close — it is not a prediction of tomorrow's outcome. Its value is in telling you whether the two-VWAP relationship has had directional relevance on this instrument historically. A win rate significantly above 50% suggests the configuration carries predictive information worth paying attention to; near 50% suggests it has been essentially random.
For the statistical bands, start by enabling the symmetric ± 1σ and ± 2σ bands alongside the anchor line to get a baseline feel for the session's deviation range. Then enable the asymmetric bands on a few sessions where you noticed a strong directional bias to see how the upper and lower widths diverge. The MAD bands are most informative when compared directly against the ± 1σ bands — if MAD is substantially tighter it means the session has had outlier bars inflating the standard deviation that most of the session's activity did not participate in.
The VWAP of deviations line is a useful real-time bias read once you are familiar with it. In a session where the line has been consistently positive (above the anchor) since the open and has not reversed, the weight of volume is behind the bullish side of the anchor. A line that has drifted from positive to negative mid-session suggests a shift in volume-weighted participation, which often precedes or accompanies meaningful directional moves.
The timing data in the table is most useful when you have accumulated 50 or more sessions of history and are trading an instrument with a consistent intraday rhythm. Instruments with predictable open-range activity and a defined close pattern will show clear concentrations in the hourly breakdown. Instruments that are event-driven or highly macro-sensitive will tend to show flatter distributions.
The Max Days to Track setting has a meaningful effect on all statistics. A smaller value — say 20 or 30 — will make the statistics more responsive to recent conditions but noisier. A larger value — 200 or 500 — will produce more stable averages but may lag if the instrument's behaviour has changed regime. For most use cases 50 to 100 days strikes a reasonable balance.
On instruments where the pre-market session is not meaningful or does not exist, set the Session time window to a custom anchor of your choice — for example the overnight high or the globex open — and the Session VWAP will anchor from that point instead. The statistical framework operates identically regardless of what the session window represents.
─────────────────────────────────────────────
DISCLAIMER
─────────────────────────────────────────────
This indicator is provided for informational and educational purposes only. It does not constitute financial advice, investment advice, or a trading recommendation of any kind. All statistical outputs — win rates, retest averages, timing distributions — are derived from historical data and are not indicative of future results. The user assumes full responsibility for any trading decisions made using this tool. Always apply your own analysis and risk management. Indicador

Versatile ScalperAll In One indicator
A complete intraday trading suite built for scalpers and 0DTE options traders. Instead of cluttering your chart with 6 separate indicators this script combines everything into one clean overlay — Linear Regression, RSI candle coloring, VWAP, Supertrend signals, market structure labels and a full MA Ribbon. Every component is individually toggleable so you only see what you need.
What's inside:
Linear Regression + Signal Line
The white LinReg line shows the true underlying trend by fitting a regression curve to recent price action and cutting through noise. The signal line changes color in real time — green when momentum is rising, red when falling. The moment it changes color is your directional cue.
RSI Candle Coloring
Every candle on your chart turns lime green when RSI is above its SMA and red when below. No need to watch a separate RSI panel — momentum state is baked directly into your candles.
Session VWAP
The purple VWAP resets every session and shows where institutional traders are anchored for the day. Price above VWAP — bullish bias, look for calls. Price below — bearish bias, look for puts. Optional standard deviation bands show the normal trading range and extreme extension zones.
Supertrend Signals
Green triangle below the candle — the trend just flipped bullish. Red triangle above — bearish flip. Built in cooldown prevents the same signal from firing multiple times in a row. Fully toggleable when you don't need it.
HH / HL / LH / LL Labels
Automatically detects and labels Higher Highs, Higher Lows, Lower Highs and Lower Lows using pivot detection. Tells you the structure of the market at a glance — HH + HL pattern means uptrend intact, LH + LL means downtrend developing. Toggle on when you want structure context, toggle off for a clean chart.
MA Ribbon
Four fully customizable moving averages — choose SMA, EMA, RMA, WMA or VWMA for each one. Set any length and any color. All four default to off so you start with a clean chart and add only what you need.
How to use it:
🟢 Bullish setup:
Candles are lime green
Signal line is green and rising
Price is above VWAP
Supertrend fires green triangle
HH and HL labels confirming structure
🔴 Bearish setup:
Candles are red
Signal line is red and falling
Price is below VWAP
Supertrend fires red triangle
LH and LL labels confirming structure
Settings:
Every component has its own settings group — Linear Regression, RSI Candle Color, VWAP Levels, Supertrend, HHLL and MA Ribbon. Toggle any component on or off without affecting the others. Built for 1 minute SPY and SPX but works on any instrument and any timeframe. Indicador

Quantum Liquidity Map - VP, VWAP & CVD Confluence [NikaQuant]Info:
An overlay that combines three institutional order-flow methods — visible-range Volume Profile, session-anchored VWAP with standard-deviation bands, and Cumulative Volume Delta with divergence detection — into one coordinated tool for reading liquidity and order-flow conviction.
## Why This Combination Exists
Each of the three methods answers a different question about price, and none of them can answer the others alone. Volume Profile answers "where has the market actually traded?" — it locates the price levels participants have defended with size. Anchored VWAP answers "how far is the current price from the session's true volume-weighted average?" — it measures stretch from fair value. CVD divergence answers "is this move real?" — it exposes when a new price high or low is being printed on weakening order-flow pressure.
Used in isolation, each method produces false signals. A Value Area edge can be tagged without any participation. A VWAP band touch can continue for hours without mean-reverting. A CVD divergence can fire in a vacuum away from any structural level. The coordination is the entire point of this script: a Value Area edge touched while price is already two standard deviations stretched from VWAP, with a confirmed CVD divergence printing at the same bar — three independent systems agreeing — is a structurally different event than any one of them firing alone. The script exists to make that specific confluence visible in a single overlay without chart clutter or flipping between tools.
## How It Works
Volume Profile — The visible range is split into horizontal price buckets. Each completed bar's volume is distributed into the bucket containing its midpoint. The highest-volume bucket becomes the Point of Control (POC). From the POC outward, buckets are added alternately above and below (whichever neighbour carries more volume) until a configurable percentage of total volume is captured — 70% by default, following the CBOT value-area method. The upper and lower boundaries of that expansion become Value Area High (VAH) and Value Area Low (VAL). A previous-session POC that current price has not yet revisited is drawn as a "naked POC" — an untested volume cluster that tends to act as a magnet.
Anchored VWAP — The volume-weighted average price is calculated from scratch each time the anchor period resets (thirteen anchor options from one hour through yearly). Two standard-deviation bands are derived from the running variance of the weighted price distribution, with multipliers adjustable for both the inner and outer bands. Bands are deliberately suppressed for the first five bars of every new anchor period, because variance is mathematically unstable immediately after a reset and early spikes would be misleading.
CVD Divergence — Cumulative Volume Delta is estimated per bar using the close-location-within-range method: a bar that closes near its high is interpreted as predominantly buy-driven, one that closes near its low as sell-driven, and the net difference is summed across the session. Structural swing highs and lows are detected with equal left and right confirmation windows, which prevents repainting because a pivot is only recognised once both sides are closed. A divergence is flagged only when three conditions are met: (1) price prints a new swing extreme relative to the previous one, (2) the CVD value at that swing fails to confirm the new extreme, and (3) the swing itself exceeds 1.5 times the 14-bar Average True Range. The ATR gate is the key noise filter — it throws out minor pivots that would otherwise generate meaningless divergences during tight consolidations.
## How To Use It
- Start with the profile: locate POC, VAH, and VAL. These are the decision levels.
- Check the VWAP band zone (shown live in the dashboard). Inside ±1 standard deviation of VWAP, price is near fair value. Beyond ±2 standard deviations, it is statistically stretched and mean-reversion odds improve.
- Look for confluence at profile levels. A rejection candle at VAH while price is also outside the +2 standard deviation band on VWAP and a bearish CVD divergence has just fired is the highest-probability setup the indicator produces. The inverse applies at VAL.
- A naked POC tag accompanied by CVD trending in the same direction as the test is more likely to hold than one where CVD disagrees.
- Recommended timeframes: 5-minute through 4-hour for intraday; 1-hour through daily for swing. The VWAP anchor period should match the trading horizon — Session for intraday, Weekly or Monthly for swing.
- Recommended markets: liquid futures, major FX pairs, large-cap equities, and liquid crypto perpetuals — any market where per-bar volume is meaningful enough for the close-location-within-range buy/sell estimate to be informative.
- Avoid using on illiquid symbols where volume is sparse or spiky, and on non-standard chart types (Heikin Ashi, Renko, Kagi, Point & Figure, Range) — they distort both the profile inputs and the CVD calculation.
## Settings
- Profile Rows (default 60): number of horizontal buckets. Higher values give finer resolution at the cost of more noise per bucket.
- Value Area % (default 0.70): volume percentage that defines the value area, following the CBOT convention.
- Lookback Bars (default 48): how many completed bars of history feed the profile.
- Show Naked POC (default on): draws previous-session POCs that current price has not yet revisited.
- Profile Width (default 0.30): horizontal footprint of the heatmap as a fraction of the lookback window.
- CVD Pivot Lookback (default 5): bars required on each side to confirm a swing. Higher values produce fewer but stronger divergence signals.
- VWAP Period (default Session): anchor period from one hour through yearly.
- Inner SD Multiplier (default 1.0) and Outer SD Multiplier (default 2.0): standard-deviation band widths.
- Dashboard position, size, and dark-mode toggle: cosmetic only.
## Alerts
Four alert conditions are included, each with a JSON payload suitable for webhook routing:
- Price touches POC (within half an ATR)
- Price enters the VAH zone
- Price enters the VAL zone
- CVD divergence detected (bullish or bearish)
## Notes
- Non-repainting. Divergence signals fire only on confirmed (closed) bars and require both-sided pivot confirmation. The profile, VWAP and CVD values use historical bar data only, with no lookahead.
- The CVD estimate is range-based (close-location-within-range), not tick-based. On very short timeframes, where a single bar can contain many aggressive sweeps, this is an approximation of true order flow — it correlates well with tick CVD on liquid instruments but is not a substitute for it on sub-minute scalping.
- Overlay indicator, pinned to the right scale. Pine Script v6.
─────────────────────────────────────────
════════════════════════
Indicador

Daily + Anchored VWAP**Daily VWAP + Anchored VWAP (RTH / Full Session Toggle)**
This script provides a clean and reliable implementation of Daily VWAP along with an Anchored VWAP, designed to behave consistently across different session types and chart settings.
The Daily VWAP automatically resets each day based on the selected mode. In RTH mode, it resets on the first regular-session bar and only includes regular trading hours. In Full Session mode, it resets on the first bar of the day and includes all available price data. The calculation uses a proper cumulative price × volume divided by volume approach, ensuring accuracy with no gaps or delayed starts on the opening candle.
The script includes a historical display control that allows switching between showing only the current trading day or displaying a configurable number of previous trading days. The “today only” mode is handled using chart-based date detection, which avoids the common issues seen in other VWAP scripts where the first bars of the session are incorrectly excluded.
An Anchored VWAP is also included, which starts from the first session bar of a user-defined number of trading days back and accumulates forward to the present. This anchored VWAP operates independently from the daily VWAP visibility settings and remains stable regardless of whether historical display is enabled or not.
A session toggle allows switching between RTH-only behavior and full-session behavior. This setting applies consistently to both the Daily VWAP and Anchored VWAP, making it easy to compare how price interacts with VWAP under different session definitions.
This script is designed to avoid common VWAP issues such as incorrect start points, broken “today only” filtering, and inconsistent handling of extended hours. The logic separates reset conditions, accumulation, and display filtering to ensure stable and predictable output.
This tool is useful for intraday trading, tracking institutional positioning, anchoring VWAP to recent sessions, and analyzing price behavior across different session types.
Anchored VWAP requires sufficient historical data on the chart to include the selected anchor start point. Behavior may vary slightly depending on the symbol’s session definition and chart settings.
Built for precision and reliability, with a focus on correct behavior in real trading conditions.
Indicador

Pro Volatilite-v61. Hidden Trend Algorithm (Background)
The heart of the code actually beats with a SuperTrend logic. However, it differs from ready-made indicators on the market in two major ways:
Manual Calculation: Instead of the ta.supertrend function, the bands are calculated manually using ATR (Average True Range). This preserves the originality of the code.
ALMA Smoothing: Classic trend lines create sharp, angular "ladder" steps in price changes. Here we used ALMA (Arnaud Legoux Moving Average). ALMA is one of the smoothest averages on the market and makes the trendline silky smooth. This prevents an outsider from realizing it's a SuperTrend.
2. Triple Dynamic Average Set
Three different moving averages run simultaneously on the chart. These are usually set to 20, 50, and 200 periods:
Flexibility: You can change these numbers as you wish from the settings menu (e.g., 9, 21, 100).
Mode Selection: You can change the type of all three lines (SMA, EMA, or VWMA) with a single setting.
Visual Hierarchy: The lines have different thicknesses. The longest-term (200) line is drawn thickest to highlight the main support/resistance level.
3. Fully Customizable Interface
The most user-friendly part of the code is the control panel added to TradingView's "Settings" (gear) menu:
Color Control: You can choose the color tones you want for uptrends and downtrends.
Opacity: You can adjust how prominent the fill between the price and the trend line will be.
On/Off: If you think the screen is too cluttered, you can hide any of the 20-50-200 lines with a single click.
How it Works? (Strategic Use)
Trend Direction: If the main line, which is thick and sloping, is Turquoise (or your chosen color), the market is trending upwards; if it is Pink, it is trending downwards.
Signal Points: Small circles appearing just below or above the candles when the trend reverses indicate the start or end of a trend.
Support and Resistance: The 20, 50, and 200 lines show where the price will rest or rebound within the trend. For example, if the price touches the 50-period moving average (orange line) while above the main trend and receives a reaction, this can be considered a strong buying opportunity. Indicador

MNQ ORB Strategy - VWAP + BiasMNQ ORB Strategy
VWAP Filter + Directional Bias + Overnight Levels
TradingView Pine Script v5 Strategy | Micro E-mini Nasdaq Futures (MNQ)
─────────────────────────────────────────────────────────────────────
OVERVIEW
This strategy applies Opening Range Breakout (ORB) methodology to the Micro E-mini Nasdaq futures contract (MNQ). It combines a configurable ORB window with a VWAP directional filter, a directional bias control, and overnight high/low level plotting to give traders both systematic entry signals and meaningful market context at the regular session open.
The strategy is designed for backtesting and live execution on a 1-minute chart. All inputs are fully configurable so traders can test different ORB windows, tick-based profit targets and stop losses, and VWAP exit behavior without modifying the code.
─────────────────────────────────────────────────────────────────────
HOW IT WORKS
STEP 1 — OPENING RANGE FORMATION (9:30 to 9:40 ET default)
The strategy tracks every 1-minute bar between 9:30 and 9:40 AM Eastern Time, recording the highest high and lowest low of that window. At 9:40 the ORB is locked in for the day and does not change. Two levels are derived from the ORB:
- Buy Level: ORB High + buffer ticks — breakout level for longs
- Sell Level: ORB Low - buffer ticks — breakdown level for shorts
STEP 2 — VWAP FILTER
The VWAP filter prevents entries that conflict with the intraday trend. This is the most important filter in the strategy because index futures respect VWAP heavily — institutions use it as their primary execution benchmark throughout the session.
- Long entries only fire when price is above VWAP
- Short entries only fire when price is below VWAP
- The VWAP filter can be toggled off for backtesting without it
NOTE: If the ORB breaks but VWAP blocks the entry, the opportunity is marked as missed for the day. No re-entry is allowed after the initial breakout bar even if price later crosses VWAP. This prevents late, off-level entries that are a common source of poor fills in practice.
STEP 3 — FIRST DIRECTION LOCK
Once price breaks either the buy level or sell level, that direction is locked for the day. The opposite side cannot fire a signal after the first break. This prevents the common scenario where an instrument breaks one direction, reverses, and triggers a second trade in the opposite direction at a far worse price.
STEP 4 — DIRECTIONAL BIAS CONTROL
The bias dropdown allows traders to manually set the directional filter each morning based on their market analysis, stage analysis, or trend assessment:
- Both — strategy fires long and short signals (default)
- Long Only — only long breakouts above the ORB high are taken
- Short Only — only short breakdowns below the ORB low are taken
This is particularly useful for traders who use a broader market framework (stage analysis, macro trend, sector strength) to determine daily directional bias before the open. On strongly trending days, running the strategy in one direction only significantly reduces false signals.
STEP 5 — OVERNIGHT HIGH/LOW REFERENCE LEVELS
The strategy plots the overnight high and low (6pm prior day to 9:30am current day) as visual reference lines on the chart. These levels are not used in entry logic by default — they are provided as context for manual observation.
- Aqua line: overnight session high
- Fuchsia line: overnight session low
The info panel displays the opening context relative to the overnight range — whether price opened above the overnight high (bullish), below the overnight low (bearish), or inside the range (neutral). Traders can use this to inform their daily bias selection before the ORB window opens.
STEP 6 — EXIT MANAGEMENT
The strategy places OCO (one cancels other) exit orders immediately upon entry. Two exit modes are available:
- Standard TP/SL: fixed tick-based take profit and stop loss
- Trailing Stop: activates after price moves trail ticks in your favor,
then follows price dynamically with a hard stop as a
safety net
An optional VWAP cross exit can be enabled — this closes the position if price crosses back through VWAP against the trade direction. For longs, a cross below VWAP triggers a close. For shorts, a cross above VWAP triggers a close. This exit fires separately from the TP/SL and can reduce losses on failed breakouts significantly.
─────────────────────────────────────────────────────────────────────
INPUT REFERENCE
Input Default Group Description
─────────────────────────────────────────────────────────────────────
ORB Window (minutes) 10 ORB Settings Length of opening range window in minutes
Buffer (ticks) 4 ORB Settings Buffer added above ORB high and below ORB low
Contracts 2 Position Sizing Number of MNQ contracts per trade
Take Profit (ticks) 300 Risk Management Profit target in ticks from entry
Stop Loss (ticks) 150 Risk Management Stop loss in ticks from entry
Use Trailing Stop Off Risk Management Toggle trailing stop vs fixed TP/SL
Trailing Stop (ticks) 150 Risk Management Trailing stop distance once activated
Use ATR Filter On Filters Skip trade if ORB range exceeds ATR multiple
ATR Multiplier 1.5 Filters Max ORB range as multiple of 14-day ATR
Use VWAP Filter On Filters Long above VWAP only, short below VWAP only
Exit on VWAP Cross On Filters Close position if price crosses VWAP against trade
Trade Direction Both Bias Settings Both / Long Only / Short Only
Entry Window End 11 Session Settings Hour ET when new entries stop for the day
Show ORB Levels On Display Plot ORB high, low, buy and sell levels
Show VWAP On Display Plot VWAP line and background shading
Show Overnight Levels On Display Plot overnight high and low reference lines
Show Info Panel On Display On-chart label showing current settings and status
─────────────────────────────────────────────────────────────────────
TICK MATH REFERENCE
MNQ tick size: 0.25 points
Point value: $2.00 per contract
Tick value: $0.50 per contract
TP Ticks SL Ticks TP $ (2 contracts) SL $ (2 contracts)
─────────────────────────────────────────────────────────────────────
120 60 $120 $60
200 100 $200 $100
300 150 $300 $150
400 200 $400 $200
All configurations above maintain a 2:1 reward-to-risk ratio.
Break-even win rate at 2:1 R/R = 33.3%
─────────────────────────────────────────────────────────────────────
CHART VISUALS
- Blue line ORB High
- Red line ORB Low
- Lime line Buy Level (ORB High + buffer)
- Orange line Sell Level (ORB Low - buffer)
- Purple line VWAP
- Green background Price above VWAP (long bias)
- Red background Price below VWAP (short bias)
- Aqua dashed Overnight session high
- Fuchsia dashed Overnight session low
- Green triangle Long signal fired
- Red triangle Short signal fired
- Yellow X Breakout occurred but VWAP blocked entry
(entry missed for the day — no re-entry)
─────────────────────────────────────────────────────────────────────
INFO PANEL
The on-chart info panel displays real-time strategy status:
- Current bias mode
- Contracts and dollar value of TP and SL
- ORB range in ticks
- ATR filter status (PASS or FAIL)
- VWAP side (ABOVE or BELOW)
- Overnight context (opened above, below, or inside overnight range)
- Whether long or short entry was missed due to VWAP filter
- Whether the entry window is currently open
─────────────────────────────────────────────────────────────────────
BACKTESTING GUIDE
CHART SETUP
- Set chart to MNQ1! or the current active front month contract
- Set chart timeframe to 1 MINUTE — only timeframe that produces
accurate results
- Do not backtest on 5, 10, or 15 minute charts — signal detection
will be delayed and fills will be unrealistic
STRATEGY TESTER SETTINGS
- Commission: $0.35 per contract per side or $0.00 for comparison
- Slippage: 1-2 ticks to simulate realistic market order fills
- Capital: set to your intended trading capital
SUGGESTED TEST MATRIX
ORB Window TP Ticks SL Ticks VWAP Filter VWAP Exit
─────────────────────────────────────────────────────────────────────
5 min 120 60 On On
10 min 120 60 On On
10 min 300 150 On On
10 min 300 150 On Off
15 min 300 150 On On
10 min 300 150 Off Off
─────────────────────────────────────────────────────────────────────
TRADERSPOST INTEGRATION
TradingView alert setup:
- Condition: MNQ ORB Strategy - VWAP + Bias
→ alert() function calls only
- Message: {{strategy.order.alert_message}}
- Webhook URL: your TradersPost strategy webhook URL
- Trigger: Once Per Bar Close
Three alert types are sent:
- Buy signal: entry long with quantity
- Sell signal: entry short with quantity
- Exit signal: closes open position when TP, SL, or VWAP cross fires
NOTE: TP and SL are managed by TradingView strategy exits, not by
TradersPost. Configure your TradersPost strategy subscription to not
override exit orders.
─────────────────────────────────────────────────────────────────────
IMPORTANT NOTES
- This strategy is for MNQ futures only. Do not apply to stocks or
other instruments without modification.
- Always paper trade before going live.
- Overnight range plots require extended hours data enabled on your
TradingView plan.
- Entry window closes at 11:00 AM ET by default. Adjust the Entry
Window End input to test different cutoff times.
- VWAP resets at 9:30 AM ET (regular session open). Extended hours
VWAP behavior may differ from your broker's display.
─────────────────────────────────────────────────────────────────────
DISCLAIMER
This strategy is provided for educational and backtesting purposes
only. It does not constitute financial advice. Trading futures involves
substantial risk of loss and is not appropriate for all investors.
Always paper trade any new strategy before committing real capital.
Past performance does not guarantee future results. Estratégia

Volume-Weighted Price Drift📊 Volume-Weighted Price Drift — Accumulation / Distribution Detector
Ever noticed a stock quietly drifting 3–5% over a few days… on almost no volume? That's not random. Someone is patiently building (or exiting) a position, bar by bar, hoping nobody notices. This indicator measures exactly that.
─────────────────────────────────────────
🔍 WHAT IT DETECTS
─────────────────────────────────────────
The indicator tracks two things simultaneously:
📈 Price drift — How much has price moved directionally over the last N bars?
📦 Volume ratio — How does actual volume compare to its rolling average?
It then calculates a Drift Score:
Drift Score = |price change %| ÷ average volume ratio
A high score means price moved a lot while volume stayed suspiciously low. This is the footprint of patient accumulation (buying quietly) or distribution (selling quietly).
─────────────────────────────────────────
🧠 WHY IT WORKS
─────────────────────────────────────────
On markets with lower liquidity (like many stocks on GPW / Warsaw Stock Exchange), large players can't buy or sell openly without moving the price against themselves. Instead, they:
• Accumulate slowly over days/weeks using small orders
• Shake out weak hands with fake drops on thin volume
• Only let price run once they've built their position
This indicator catches the "quiet drift" phase — the part most people miss because it looks boring on the chart.
─────────────────────────────────────────
📐 HOW IT WORKS
─────────────────────────────────────────
The indicator runs on your current timeframe and shows:
🟩 Green drift score line — accumulation detected (price drifting UP on low volume)
🟥 Red drift score line — distribution detected (price drifting DOWN on low volume)
⚪ Grey drift score line — no signal (normal conditions)
🔵 Blue step-line — average volume ratio over the drift period (below 1.0 = below-normal volume)
Threshold lines:
🔴 Red dashed — strong signal threshold (default: 3.0)
🟠 Orange dotted — moderate signal threshold (default: 1.5)
🔵 Blue dotted — volume ceiling (default: 0.7 = 70% of normal)
⚪ White solid — baseline (1.0 = normal)
When conditions are met, alert labels appear with:
⚠️ Direction (ACCUM or DISTR)
📊 Exact drift %, volume ratio, and drift score
Background shading highlights active signal zones.
─────────────────────────────────────────
⚙️ SETTINGS
─────────────────────────────────────────
Core parameters:
• Drift lookback (bars) — how many bars to measure drift over. Default: 10.
• Volume MA length — rolling average for "normal" volume. Default: 20.
• Drift score smoothing — EMA smoothing. 1 = raw. Default: 3.
Thresholds:
• Max volume ratio for signal — signal only fires when avg volume is BELOW this. Default: 0.7 (70% of normal).
• Min price drift (%) — minimum absolute price change to count. Default: 1.0%.
• Strong signal threshold — drift score above this = strong signal. Default: 3.0.
• Moderate signal threshold — drift score above this = moderate signal. Default: 1.5.
Direction filter:
• Show accumulation — toggle UP-drift signals on/off.
• Show distribution — toggle DOWN-drift signals on/off.
Visual:
• Full color customization for all elements.
• Toggle labels and background shading independently.
• Adjustable background transparency.
Date range:
• Optional date filter to limit detection to a specific period.
─────────────────────────────────────────
✅ RECOMMENDED SETTINGS
─────────────────────────────────────────
For 1h chart (swing trading):
Drift lookback: 10
Volume MA: 20
Max volume ratio: 0.6–0.7
Min drift: 1.0%
Strong threshold: 3.0
Moderate threshold: 1.5
For daily chart (position trading):
Drift lookback: 5–10
Volume MA: 20
Max volume ratio: 0.7
Min drift: 1.5–2.0%
Strong threshold: 3.0
Moderate threshold: 1.5
For 5min chart (intraday):
Drift lookback: 20–30
Volume MA: 50
Max volume ratio: 0.6
Min drift: 0.3%
Strong threshold: 2.0
Moderate threshold: 1.0
─────────────────────────────────────────
💡 PRO TIPS
─────────────────────────────────────────
• Watch for clusters of DISTR followed by ACCUM — this often signals a shakeout-then-accumulate pattern where a large player pushes price down to scare retail, then quietly buys the dip.
• The strongest signals are NOT the ones with the highest drift — they're the ones with the lowest volume ratio. A 2% drift on 0.4x volume is more suspicious than a 5% drift on 0.9x volume.
• Combine with the AutomatOff indicator (ATR + Volume Collapse) — if automats go quiet AND drift score spikes, something is likely brewing.
• On illiquid GPW stocks, lower the volume ratio threshold to 0.5–0.6 for cleaner signals.
─────────────────────────────────────────
⚠️ DISCLAIMER
─────────────────────────────────────────
This indicator is a pattern detection tool, not a trading signal. Low-volume drift can happen for many reasons — always combine with your own analysis and risk management.
─────────────────────────────────────────
🛠️ BUILT WITH PINE SCRIPT v6
─────────────────────────────────────────
Open source. Part of the GPW Anomaly Detection toolkit alongside:
• AutomatOff (ATR + Volume Collapse + Still Price)
• Fixing Volume Visualization
Suggestions and bug reports welcome in the comments. Indicador

Indicador

NBSG_DayTrading_DashboardOverview
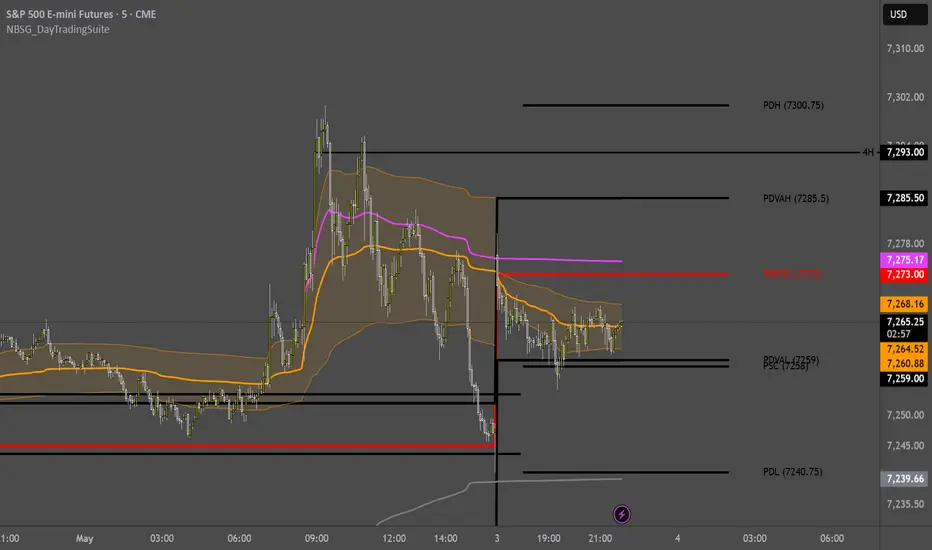
The NSBG Multi-Ticker Dashboard is a comprehensive, at-a-glance HUD designed for active day traders, specifically tailored for index futures (ES, NQ, YM). It aggregates critical volume and price-action data across multiple assets into a single, clean table, allowing traders to instantly gauge market context without flipping between charts.
Inspiration & Credit
This script was heavily inspired by the excellent "Volume Trading Concepts" indicator conceptualized by ASFX - Austin Silver. While his tool is incredibly useful, it is proprietary and kept behind a paywall for which users must pay monthly. We believe these core volume and VWAP concepts are foundational to modern day trading and should be freely accessible to the community. Besides with today's technology, it's not that hard to recreate any concept that you can verbalize.
Note for transparency: We did not have access to, nor did we use, any of the original ASFX source code. This indicator was engineered 100% from scratch to replicate the core philosophy while introducing our own unique logic, optimizations, design, and custom features.
Core Features & What Makes It Unique
We expanded on the original concept by adding specific levels and features that we find critical for evaluating intraday price action:
Dual View Modes (Multi vs. Single): * Multi-Ticker Mode: Tracks 3 separate assets simultaneously using request.security(). It displays price relation to the NY VWAP, Overnight VWAP, Prior Day NY VWAP, Previous Session Close, Opening Range, and overall Trend.
Single-Ticker Mode: Isolates the asset currently on your chart (or a manually selected symbol). Because calculating complex volume profiles across multiple tickers simultaneously breaks TradingView's execution limits, Single-Ticker mode unlocks the Session Volume Point of Control (POC).
The Previous Session Close (PSC): We integrated the PSC into the dashboard. Markets frequently respect the prior day's closing price as a magnet or pivot area, making it a crucial hidden level to track alongside VWAPs.
Intelligent Opening Range: The dashboard tracks the 08:30 - 08:45 Opening Range. To prevent false signals, the dashboard actively reads "Waiting..." or "Forming..." until the 15-minute range is officially locked in, after which it alerts you if the price is Inside, Outside ▲, or Outside ▼.
Custom Stacked-EMA Trend Calculation
Rather than simply basing the trend on VWAP positioning, we built a dedicated, traditional trend-evaluator using a Fibonacci EMA stack.
The script calculates the 5, 8, 13, 21, 34, 55, and 89-period EMAs, anchored by the 200-period SMA.
Very Bullish / Very Bearish: Triggers when the entire EMA stack is perfectly aligned in order above/below the 200 SMA.
Standard Bullish / Bearish: Triggers on a simplified base criteria (e.g., 21 EMA > 55 EMA > 200 SMA).
Timeframe Independence: You can set the trend calculation to look at a higher timeframe (e.g., 5-minute) while trading on a lower timeframe (e.g., 1-minute chart).
How to Use It
Add the indicator to your chart and open the settings.
Select your 3 preferred tickers for the Multi-Ticker view (defaults to Continuous Micro Futures: MES1!, MNQ1!, MYM1!).
Use the visual dots (🟢 Above / 🔴 Below) to quickly read where the current price is trading relative to major liquidity levels.
Switch to "Single-Ticker" mode in the settings when you want to track the exact Session POC for your active chart.
If any part of this code is valuable to you in building out your own idea or concept, please don't hesitate use it! Indicador

NBSG_DayTradingSuiteAn all-in-one day trading overlay designed by a futures trader for futures traders. It consolidates the key levels, anchored VWAPs, session volume profiles, and structural references that intraday traders typically spread across 3-5 separate indicators into a single, configurable script.
Built and defaulted for CME futures (ES, MES, NQ, MNQ, and similar instruments), but the session times are fully adjustable in settings. Traders on equities, crypto, or forex can adapt the indicator to their instrument by configuring the session windows to match their market's electronic trading hours.
The default session times are set for a trader operating in US Central Time (Chicago time). If you trade in a different timezone, adjust the session inputs accordingly.
This indicator is not a signal generator. It plots structure so you can make your own decisions.
FEATURES
Multiple Anchored VWAPs
The indicator plots two independent session-anchored VWAPs, each with optional standard deviation bands:
Overnight VWAP (VWAP 1) anchors at 17:00 CT (CME session open) and accumulates across the entire futures trading day through 16:00 CT. It resets cleanly each session. Optional 1SD and 2SD bands with fill show the statistical envelope around the developing VWAP.
NY Session VWAP (VWAP 2) anchors at 08:30 CT (Regular Trading Hours open) and accumulates through 16:00 CT. It includes a leapfrog mechanic: when the new RTH session begins, the prior session's VWAP is preserved and continues to plot as "Prev NY VWAP," giving you a reference for how price relates to yesterday's value during overnight trading.
Prev NY VWAP: This is the previous day's NY Session VWAP, which continues accumulating through the overnight session after the NY VWAP resets at 08:30. It provides a critical structural reference, particularly during the premarket and early RTH, showing where the prior session's volume-weighted equilibrium sits relative to current price. Many traders use the relationship between current price, the active NY VWAP, and the Prev NY VWAP to gauge directional bias.
All VWAPs use separate source, color, and line size settings.
Higher Timeframe VWAPs
Optional Weekly and Monthly VWAP overlays provide broader context without cluttering the chart. Disabled by default.
Session Volume Profiles (SVP)
Volume is distributed across the bar's high-low range using a configurable tick-based bin size (default: 2 ticks). The script calculates and plots:
Current Session SVP: POC and Value Area (VAH/VAL) for the active session, updating in real time.
Prior Day SVP: POC and Value Area from the previous completed session. These levels carry forward as horizontal references.
Last Week SVP: POC and Value Area from the prior completed week.
Each profile can be displayed as POC Only or POC + VA. The Value Area percentage is configurable (default: 70%).
Static Reference Levels
Prior Day High/Low (PDH/PDL): Previous day's range boundaries.
Last Week High/Low (LWH/LWL): Previous week's range boundaries.
Previous Session Close (PSC): The prior day's closing price.
Premarket High/Low (PMH/PML): Dynamically tracked during the 18:00-08:30 premarket session.
Opening Range (ORH/ORL): The first 15 minutes of RTH (08:30-08:45), with optional fill.
All static levels are individually togglable with independent color and size controls.
Deadzone
A configurable time window (default: 11:00-13:00 CT) highlighted with a background fill and border lines. This marks the midday period where volume and follow-through typically thin out on equity index futures. The time window is adjustable in settings.
Bar Coloring
Optional bar coloring based on the close's relationship to the three primary VWAPs (Overnight, NY, Prev NY). Bars are colored bullish when above 2 of 3, bearish when below 2 of 3, and neutral otherwise. Disabled by default.
Display Modes
A master display mode toggle lets you switch between:
Advanced All-Level: Shows everything you have enabled, the full suite.
Simplified VWAP: Strips the chart down to just the Overnight VWAP, NY VWAP, Prev NY VWAP, and Opening Range. All volume profiles, static levels, and the deadzone are automatically hidden. Useful for cleaner charts or when you want to focus purely on VWAP structure.
Labels
Every plotted level gets a text label with optional price display, offset to the right of the current bar for readability. Labels can be globally toggled on/off.
HOW TO USE
1. Add the indicator to your chart on an intraday timeframe (1m-30m recommended). It is defaulted for CME futures but can be adapted to any instrument by adjusting the session time inputs.
2. The default session times are built for US Central Time (Chicago). If your chart uses a different timezone, adjust the session inputs in the settings to match your market's session boundaries.
3. The default configuration shows most levels. Start by reviewing what each level represents, then toggle off anything that creates noise for your specific approach.
4. For cleaner charts, switch to "Simplified VWAP" mode, which isolates the core VWAP structure and Opening Range only.
CONFIGURATION
All session times, colors, line sizes, and visibility toggles are individually configurable. The settings are organized into numbered groups for clarity:
1. Master Display Mode
2. Session Times
3. NY VWAP Settings
4. Overnight VWAP Settings
5. Opening Range
6. Volume Profiles (SVP)
7. Static Levels
8. Higher Timeframe VWAPs
9. Deadzone
10. Bar Coloring
11. Labels
LIMITATIONS
The default session times are configured for CME futures with the standard 17:00-16:00 CT (close enough) session structure. If you are using this on equities, crypto, forex, or other instruments, you will need to adjust the session time inputs to match your market's electronic trading hours. The indicator will work on any instrument, but the session boundaries must be set correctly for accurate VWAP anchoring and level calculation.
This is a feature-rich script with multiple VWAPs, volume profiles, and level calculations running simultaneously. Tradingview handles it well the vast majority of the time, but on occasion the script may load slowly or display incompletely. If levels appear missing or the indicator looks off, a simple page refresh will typically resolve it.
The session volume profile uses a simplified volume distribution method (volume is evenly distributed across the bar's high-low range in tick-based bins). This is an approximation, not a tick-level volume profile. Accuracy improves on lower timeframes where bars have smaller ranges.
The Overnight VWAP session detection uses an hour-based reset (detecting when the bar's hour enters 17:00 in exchange time) rather than PineScript's built-in session boundary detection. This is intentional: on CME futures, the VWAP session (1700-1600) matches the instrument's native session, which prevents the standard session boundary method from firing correctly.
The deadzone time window relies on your chart's timezone setting. The default of 1100-1300 assumes US Central. Adjust if your chart uses a different timezone.
NOTES
This script is original work, but it stands on the shoulders of giants. The concepts and ideas behind it draw from numerous traders, educators, and open-source contributors who have freely shared their knowledge with the trading community. VWAP, volume profile, session levels, and opening range are not new ideas. What this script attempts to do is bring them together in a thoughtful, configurable way that reflects how an active futures day trader actually uses these tools in practice.
I built this for my own trading first. I am sharing it as open source because the open-source community on Tradingview gave me the foundation to learn, and this is my way of giving back what I have been given.
This is a structural tool, not a trading system. It does not generate buy/sell signals, alerts, or backtest results. Use it as a framework for building your own context around price action.
It's all risky, so you may as well make the bet.
Indicador

Indicador

AG Pro Anchored VWAP Event Map [AGPro Series]AG Pro Anchored VWAP Event Map
Overview / What it does
AG Pro Anchored VWAP Event Map is an overlay built to organize price action around Anchored VWAP after a meaningful starting point has been defined. Instead of treating VWAP as a single static reference, this script focuses on the relationship between price and a chosen anchor, then maps how the market behaves after that anchor is established. The goal is not to forecast price, but to make post-anchor structure easier to read in a consistent visual framework.
The script supports three anchor paths: Open, Swing, and Event. Open mode can reset the anchor from a daily, weekly, or monthly opening context. Swing mode rebuilds the anchor from a confirmed pivot high or pivot low. Event mode is designed for expansion-type situations and can anchor from a range expansion, a volume spike, or a breakout impulse. This creates a flexible workflow for traders who want to study how price responds to AVWAP under different structural conditions without switching tools.
Once the anchor is set, the script plots the Anchored VWAP, builds a distance band around it, tracks reclaim and reject behavior, and summarizes the current post-anchor bias in a compact panel. The result is a clean event map that can be used to study acceptance, rejection, recovery, or continuation around an anchored reference level. It is meant to simplify interpretation, not replace market context.
A key design goal of this script is clarity. The visual package is intentionally structured so the anchor, AVWAP path, distance zone, signal labels, and bias panel can be read together without turning the chart into a dense signal board. In practice, that means the indicator is most useful when it is treated as a contextual decision-support tool rather than a standalone trigger engine.
Unique Edge
The main distinction of this script is that it is not built as a generic VWAP overlay. Its emphasis is on post-anchor behavior. That means the visual logic starts from the selected anchor event and then evaluates how price interacts with the anchored VWAP afterward. In other words, the anchor is not only a starting point for the line itself; it is the center of the script's interpretation model.
Another differentiator is the combination of multiple anchor sources within one workflow. Traders can use opening-session logic, confirmed swing logic, or event-driven logic depending on the type of market behavior they are studying. This makes the indicator suitable for different styles of chart review while keeping the interface straightforward.
The distance band adds a second layer of structure. Rather than reading only the AVWAP line, users can also see whether price is operating close to the reference, stretched around it, or reacting from the upper or lower band zone. This helps frame whether a move appears to be re-accepting the anchored average, rejecting away from it, or trading in a more extended state.
The script also tries to keep the signal layer readable through selective label logic. Reclaim and reject markers are not intended to flood the chart. They are there to mark notable interactions with the anchored framework, while the panel provides a compact summary of the active anchor, current bias, distance, and latest signal state.
Methodology
The script begins by defining an anchor source. In Open mode, the anchor can be tied to a daily, weekly, or monthly opening transition. In Swing mode, the script waits for a confirmed pivot high or pivot low based on the selected swing length. In Event mode, the anchor is created only when a qualifying market event appears according to the selected event model.
For event-based anchoring, the script can use one of three internal conditions. Range Expansion looks for directional range behavior relative to ATR and recent structure. Volume Spike looks for directional participation with higher-than-average volume and a meaningful candle body fraction. Breakout Impulse looks for directional movement through recent extremes with supportive range and volume characteristics. These are practical anchor candidates for traders who want the AVWAP to begin from a meaningful change in behavior rather than from a calendar reset.
After the anchor is created, the script calculates Anchored VWAP using cumulative price-volume data relative to that anchor point. From there, it builds a distance band around the AVWAP. The band can be defined by ATR or percentage mode, depending on whether the user prefers a volatility-based or proportional framework.
Post-anchor bias is then derived from a simple internal score. The script evaluates whether price is above or below AVWAP, whether the AVWAP slope is improving or weakening, and whether price is trading beyond the distance band. This produces a practical Bullish, Bearish, or Neutral state. The intention is not to compress market structure into a perfect score, but to provide a compact directional read that can be used alongside the chart.
Reclaim and reject logic is based on how price interacts with the AVWAP and the surrounding band after the anchor is active. A reclaim highlights price moving back through the anchored reference with confirmation, while a reject highlights failure or pushback behavior around the band area. These events are intended as structural observations rather than guaranteed trade setups.
Signals & Alerts
The script includes reclaim and reject signal logic for both directions. These labels are designed to call attention to notable interactions with the anchored framework after the selected anchor becomes active. In practical use, reclaim behavior can be interpreted as a sign that price is attempting to re-establish acceptance relative to AVWAP, while reject behavior can suggest rejection away from the mapped zone.
Because market structure can become noisy, the script also includes signal spacing and density controls to reduce repetitive label clutter. This is especially relevant when anchored conditions remain active for long periods and price repeatedly tests the same area. The goal is to preserve readability while still marking relevant interactions.
Alert conditions are included for bullish reclaim, bearish reclaim, bullish reject, bearish reject, and a broader any-signal state. These alerts are deterministic within the script's ruleset, but they should still be used as workflow tools rather than interpreted as self-sufficient trading instructions.
Key Inputs
Anchor Source:
Choose whether the indicator should anchor from Open, Swing, or Event logic.
Open Anchor Type:
In Open mode, select daily, weekly, or monthly opening context.
Swing Length:
Controls how confirmed pivot highs and lows are detected in Swing mode.
Event Type:
In Event mode, choose between Range Expansion, Volume Spike, or Breakout Impulse as the anchor trigger model.
Event Lookback / Multipliers / Cooldown:
These inputs control how strict the event selection becomes and how frequently new event anchors can appear.
Band Mode:
Switch between ATR-based and percentage-based distance bands.
ATR Band Multiplier / Percent Band:
Define the width of the distance zone around Anchored VWAP.
Signal Density:
Helps regulate how aggressively reclaim and reject labels are displayed.
Panel and Label Size:
Allows the visual layout to remain readable across different chart styles and screen sizes.
Show Anchor Label / Show Anchor Level / Show Bias Ribbon:
These toggles control the visibility of anchor-focused visual elements and optional bias coloring.
Limitations & Transparency
This script is an interpretation aid. It does not identify the single correct anchor for all market environments. Different anchor choices can lead to different AVWAP paths, different reclaim or reject readings, and different conclusions. That is normal, and it is one of the reasons the script provides multiple anchor modes.
Event-based anchors depend on internal threshold logic such as ATR expansion, volume conditions, and breakout behavior. On some symbols or timeframes, those filters may trigger more frequently or less frequently than expected. Users may need to adjust event sensitivity and band settings to fit the market they are analyzing.
Reclaim and reject states are rule-based. They are not a guarantee of continuation, reversal, or follow-through. In sideways conditions, repeated AVWAP interactions can occur without producing a sustained directional move. The script can help organize those interactions visually, but it cannot remove market uncertainty.
The post-anchor bias is intentionally simplified. It is designed for readability, not for complete market classification. It should be read together with broader price structure, higher-timeframe context, liquidity conditions, and user-defined execution rules.
Risk Disclosure
This indicator is for chart analysis and workflow support. It does not provide financial advice, investment advice, or guaranteed outcomes. Markets involve risk, and any trading or investing decision remains the sole responsibility of the user.
No indicator can remove uncertainty from live markets. Anchored VWAP, reclaim behavior, reject behavior, and bias states are analytical references only. They should be validated with independent judgment, risk management, and broader market context before being used in any decision-making process.
Use this script as a structured visualization tool, not as a promise of performance or a substitute for disciplined trade planning.
Indicador

Indicador

Trading Sessions Suite [BackQuant]Trading Sessions Suite
Overview
Trading Sessions Suite is a full intraday structure framework built around market sessions, kill zones, and session-specific order flow . It transforms the trading day into a sequence of structured regimes, allowing you to track how liquidity, volatility, and positioning evolve across Asia, London, and New York.
Instead of treating price as a continuous stream, this indicator segments the market into time-based auction phases , each with its own:
Range (high and low)
VWAP (fair value)
Open (reference anchor)
Equilibrium (midpoint)
Momentum (session oscillator)
It also overlays kill zones , highlighting the exact windows where volatility and participation tend to expand.
Example of kill zones in action:
Example combining RSI-style oscillator + VWAP structure:
This tool is designed for traders who want to understand how intraday structure builds, shifts, and resolves .
---
Core Philosophy
Markets are not random throughout the day. Liquidity, volatility, and institutional participation are time-dependent .
Each session has distinct characteristics:
Asia → accumulation, compression, range-building
London → expansion, breakout, liquidity grabs
New York → continuation, distribution, reversal potential
Rather than using static indicators, this script builds a dynamic framework tied to these time regimes .
---
Session Engine
The indicator tracks three primary sessions:
Asia Session
London Session
New York Session
Each session is defined by a configurable time window and processed as an independent structure.
Internally, each session maintains a full state:
Session high and low
Session open
Rolling VWAP
Start index (session start)
Drawn objects (box, lines, labels)
Oscillator data (if enabled)
This allows each session to behave like a self-contained market environment .
---
Session Boxes (Auction Structure)
Each session is visualized as a box:
Top = session high
Bottom = session low
Width = duration of the session
This gives you an immediate view of:
Range expansion vs compression
Relative volatility between sessions
Where price is positioned within each session
Interpretation:
Tight box → compression, buildup
Wide box → expansion, active participation
Overlapping boxes → consolidation across sessions
---
Session VWAP (Fair Value per Session)
Each session has its own VWAP:
VWAP = volume-weighted average price within that session only
This is critical because:
VWAP resets every session
Reflects session-specific positioning
Acts as a dynamic equilibrium level
Interpretation:
Price above VWAP → bullish control for that session
Price below VWAP → bearish control
Reversion to VWAP → mean reversion inside session
Unlike standard VWAP, this gives you multiple fair value anchors per day .
---
Session Open & Midline (Key References)
Each session also tracks:
Open Line → where the session started
Midline → (high + low) / 2
These act as:
Bias indicators (above/below open)
Equilibrium zones (midline)
Reaction levels
Typical behavior:
Holding above open → trend continuation
Crossing midline → shift in control
Rejecting midline → continuation signal
---
Range Extension (Forward Liquidity Levels)
When a session closes, its high and low can be extended forward.
These extensions act as:
Future support/resistance
Liquidity targets
Breakout validation zones
Mechanically:
High and low are projected into the next session
Remain until replaced or invalidated
Interpretation:
Next session often trades toward previous session extremes
Breaks of prior session range = regime shift
---
Kill Zones (High-Probability Windows)
Kill zones are specific time windows inside sessions where:
Liquidity spikes
Volatility expands
Institutional activity increases
Included zones:
Asia Kill Zone
London Open Kill Zone
New York Open Kill Zone
New York Close Kill Zone
They are visualized as shaded boxes separate from session boxes.
Why they matter:
Most breakouts occur during kill zones
Most reversals are initiated during kill zones
Liquidity sweeps cluster around these times
From the example:
You can see how price reacts specifically within these windows.
---
Session Oscillator (Embedded Momentum Engine)
Each session optionally includes its own oscillator plotted directly below the session box.
This is not a standard indicator overlay. It is:
Bound to the session range
Scaled relative to that session
Reset each session
Core mechanics:
Uses RSI-style calculation
Signal line = moving average of oscillator
Stored per bar within the session
Displayed as:
A mini panel under each session
With 30 / 50 / 70 reference levels
Example:
Interpretation:
Above 50 → bullish momentum within session
Below 50 → bearish momentum
30/70 → oversold/overbought zones
This gives you contextual momentum , not global momentum.
---
Why Session-Based Oscillators Matter
Standard oscillators ignore time segmentation.
This approach:
Resets momentum every session
Prevents carryover noise
Aligns signals with actual trading windows
So instead of:
“RSI is overbought”
You get:
“RSI is overbought within London session”
This is a much stronger contextual signal.
---
Labels & Range Statistics
Each session can display:
Session name (ASIA, LON, NY)
Range percentage
This helps quantify:
How much the market moved during that session
Which session is dominating volatility
---
Putting It All Together
This indicator gives you a full intraday map:
Where price moved (session boxes)
Where fair value sits (VWAP)
Where equilibrium lies (midline)
Where momentum stands (oscillator)
Where volatility expands (kill zones)
Where liquidity rests (extended highs/lows)
---
How to Use It
1) Identify the current session
Always start with:
Which session is active?
Each session behaves differently.
---
2) Use VWAP + midline for bias
Above VWAP + above mid → strong trend
Below VWAP + below mid → bearish control
Between → range
---
3) Watch kill zones for setups
Breakouts during kill zones are higher probability
Fake moves often occur just before them
---
4) Track previous session levels
Asia high/low often targeted during London
London extremes often targeted during NY
---
5) Use oscillator for confirmation
Momentum aligning with structure → stronger signal
Divergence → potential reversal
---
Strengths
Fully contextual intraday framework
Combines time, price, and volume-weighted logic
Visual and intuitive
Highly configurable
---
Summary
Trading Sessions Suite converts the trading day into a structured sequence of auctions. By combining session ranges, VWAP, kill zones, and a session-specific momentum engine, it provides a complete framework for understanding how price moves throughout the day. Instead of relying on static indicators, it aligns analysis with when liquidity actually enters the market, allowing for more precise timing, better context, and cleaner trade execution. Indicador